Low-Level DC Leakage and Fault Currents in Transit Systems: Developing a Prototype for Detection and Mitigation (2025)
Chapter: Appendix C: Field Testing

APPENDIX C
Field Testing
The Southeastern Pennsylvania Transportation Authority (SEPTA) kindly allowed the research team to conduct field tests at their facilities. The team travelled to the SEPTA facility twice, to conduct preliminary measurements and final testing.
C.1 Testing Site
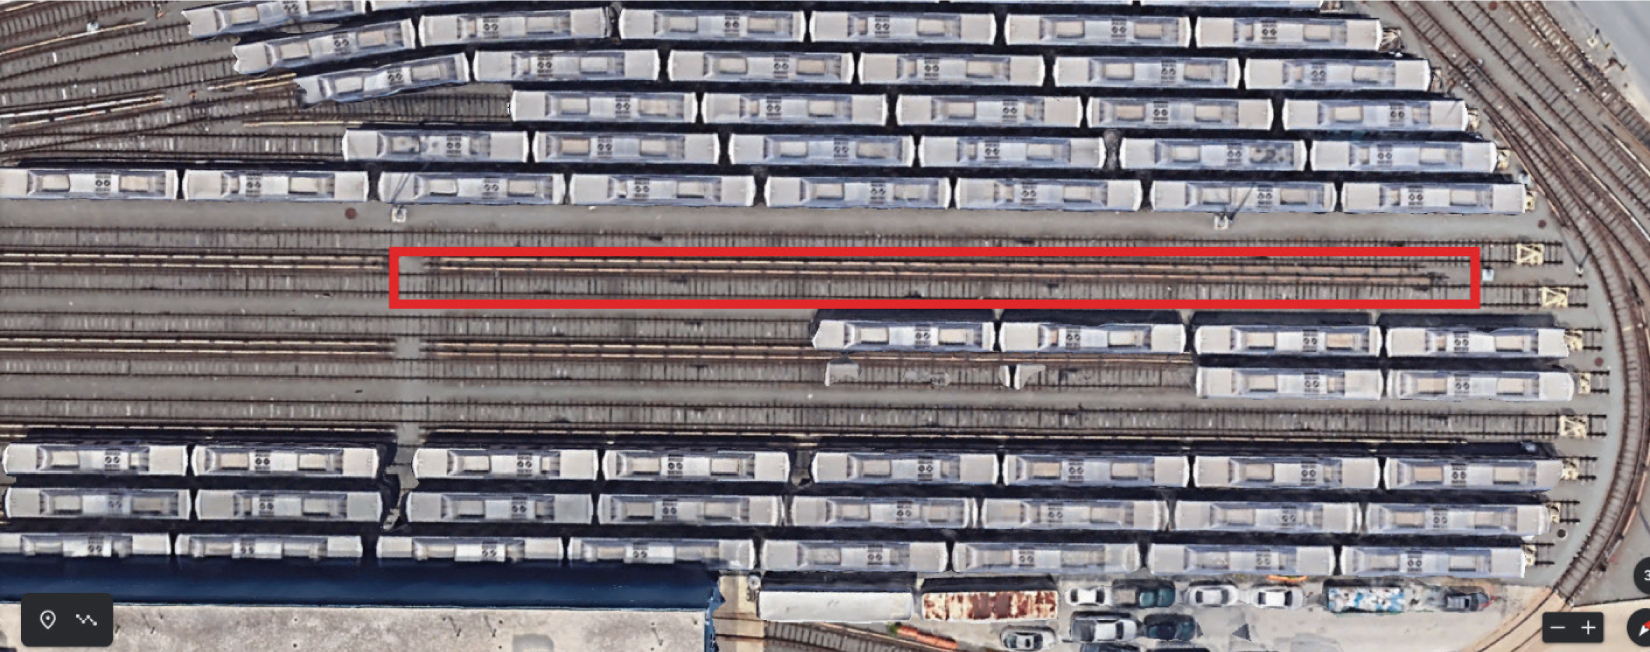
The tests were taken at the Upper Darby SEPTA facility. The mapping of the site is shown in Figure C.1.
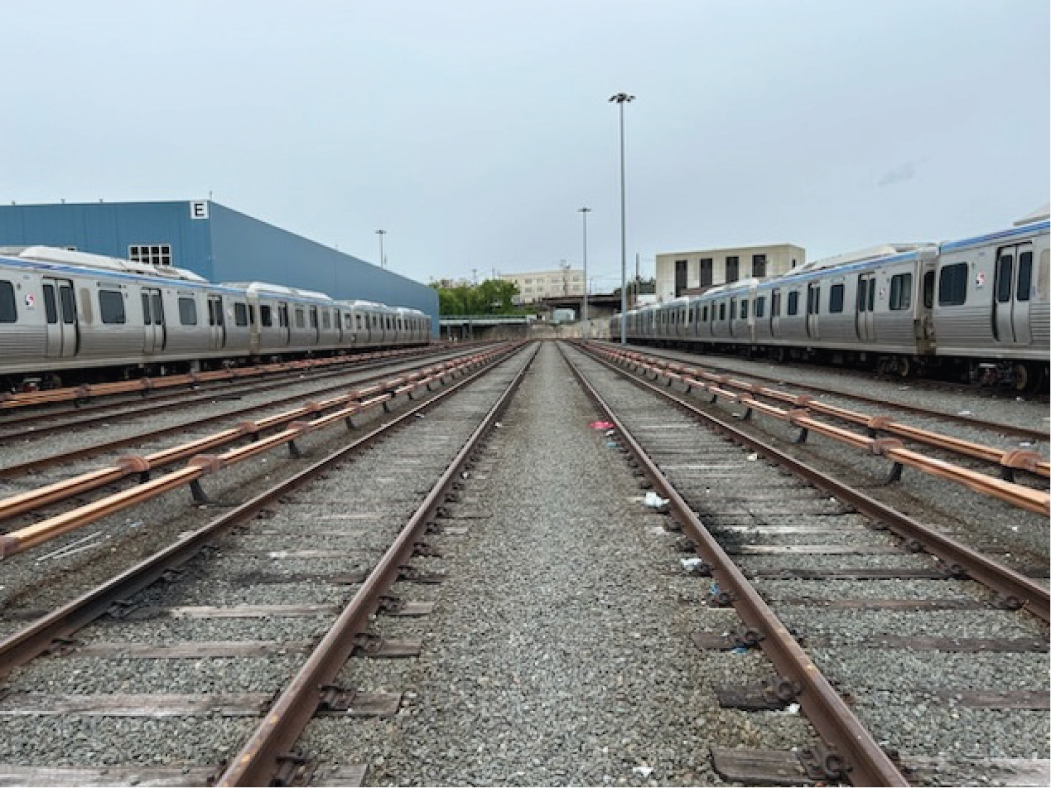
Two sections of track were used for testing. These sections were electrically isolated from the rest of the track. The first section of the track was 306 ft in length and connected electrically through cabling to the second section. The second section was measured to be 318 ft in length. In total, the track section under the test consisted of 624 ft of rail. Figure C.2 shows the picture of the sections, while the focused portion of the third rail and the track are shown in Figure C.3.
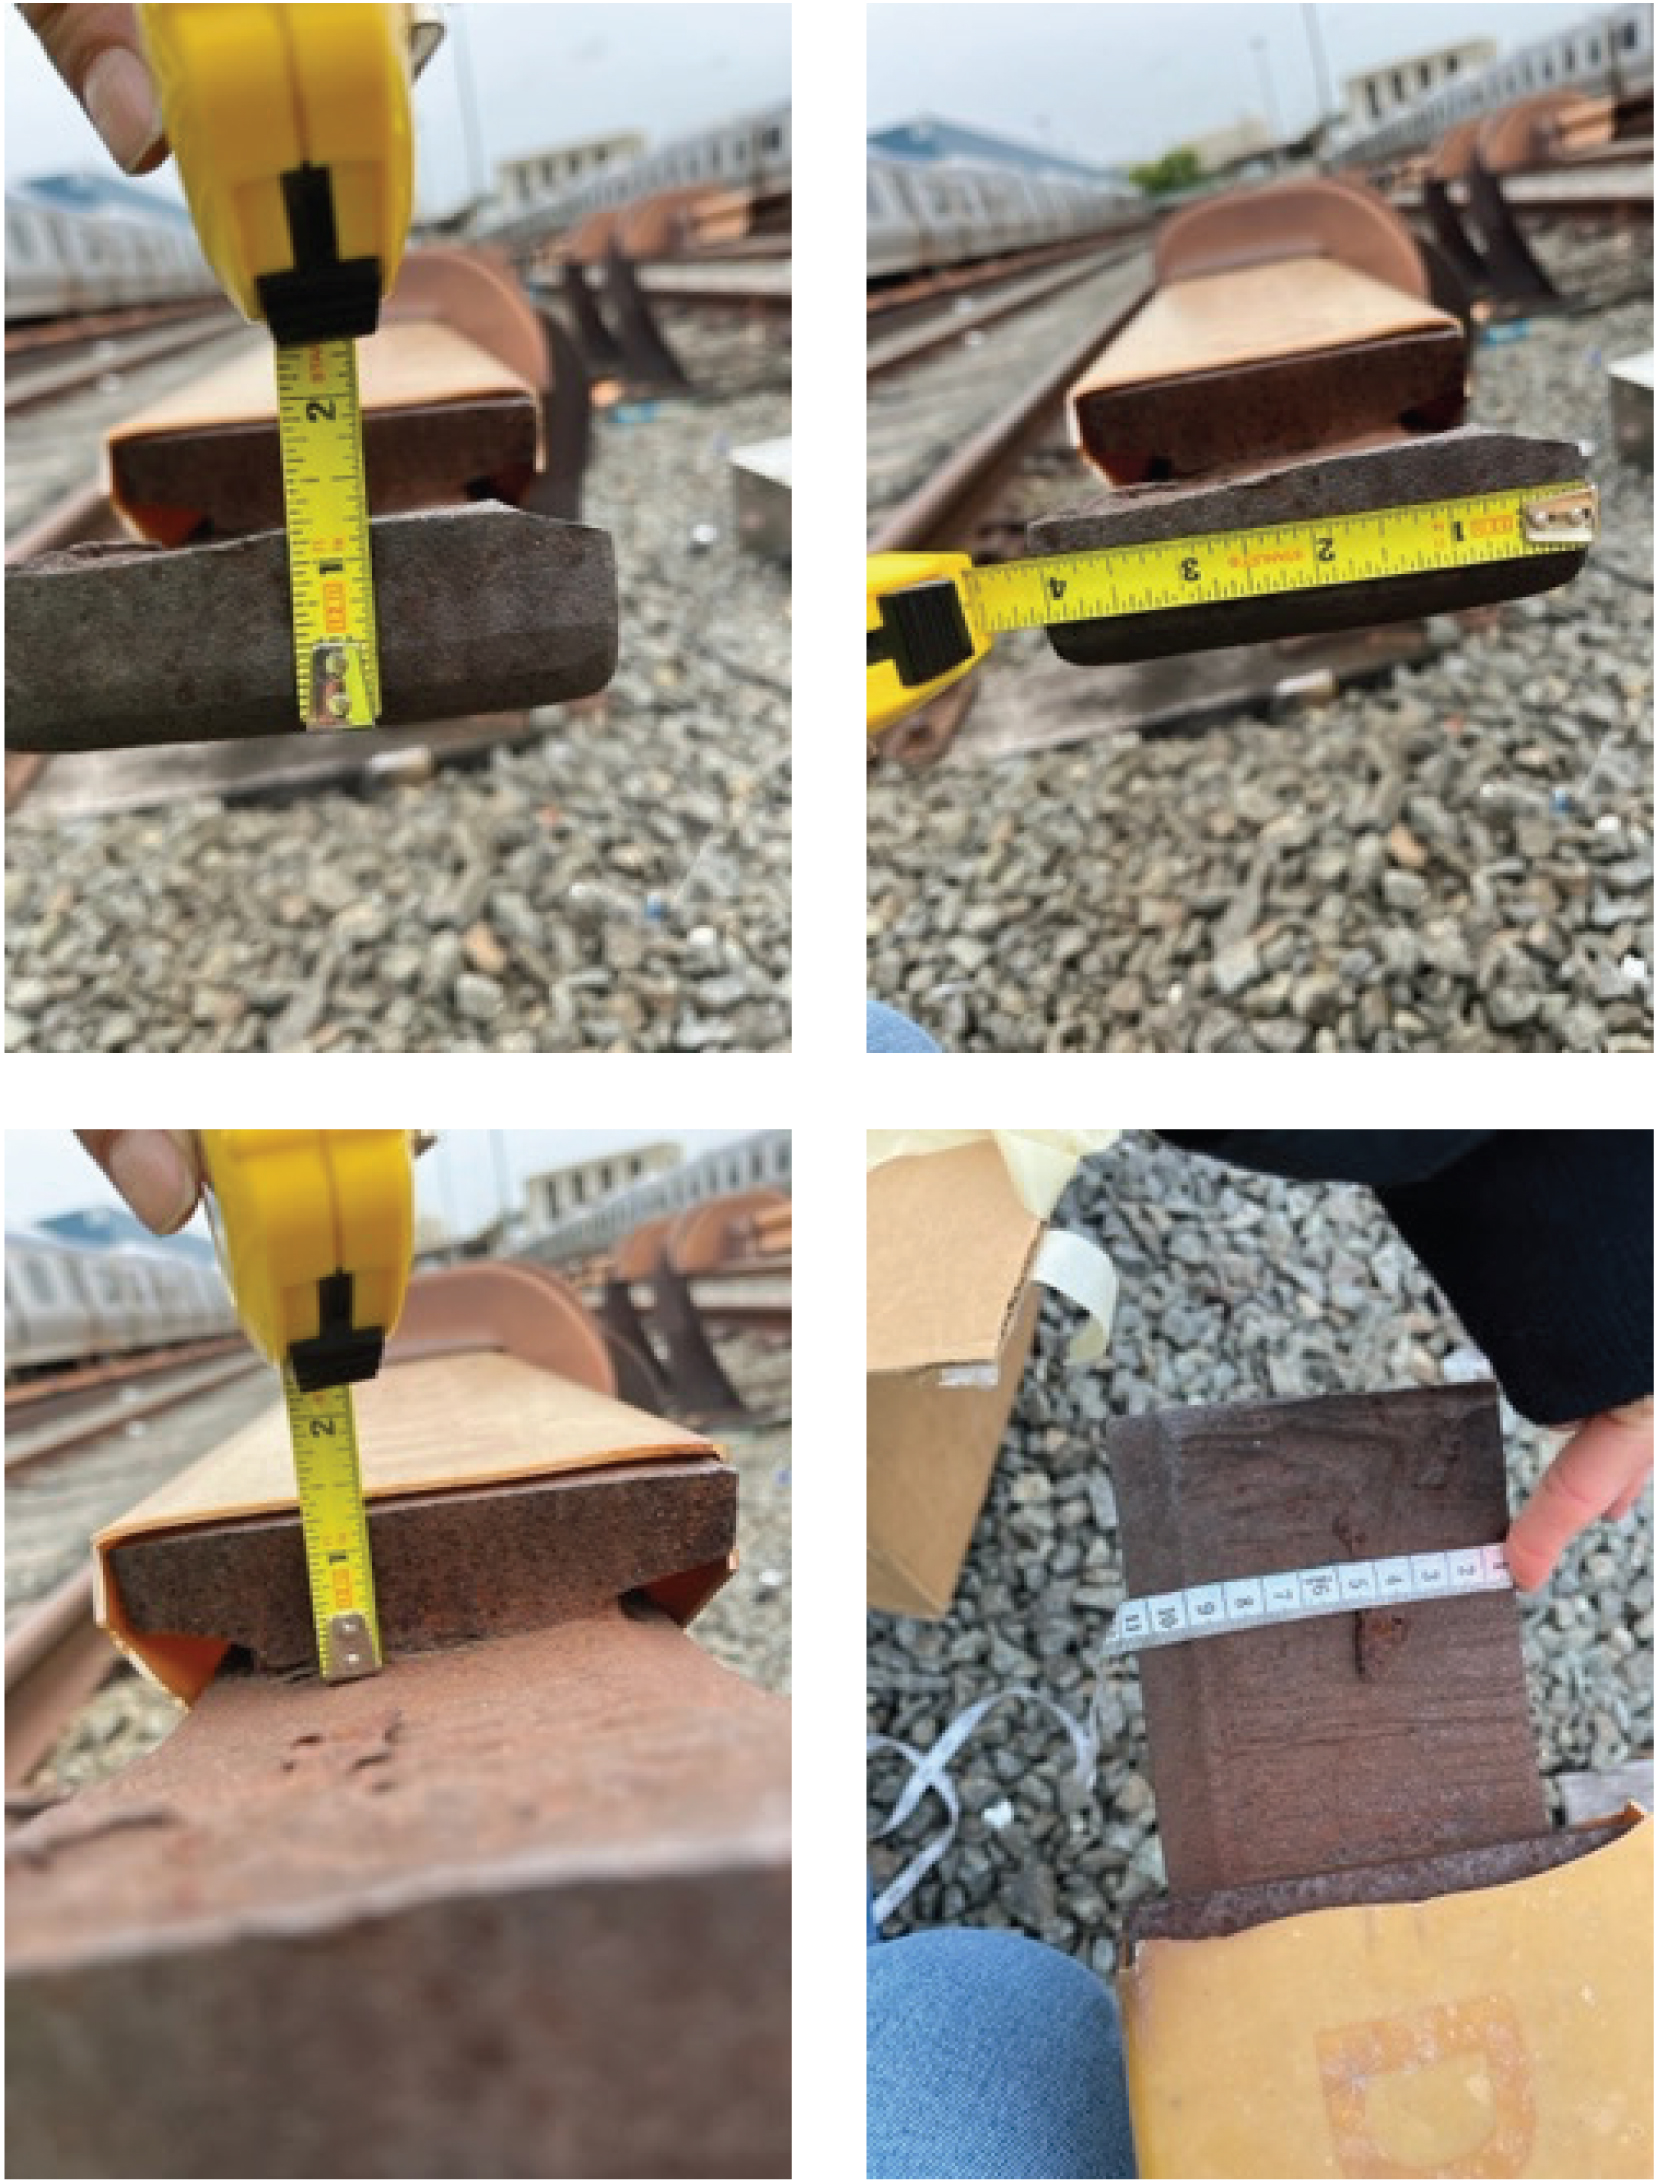
During one of the visits, the dimensions of the third-rail line were measured to enable the researchers to model the power lines accurately. The pictures presented in Figure C.4 show the dimensions of the third rail.
Figure C.5 shows the voltage and current waveforms recorded when a fault was induced at a distance of 25 ft from the sensing equipment. The peak amplitude of the injected voltage is consistent, while the sensed current amplitude is at its highest among all test locations, reflecting minimal impedance in the fault path. These results confirm the systemʼs ability to reliably detect faults at shorter distances with high accuracy.
Long Description.
A single track with no train cars, in the middle of the yard, is outlined with a red rectangular box, highlighting a specific section among the many parallel tracks. The bottom of the picture, below the many parallel tracks, shows maintenance vehicles and structures.
Long Description.
The view is from a point between two parallel railway tracks, looking straight ahead, with gravel ballast underfoot and rails on wooden sleepers. Two sections of track that have been electrically isolated for testing run parallel on either side of the frame. Farther away, on both sides, several silver-colored SEPTA railcars are parked along adjacent tracks.

Long Description.
Two copper-colored third rails run parallel to the main steel running rail, supported by dark insulator brackets mounted on the ground. Wooden railroad ties and coarse gravel ballast are visible beneath the rails.
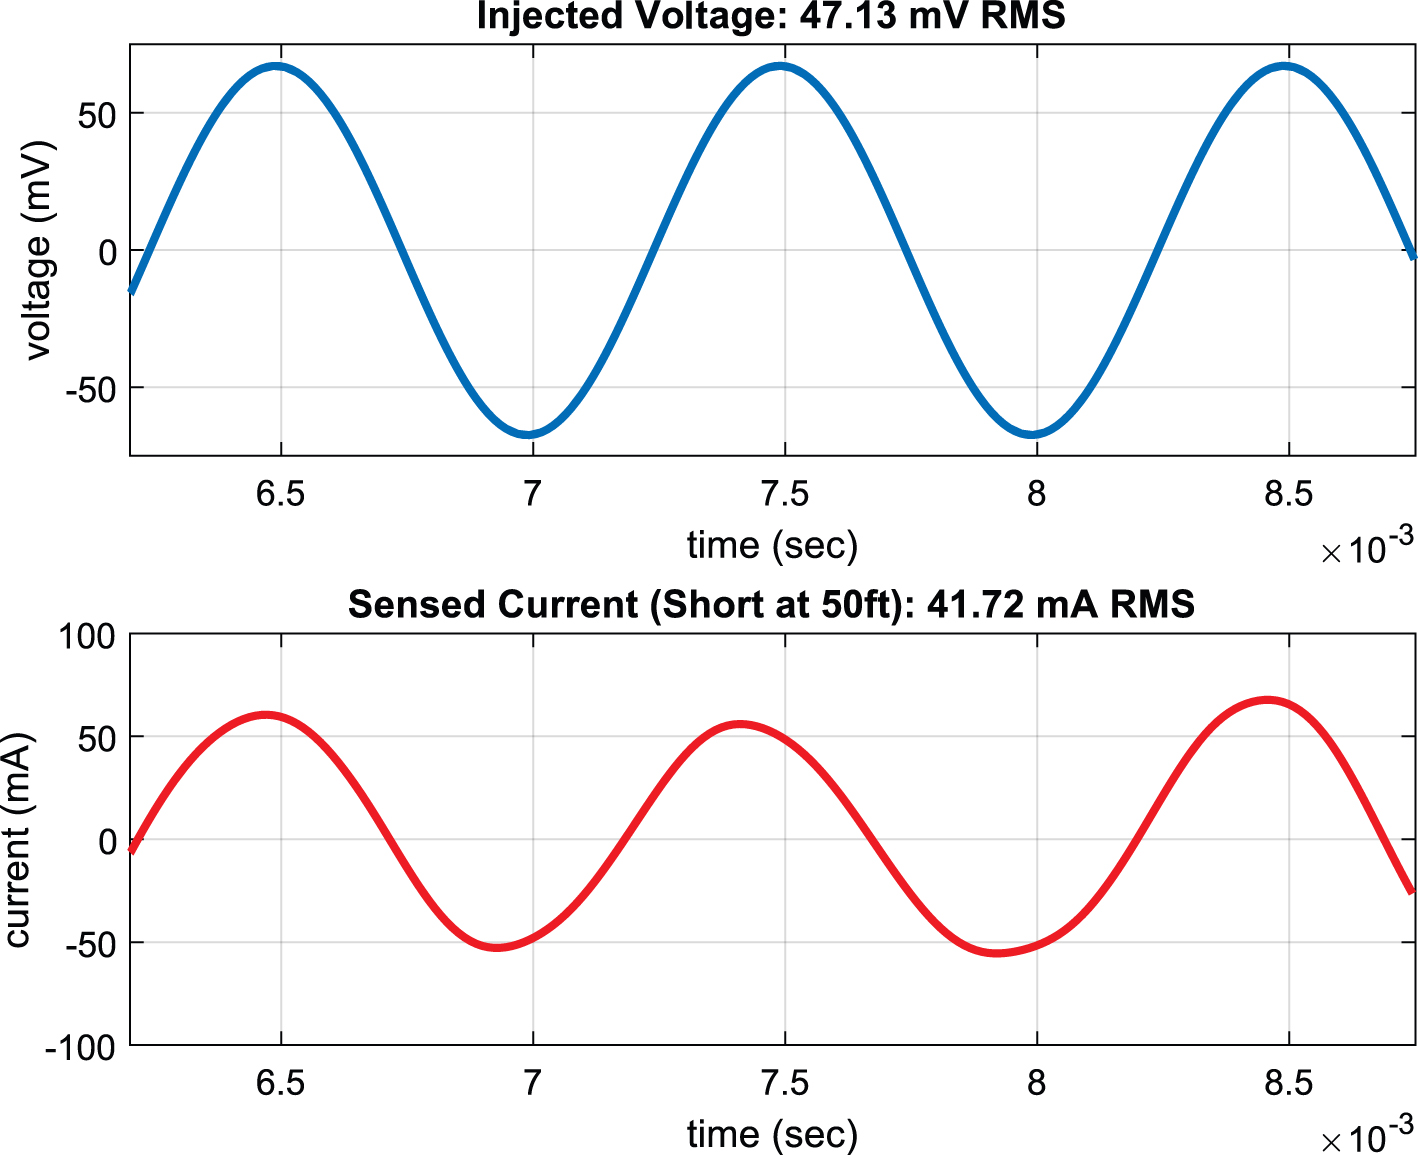
Figure C.6 illustrates the response of the system to a fault created 50 ft from the sensing equipment. The sensed current shows a slight decrease compared to the 25-ft test, aligning with the increase in impedance along the fault path. Despite this reduction, the system continues to provide a clear and stable signal, validating its performance over moderate distances.
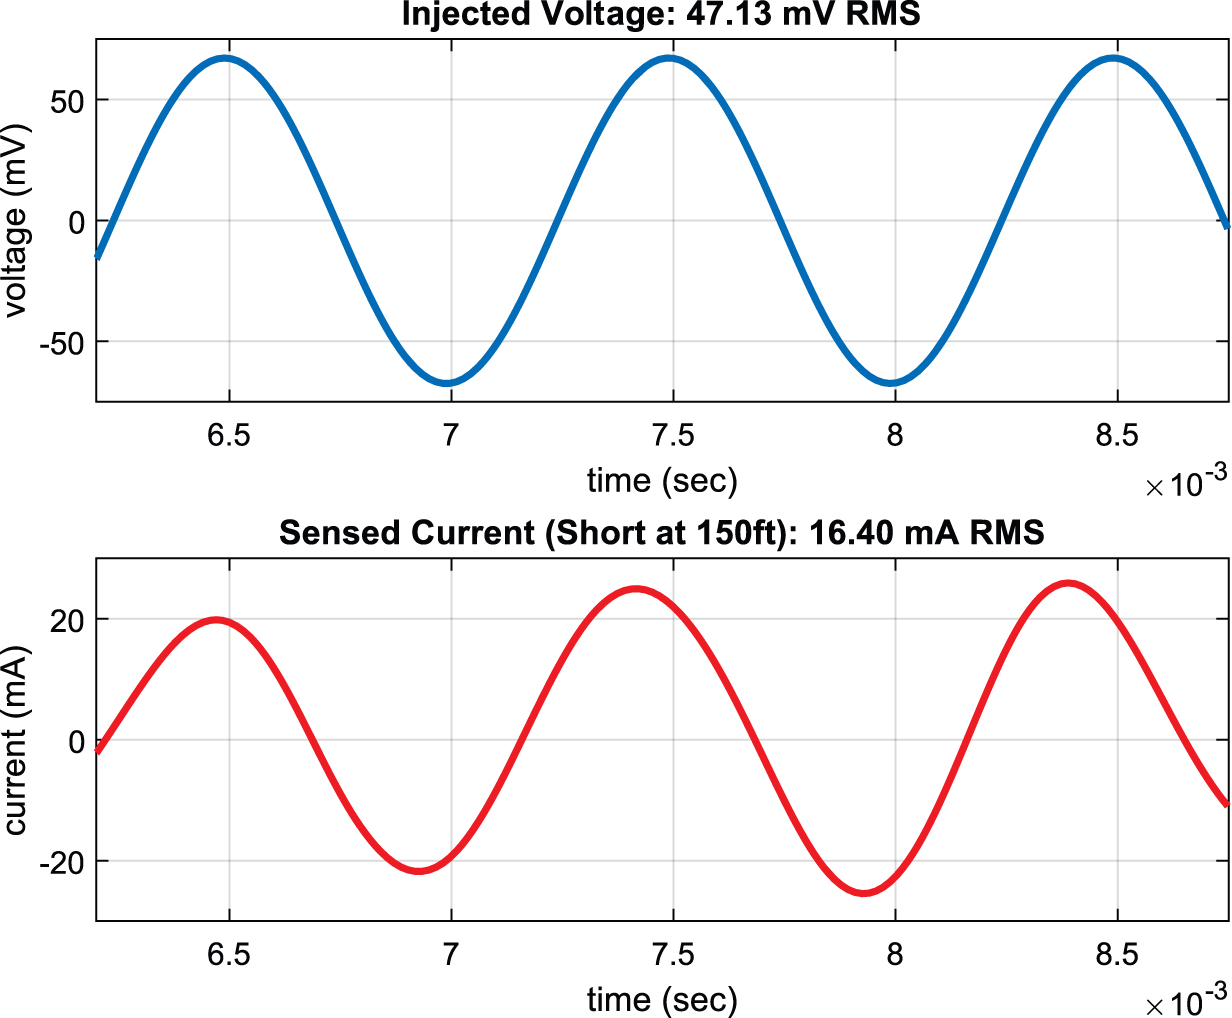
Figure C.7 represents the systemʼs response to a fault at 150 ft. A noticeable decrease in sensed current amplitude is observed due to the increased distance and impedance. Nevertheless, the waveform remains distinguishable, demonstrating the systemʼs capability to detect and analyze faults even at longer distances, albeit with reduced sensitivity.
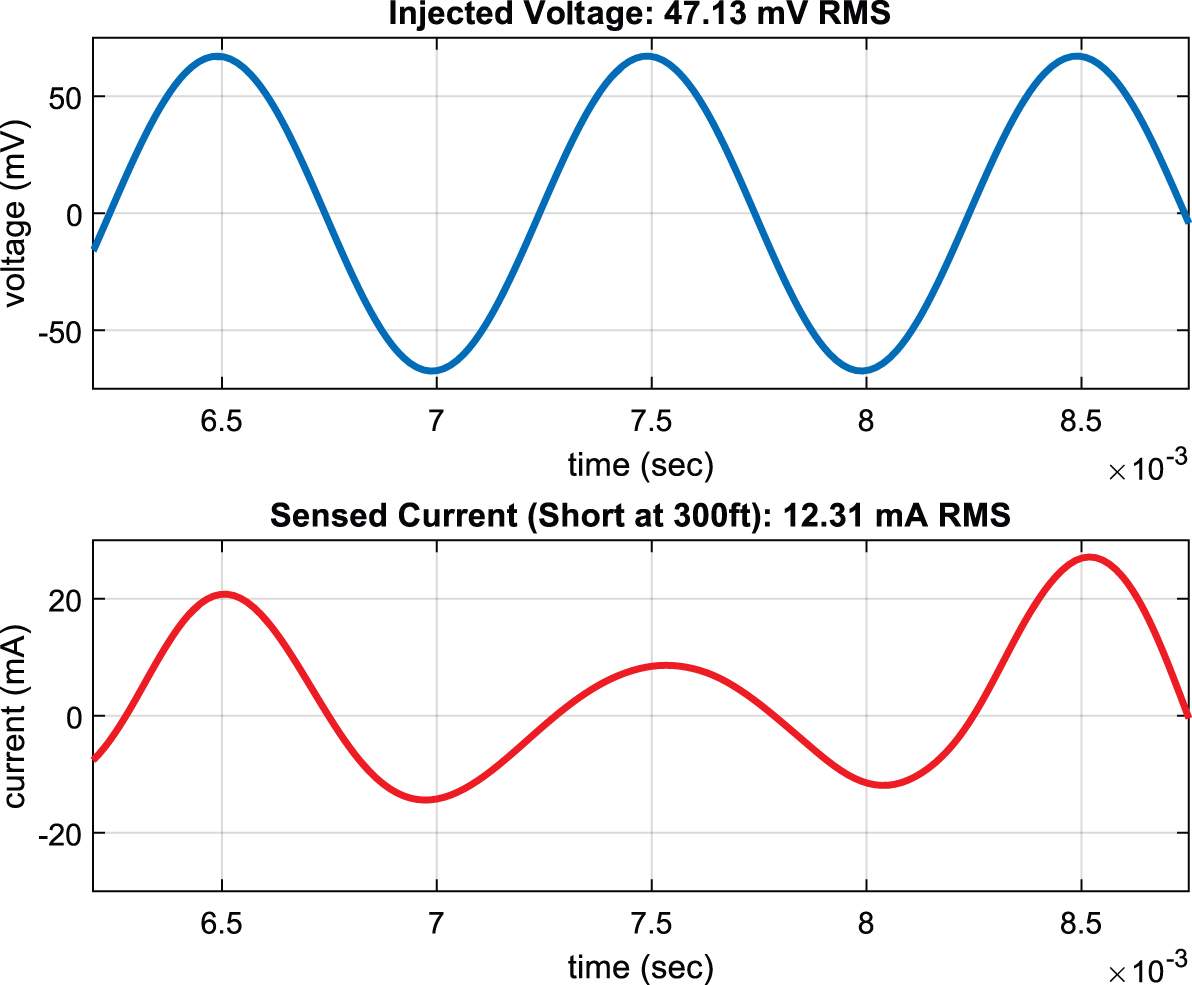
Figure C.8 shows the waveforms for a fault at 300 ft from the sensing equipment. The sensed current amplitude is significantly reduced, approaching the systemʼs noise threshold. While detection is still achievable, the reduced signal strength highlights the challenges associated with fault detection at extended distances. This emphasizes the need for potential enhancements in amplification or algorithm optimization for long-range fault detection.
The impedance increases with distance, reflecting the expected resistance and reactance in the third-rail system. These findings demonstrate the systemʼs capability to differentiate fault locations based on impedance characteristics.
Long Description.
Photo 1: A tape measure is vertically placed against the end of a section of third rail to measure its height, showing a height measurement of approximately 1.25 inches. Photo 2: A tape measure is held horizontally across the width of the third rail, reading approximately 4 inches. Photo 3: Another vertical height measurement is taken from a different section of the third rail, again showing about 1.25 inches. Photo 4: A ruler is used to measure the width of a rail section placed on the ground, showing approximately 9 centimeters (or 3.5 inches).

Long Description.
The first graph is titled Injected Voltage: 47.13 millivolts (mV) root mean square (RMS). The horizontal axis shows time in seconds from roughly 6.5 to 8.5 in increments of 0.5. The vertical axis shows voltage in mV from roughly negative 50 to 50 in increments of 50. The line in the graph is in waveform with three peaks and two lows. The curve begins at (6.3 seconds, negative 15 mV), reaches its highest peak at (6.5 seconds, 57 mV), and ends at (8.8 seconds, negative 2 mV). The three peaks are all three at roughly 57 mV. The second graph is titled Sensed Current (Short at 25 feet): 79.88 milliamperes (mA) RMS. The horizontal axis shows time in seconds from roughly 6.5 to 8.5 in increments of 0.5. The vertical axis shows current in mA from roughly negative 100 to 100 in increments of 100. The line in the graph is in waveform with three peaks and two lows. The curve begins at (6.3 seconds, negative 10 mA), reaches its highest peak at (7.4 seconds, 120 mA), and ends at (8.8 seconds, negative 20 mA). The first two peaks are both at roughly 120 mA, but the last peak is at 100 mA. Note that the coordinate values are approximate.
Long Description.
The first graph is titled Injected Voltage: 47.13 millivolts (mV) root mean square (RMS). The horizontal axis shows time in seconds from roughly 6.5 to 8.5 in increments of 0.5. The vertical axis shows voltage in mV from roughly negative 50 to 50 in increments of 50. The line in the graph is in waveform with three peaks and two lows. The curve begins at (6.3 seconds, negative 15 mV), reaches its highest peak at (6.5 seconds, 57 mV), and ends at (8.8 seconds, negative 2 mV). The three peaks are all three at roughly 57 mV. The second graph is titled Sensed Current (Short at 50 feet): 41.72 milliamperes (mA) RMS. The horizontal axis shows time in seconds from roughly 6.5 to 8.5 in increments of 0.5. The vertical axis shows current in mA from roughly negative 100 to 100 in increments of 50. The line in the graph is in waveform with three peaks and two lows. The curve begins at (6.3 seconds, negative 2 mA), reaches its highest peak at (8.4 seconds, 65 mA), and ends at (8.8 seconds, negative 30 mA). The three peaks are all different, at roughly at 58 mA, 52 mA, and 65 mA, consecutively. Note that the coordinate values are approximate.
Long Description.
The first graph is titled Injected Voltage: 47.13 millivolts (mV) root mean square (RMS). The horizontal axis shows time in seconds from roughly 6.5 to 8.5 in increments of 0.5. The vertical axis shows voltage in mV from roughly negative 50 to 50 in increments of 50. The line in the graph is in waveform with three peaks and two lows. The curve begins at (6.3 seconds, negative 15 mV), reaches its highest peak at (6.5 seconds, 57 mV), and ends at (8.8 seconds, negative 2 mV). The three peaks are all three at roughly 57 mV. The second graph is titled Sensed Current (Short at 150 feet): 16.40 milliamperes (mA) RMS. The horizontal axis shows time in seconds from roughly 6.5 to 8.5 in increments of 0.5. The vertical axis shows current in mA from roughly negative 20 to 20 in increments of 20. The line in the graph is in waveform with three peaks and two lows. The curve begins at (6.3 seconds, negative 1 mA), reaches its highest peak at (8.3 seconds, 25 mA), and ends at (8.8 seconds, negative 12 mA). The first of the three peaks is at roughly 20 mA, while the second two are at 24 mA and 25 mA, consecutively. Note that the coordinate values are approximate.
Long Description.
The first graph is titled Injected Voltage: 47.13 millivolts (mV) root mean square (RMS). The horizontal axis shows time in seconds from roughly 6.5 to 8.5 in increments of 0.5. The vertical axis shows voltage in mV from roughly negative 50 to 50 in increments of 50. The line in the graph is in waveform with three peaks and two lows. The curve begins at (6.3 seconds, negative 15 mV), reaches its highest peak at (6.5 seconds, 57 mV), and ends at (8.8 seconds, negative 2 mV). The three peaks are all three at roughly 57 mV. The second graph is titled Sensed Current (Short at 300 feet): 12.31 milliamperes (mA) RMS. The horizontal axis shows time in seconds from roughly 6.5 to 8.5 in increments of 0.5. The vertical axis shows current in mA from roughly negative 20 to 20 in increments of 20. The line in the graph is in waveform with three peaks and two lows. The curve begins at (6.3 seconds, negative 7 mA), reaches its highest peak at (8.5 seconds, 28 mA), and ends at (8.8 seconds, 0 mA). The three peaks are very different, with values of 20 mA, 7 mA, and 28 mA, consecutively. Note that the coordinate values are approximate.
This page intentionally left blank.
Abbreviations and acronyms used without definitions in TRB publications: |
|
A4A |
Airlines for America |
AAAE |
American Association of Airport Executives |
AASHO |
American Association of State Highway Officials |
AASHTO |
American Association of State Highway and Transportation Officials |
ACI–NA |
Airports Council International–North America |
ACRP |
Airport Cooperative Research Program |
ADA |
Americans with Disabilities Act |
APTA |
American Public Transportation Association |
ASCE |
American Society of Civil Engineers |
ASME |
American Society of Mechanical Engineers |
ASTM |
American Society for Testing and Materials |
ATA |
American Trucking Associations |
CTAA |
Community Transportation Association of America |
CTBSSP |
Commercial Truck and Bus Safety Synthesis Program |
DHS |
Department of Homeland Security |
DOE |
Department of Energy |
EPA |
Environmental Protection Agency |
FAA |
Federal Aviation Administration |
FAST |
Fixing Americaʼs Surface Transportation Act (2015) |
FHWA |
Federal Highway Administration |
FMCSA |
Federal Motor Carrier Safety Administration |
FRA |
Federal Railroad Administration |
FTA |
Federal Transit Administration |
GHSA |
Governors Highway Safety Association |
HMCRP |
Hazardous Materials Cooperative Research Program |
IEEE |
Institute of Electrical and Electronics Engineers |
ISTEA |
Intermodal Surface Transportation Efficiency Act of 1991 |
ITE |
Institute of Transportation Engineers |
MAP-21 |
Moving Ahead for Progress in the 21st Century Act (2012) |
NASA |
National Aeronautics and Space Administration |
NASAO |
National Association of State Aviation Officials |
NCFRP |
National Cooperative Freight Research Program |
NCHRP |
National Cooperative Highway Research Program |
NHTSA |
National Highway Traffic Safety Administration |
NTSB |
National Transportation Safety Board |
PHMSA |
Pipeline and Hazardous Materials Safety Administration |
RITA |
Research and Innovative Technology Administration |
SAE |
Society of Automotive Engineers |
SAFETEA-LU |
Safe, Accountable, Flexible, Efficient Transportation Equity Act: A Legacy for Users (2005) |
TCRP |
Transit Cooperative Research Program |
TEA-21 |
Transportation Equity Act for the 21st Century (1998) |
TRB |
Transportation Research Board |
TSA |
Transportation Security Administration |
U.S. DOT |
United States Department of Transportation |

Transportation Research Board
500 Fifth Street, NW
Washington, DC 20001