Medicare: A Strategy for Quality Assurance, Volume I (1990)
Chapter: 3. The Elderly Population
3
The Elderly Population
This chapter reviews key descriptors of the elderly population. It documents their continued growth and aging, thus highlighting the demands for health care by this population. It also underscores the complexities of providing that care, given the special challenges faced by the elderly such as multiple chronic illnesses and inadequate means for maintaining many older persons in independent-living situations.
SIZE AND GROWTH OF THE ELDERLY POPULATION
Traditionally, the “elderly” are considered to be those persons age 65 and older. By that definition, in 1987 there were just over 30 million elderly people in the United States, more than 12 percent of the total U.S. population of nearly 252 million (Table 3.1). This group makes up the vast majority, almost 96 percent, of Medicare recipients.1
The rate of growth of the elderly segment of the U.S. population has been much more rapid than the rate of growth in the overall population, a phenomenon often referred to as “the graying of America.” Data from the National Center for Health Statistics (NCHS) indicate that, from 1960 to 1986, the population age 65 and older increased by 75 percent, from almost 17 million people to over 29 million people, while the population under 65 increased only 30 percent (NCHS, 1989). Among those over age 65 in 1986, about three-fifths were between age 65 and 74; about one-third were 75 to 84, and one-tenth were 85 and older. The rate of growth of the subgroups of the elderly population between 1960 and 1986 was substantially higher for the older age groups (i.e., 75 to 84 and 85 and older) than for the 65 to 74 age group.
Between 1987 and 2030, the total U.S. population is projected to in-
TABLE 3.1 Number and Percentage Distributions of the Population, by Age: United States, Selected Calendar Years 1987–2030
Age | 1987 | 2000 | 2010 | 2020 | 2030 |
| Population in millionsa | ||||
Under 20 years | 73.4 | 75.9 | 73.8 | 74.2 | 74.4 |
20–64 years | 148.1 | 165.8 | 179.6 | 180.6 | 175.9 |
65 years or over | 30.2 | 35.6 | 40.0 | 52.8 | 66.5 |
65–69 years | 9.8 | 9.6 | 12.2 | 17.6 | 19.0 |
70–74 years | 7.8 | 8.9 | 9.1 | 13.8 | 17.3 |
75–79 years | 5.8 | 7.4 | 7.1 | 9.2 | 13.3 |
80–84 years | 3.7 | 5.1 | 5.6 | 5.8 | 9.0 |
85 years or over | 3.0 | 4.6 | 6.0 | 6.5 | 7.9 |
Total | 251.8 | 277.3 | 93.4 | 307.7 | 316.8 |
| Percent distribution of total population | ||||
Under 20 years | 29.2 | 27.4 | 25.2 | 24.1 | 23.5 |
20–64 years | 58.8 | 59.8 | 61.2 | 58.7 | 55.5 |
65 years or over | 12.0 | 12.8 | 13.6 | 17.2 | 21.0 |
65–69 years | 3.9 | 3.5 | 4.2 | 5.7 | 6.0 |
70–74 years | 3.1 | 3.5 | 4.2 | 5.7 | 6.0 |
75–79 years | 2.3 | 2.7 | 2.4 | 3.0 | 4.2 |
80–84 years | 1.5 | 1.8 | 1.9 | 1.9 | 2.8 |
85 years or over | 1.2 | 1.7 | 2.0 | 2.1 | 2.5 |
Total | 100.0 | 100.0 | 100.0 | 100.0 | 100.0 |
| Percent distribution of aged population | ||||
65–69 years | 32.5 | 27.0 | 30.5 | 33.3 | 28.6 |
70–74 years | 25.8 | 25.0 | 22.7 | 26.1 | 26.0 |
75–79 years | 19.2 | 20.8 | 17.8 | 17.4 | 20.0 |
80–84 years | 12.3 | 14.3 | 14.0 | 11.0 | 13.5 |
85 years or over | 9.9 | 12.9 | 15.0 | 12.3 | 11.9 |
Total | 100.0 | 100.0 | 100.0 | 100.0 | 100.0 |
aSocial Security area populations as of July 1. NOTES: Social Security Administration data were used for this table. Population growth is taken from the intermediate (II-B) assumptions used to prepare the 1989 Annual Report of the Board of Trustees of the Federal Old-Age and Survivors Insurance and Disability Insurance Trust Fund. Columns may not sum to totals and percentages may not sum to 100.0 due to rounding. SOURCE: Waldo et al., 1989. | |||||
crease by 26 percent from 252 million to 317 million, while the population age 65 and older is expected to increase by more than 100 percent from the present 12 percent of the total population to nearly 21 percent of the total population (67 million) (Waldo et al., 1989).
SOCIODEMOGRAPHIC CHARACTERISTICS
Sex Ratios in the Elderly Population
The ratio of males to females varies dramatically with age. For example, in 1986, for every 100 males under age 20, there were 96 females—a ratio of nearly 1:1. In the same year, the male to female ratio for persons over age 65 was almost 1:1.5, and the ratio just for those 85 and older was 1:2.5, highlighting the numerical predominance of women over men in these older age ranges (Special Committee on Aging, 1987–1988).
Race and Ethnicity of the Elderly Population
Table 3.2 summarizes information on the population by age and ethnic group (white, black, and hispanic). In 1986, about 89 percent of the elderly and about 80 percent of the nonelderly were white. The white population has a higher proportion of elderly than do other ethnic groups (13 percent versus 8 and 5 percent for black and hispanic populations, respectively) and a higher proportion of the older old (i.e., those 75 years and older). The proportion of the elderly population who are minority is expected to grow considerably over the next decade (Special Committee on Aging, 1987–1988).
Elderly Support Ratios
The elderly support ratio is defined as the ratio of persons age 65 and older to persons of working age, between 18 and 64 years old. Owing to higher life expectancy and smaller families, the ratio of elderly to working-age persons is increasing dramatically. In 1900, there were about 7 elderly persons for every 100 working-age persons; in 1986 the ratio was about 20 per 100. This ratio is projected to increase to 37 elderly per 100 working-age persons by the year 2030 (Special Committee on Aging, 1987–1988). The elderly support ratio is important in economic terms because the working population can be thought of as supporting the nonworking age groups, although the rise in retirement age might mitigate the economic effects somewhat.
TABLE 3.2 Population by Age and Race: 1986
| White | Black | Hispanic | |||
Age | Numbera | Percentb | Numbera | Percentb | Numbera | Percentb |
0–54 | 158,733 | 79 (78) | 24,926 | 12 (85) | 16,532 | 8 (89) |
55–64 | 19,641 | 86 (10) | 2,106 | 9 (7) | 1,060 | 6 (6) |
Total nonelderly | 178,374 | 80 (87) | 27,032 | 9 (92) | 17,592 | 5 (95) |
65–74 | 15,529 | 88 (8) | 1,491 | 8 (5) | 572 | 3 (3) |
75–84 | 8,220 | 89 (4) | 691 | 7 (2) | 333c | |
85+ | 2,549 | 92 (1) | 213 | 8 (1) |
|
|
Total elderly | 26,298 | 89 (13) | 2,395 | 8 (8) | 905 | 3 (5) |
Total | 204,672 | 81 (100) | 29,427 | 12 (100) | 18,497 | 7 (100) |
aNumbers are in thousands. bPercentages are of the total in each age group. Percentages shown in parentheses are of the total in each racial and ethnic group. Percentages may not sum to 100 due to rounding. cData are for persons age 75+. SOURCE: Special Committee on Aging, 1987–1988. (Data do not match precisely those in Table 3.1 because this table was based in part on unpublished estimates from the U.S. Bureau of the Census.) | ||||||
Geographic Distribution of the Elderly Population
Almost half of the elderly in the United States live in eight states: Florida, Pennsylvania, New York, Ohio, Illinois, Michigan, California, and Texas. In the first four of these states, the percentage of the state’s population that is elderly exceeds the national average of 12.1 percent (Table 3.3), with Florida having the highest concentration of persons over age 65. Other than Florida, many states with a large share of elderly are in areas where the high concentration arises more from out-migration of the young than from shifts in the residence of the elderly population.
Several areas of the country, most notably the Sunbelt, are experiencing an aging of their population because of the in-migration of older persons at retirement. According to data from the Census Bureau, of the 1.7 million Americans age 60 and older who moved out of state between 1975 and 1980, nearly 50 percent moved to Florida, California, Arizona, Texas, or New Jersey. Arizona, Texas, and Florida experienced increases of 215, 191
and 110 percent, respectively, in that same age group between 1960 and 1980 (Special Committee on Aging, 1987–1988).
Recent evidence of a trend called “counter-migration” indicates that a small number of older people who have moved to another state at retirement move back home where family members live. Findings from the Retirement Migration Project show that Florida lost a significant number of elderly migrants to states outside the Sunbelt, namely Michigan, New York, Ohio, and Pennsylvania, which are among the states that have a significant number of migrants to Florida (Special Committee on Aging, 1987–1988).
Living Arrangements for the Elderly
Community Residents
The Commonwealth Fund has recently supported a major Commission to examine issues relating to the elderly population. Special attention has been given to the 8.5 million elderly who live alone (Commonwealth Fund, 1987, 1988). The material cited below (unless otherwise noted) is taken from Commission publications available to date.
The vast majority of elderly (95 percent) live in the community. Of this group, 54 percent live with a spouse, almost 30 percent live alone, and the remaining 16 percent share a home with children, other relatives, or friends. Consistent with widowhood, the percentage of elderly living alone increases with age. For example, of persons age 65 to 74, approximately 24 percent
TABLE 3.3 Percentages of the Elderly Population in Selected States: 1986
State | Persons Age 65+ (thousands) | Persons Age 65+ as Percentage of State Population |
Florida | 2,071 | 17.7 |
Pennsylvania | 1,736 | 14.6 |
New York | 2,283 | 12.8 |
Ohio | 1,320 | 12.3 |
Illinois | 1,386 | 12.0 |
Michigan | 1,039 | 11.4 |
California | 2,848 | 10.6 |
Texas | 1,583 | 9.5 |
SOURCE: Special Committee on Aging, 1987–1988. | ||
live alone; the figures for those 75 to 84 and for those age 85 and older are 39 and 45 percent, respectively.
Women account for four-fifths of all elderly living alone. The proportion living alone is at least twice as high for women as for men in every age category. Since women have a longer life expectancy than men, widowhood is the reason that three of four women age 65 to 74, and four of five women age 75 and older, live alone. Hispanics are the least likely of the major ethnic groups (white, black, and hispanic) to live alone; 23 percent of elderly hispanics live alone compared to 30 percent of elderly whites and 33 percent of elderly black people.
Elderly persons who live alone are more likely to be poor or near-poor than those who live with others. Among the 8.5 million elderly living alone, 19 percent are poor and 24 percent are near-poor; among all elderly families, 12 percent are poor, 16 percent near-poor. Furthermore, for those who live alone, poverty rates increase with age.
Nursing Home Residents
Only about 5 percent of the elderly live in nursing homes at any given time, although one study estimates that the nursing home population will grow from 1.3 million to about 2 million by the year 2000 (5.7 percent of the elderly population) and to 4.4 million by 2040 (6.6 percent) (Manton and Liu, 1984). This 5-percent figure does not reflect flows into and out of nursing homes; a significant number of people enter nursing homes for recuperative care and leave shortly thereafter (Cohen et al., 1986).
Nearly half of nursing home residents are 85 years of age and older, three-quarters are female, and more than nine-tenths are white (Table 3.4). The proportion of each age group requiring nursing home care increases with age, from about 1 percent of those age 65 to 74 to 22 percent of those age 85 and older (NCHS, 1987a).
The risk of institutionalization after age 65 is widely debated, with recent estimates ranging from 36 percent to 65 percent (Special Committee on Aging, 1987–1988). Cohen et al. (1986), using data from more than 4,400 Medicare beneficiaries, have estimated the upper bound for the lifetime risk of entering a nursing home at age 65 to be approximately 43 percent. The risk of institutionalization increases with age until around age 80 and begins to decline at age 85. At every age, the lifetime risks for females is twice that of males (Cohen et al., 1986).
Health Insurance for the Elderly
Most Americans are automatically entitled, on reaching age 65, to health insurance benefits under the Medicare program. Today almost 96 percent
TABLE 3.4 Number and Percentage of Nursing Home Residents and Rate per 1,000 Population Age 65 and Older, By Age, Sex, and Race: 1985
Age, Sex and Race | Number of Nursing Home Residents | Percent Distribution | Number of Nursing Home Residents per 1,000 Population Age 65+ and Over |
Age | |||
65–74 years | 212,100 | 16.1 | 12.5 |
75–84 years | 509,000 | 38.7 | 57.7 |
85 years and over | 594,700 | 45.2 | 219.4 |
Sex | |||
Male | 334,000 | 25.4 | 29.0 |
Female | 981,900 | 74.6 | 57.7 |
Race | |||
White | 1,224,900 | 93.1 | 47.6 |
Black | 82,000 | 6.2 | 35.0 |
Other | 8,900 | 0.7 | 20.1 |
All nursing | |||
home residents | 1,315,800 | 100.0 | 46.1 |
SOURCE: NCHS, 1987a. | |||
of the nation’s elderly have Medicare coverage. Refer to Chapter 4 for a more thorough description of the Medicare program.
ECONOMICS OF AGING
Elderly Income
People age 65 and older have less income on average than those under age 65, and the disparity increases as the elderly grow older. For example, compared to persons age 65 to 69, the average income is 33 percent lower for persons age 75 to 84 and 36 percent lower for those age 85 and older (Special Committee on Aging, 1987–1988). In 1986, the median income of a family with an elderly head of the household was $19,932, whereas the median income for families with a nonelderly head of the household (age 25 to 64) was approximately $32,368 (Special Committee on Aging, 1987–1988). However, the true disparity between these figures may not be that great when differences in expenditure needs between elderly and nonelderly households are taken into account.

FIGURE 3.1 Composition of Income for Families with Head of Household Age 65+, 1970–1986
Composition of Income
The elderly rely more on Social Security than on any other source for their income, and Social Security is becoming an increasingly important component of income of the elderly while other sources are declining in importance (Figure 3.1). In 1986, 38 percent of income of the elderly came from Social Security; for 31 percent of the aged, Social Security represents at least 80 percent of their income.
Assets account for about 26 percent of the income of the elderly. Other sources of income of the elderly include wages (17 percent of total income), pensions (16 percent), and other sources (2 percent).
Trends in Elderly Income
Elderly incomes differ by sex, by marital status, and by race (Table 3.5). In 1986, the median income of elderly women was nearly 45 percent lower than the median income of elderly men. Although the greatest difference exists between married men and married women (where the household income can be considered to be a combination of the two), widowed males still report a median income nearly 25 percent greater than widowed females. White elderly have higher median incomes than their black and hispanic counterparts. In 1986, incomes for black elderly men and for
TABLE 3.5 Median Income of Persons Age 65 and Older by Demographic Characteristics and Sex: 1986
Demographic Characteristic | Both Sexes | Male | Female |
Marital Status | |||
Married | $9,041 | $12,265 | $5,253 |
Single | $8,381 | $8,867 | $8,122 |
Widowed | $7,313 | $9,258 | $6,993 |
Divorced | $7,406 | $7,826 | $7,000 |
Race | |||
White | $8,544 | $12,131 | $6,738 |
Black | $5,030 | $6,757 | $4,508 |
Hispanic | $5,510 | $7,369 | $4,583 |
All 65+ | $8,154 | $11,544 | $6,425 |
SOURCE: Special Committee on Aging, 1987–1988. | |||
hispanic elderly men were 56 and 61 percent, respectively, of incomes for white males; the figures for elderly black and hispanic women show a similar pattern.
Although incomes of the elderly are lower than those of the nonelderly, they have been rising steadily. Between 1980 and 1984 income growth of the elderly population was higher than that of other subgroups of the population (Moon, 1988). After adjusting for family size and tax liability, the disposable income of the elderly is comparable to that of the adult population (age 18 to 64).
As a result of this growth in income, poverty rates among the elderly have been declining (Figure 3.2). In recent years, the average level of economic well-being of the elderly has improved substantially, and in general, the elderly appear to be as least as well off as the nonelderly (Hurd, 1989). However, the elderly population is not a homogenous group, and one needs to look beyond overall averages to understand the diversity in economic status of this population (CRS, 1988; Moon, 1988).
Gains have not been shared equally by all elderly. For instance, because of rising wages and increases in Social Security, individuals turning 65 (those just joining the ranks of the elderly) tend to have higher incomes, on average, than those already in the elderly category. Conversely, those who die each year tend to have lower incomes. Therefore, the average income level of the elderly increases as a function of demographic change.
Many elderly people are just above the poverty line. In 1986, the poverty line for a single elderly person was $5,255 and the near-poverty line, or
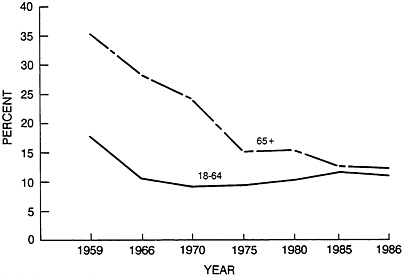
FIGURE 3.2 Percentages of the Adult Non-Elderly and Elderly Populations Below the Poverty Level, Selected Years
125 percent of the poverty threshold, was $6,569; for a couple, the values were $6,630 and $8,288. The data in Table 3.6 can be interpreted as showing that, in 1986, about one in eight elderly persons was at or below the poverty threshold, one in five was below 125 percent of that threshold, and just over one in three was below 150 percent. Although these are still large percentages, they are not as dramatic as the figures two decades earlier, when, for instance, one in four elderly persons was in poverty.
The poverty rate among the elderly would be higher than it is currently if the poverty standards for elderly and nonelderly persons were the same. In
TABLE 3.6 Percentages of the Elderly Below Selected Income Thresholds: Selected Years
| Percent of the Elderly Below | ||
Year | Poverty Threshold | 125% of Poverty | 150% of Poverty |
1969 | 25.1 | 35.2 | 43.3 |
1975 | 15.3 | 25.4 | 34.9 |
1980 | 15.7 | 25.7 | 34.4 |
1983 | 14.1 | 22.5 | 30.2 |
1986 | 12.4 | 20.5 | 28.0 |
SOURCE: Special Committee on Aging, 1987–1988. | |||
TABLE 3.7 Percentages of the Elderly Population with Annual Incomes Below the Poverty Level by Sex and Age Group: 1986
| Age | |||
Sex | 65–74 | 75–84 | 85+ | Total 65+ |
Both Sexes | 10.3 | 15.3 | 17.6 | 12.4 |
Male | 7.0 | 10.7 | 13.3 | 8.5 |
Female | 13.0 | 18.1 | 19.7 | 15.2 |
SOURCE: Special Committee on Aging, 1987–1988. | ||||
that case, the proportion of poor elderly would increase from about 13 percent to about 15.2 percent of the total elderly group. At that point, the poverty rate would be higher for the elderly than for the overall population (Villers Foundation, 1987).
Poverty rates are higher for elderly women than elderly men, especially among the younger elderly (Table 3.7). In addition, poverty rates are higher among minority elderly than white elderly.
USE OF THE HEALTH CARE SYSTEM
Hospital Services
Throughout the 1970s, the hospital discharge rate increased almost 12 percent for all age groups and nearly 23 percent among those persons age 65 and older. Conversely, during the same time period, average length of stay declined, with the greatest declines among the elderly. The change in utilization patterns during the 1970s has been attributed partially to implementation of the Medicare program and partially to advances in medical technology (NCHS, 1987b).
After the implementation of the Medicare prospective payment system (PPS), the hospital discharge rate for the U.S. population began to decline. Data from the NCHS National Health Interview Survey suggest that the drop experienced in the mid-1980s began to subside in 1987 (NCHS, 1988c). Similarly, the decline in the average length of stay for the U.S. population since PPS has also begun to level off (Table 3.8).
Physician Services
The number of physician contacts among the elderly population has increased significantly since the beginning of the Medicare program, owing in
part to the increased access to health care resulting from the program. Additionally, from 1983 to 1987 the average number of physician visits for persons age 65 and older increased 17 percent from 7.6 to 8.9 visits per person per year, owing in part to the implementation of PPS and the resulting emphasis on outpatient rather than inpatient care (Table 3.9).
The use of physician services increases with age. For example, in 1987, persons age 45 to 64 averaged 6.4 physician contacts a year, whereas persons age 65 and older averaged 8.9 physician contacts per year (Table 3.9). Within the elderly population, although those 85 and older consume 2 times more hospital care and 23 times more nursing home care than those age 65 to 74, the consumption of physician services is relatively even among the different age groups (Waldo et al., 1989).
Almost 75 percent of physician visits by the elderly are made to a doctor’s office. The remaining visits are to hospital emergency rooms, outpatient offices, home and telephone consultations, and other places outside a hospital.
TABLE 3.8 Discharges, Days of Care, and Average Length of Stay in Nonfederal, Short-Stay Hospitals, Selected Age Groups: Selected Years
Age | 1980 | 1982 | 1984 | 1986 | 1987 |
| Discharges per 1,000 population | ||||
65+ | 384 | 399 | 400 | 367 | 351 |
65–74 | 316 | 324 | 320 | 297 | 281 |
75+ | 489 | 511 | 520 | 470 | 452 |
All Ages | 159 | 159 | 148 | 133 | 128 |
| Days of care per 100,000 population | ||||
65+ | 4,098 | 4,026 | 3,575 | 3,120 | 3,030 |
65–74 | 3,148 | 3,101 | 2,711 | 2,364 | 2,294 |
75+ | 5,577 | 5,424 | 4,856 | 4,228 | 4,098 |
All Ages | 1,137 | 1,102 | 960 | 833 | 809 |
| Average length of stay in days | ||||
65+ | 10.7 | 10.1 | 8.9 | 8.5 | 8.6 |
65–74 | 10.0 | 9.6 | 8.5 | 8.0 | 8.2 |
75+ | 11.4 | 10.6 | 9.3 | 9.0 | 9.1 |
All Ages | 7.1 | 7.0 | 6.5 | 6.3 | 6.3 |
SOURCE: NCHS, 1989. | |||||
TABLE 3.9 Physician Visits Per Person by Age Group: 1983 and 1987
| Year | |||||||
Age Group | 1983 | 1987 | ||||||
Under 15 | 4.6 | 4.5 | ||||||
15–44 | 4.4 | 4.6 | ||||||
45–64 | 5.8 | 6.4 | ||||||
65+ | 7.6 | 8.9 | ||||||
65–74 | 7.3 | 8.4 | ||||||
75+ | 8.2 | 9.7 | ||||||
All Ages | 5.1 | 5.4 | ||||||
SOURCE: NCHS, 1989. | ||||||||
The aging of the population will affect the demand for physician care. That demand is expected to increase 22 percent by the year 2000 to 305 million contacts per year, and 125 percent by the year 2030 to 562 million contacts per year, based on 1986 physician contact rates and projections of the noninstitutionalized population (Special Committee on Aging, 1987–1988).
Long Term Care Services
Long term care refers to the array of medical, social, and support services for individuals in nursing homes or in the community who, for an extended period of time, depend on others for physical assistance (GAO, 1988). More than 11 million Americans were estimated to need some form of long term care in 1985. Of this group, approximately 6.5 million were elderly (or 23 percent of the total elderly population), 2 to 3 million were developmentally disabled or mentally retarded, and 1 to 2 million were partially or totally disabled due to chronic mental illness (Scanlon, 1988).
Nursing Home Care
Of the total elderly population needing long term care in 1985, approximately 20 percent resided in nursing homes and other institutions (GAO, 1988). Almost 40 percent lived in the community with their spouses. The other 40 percent were fairly evenly divided between those living with others and those living alone in the community.
The demand for nursing home care is increasing, although the lengths of stay, at least in skilled nursing facilities, are dropping (Gornick and Hall,
1988). This pattern reflects an increase in shorter stays and a decrease in longer stays.
From 1977 to 1987, aggregate nursing home expenditures increased from $13 billion to over $40 billion, an increase of 12.1 percent annually. Almost 90 percent of nursing home expenditures were for people age 65 and older (Waldo et al., 1989). Despite the large amounts of funding for nursing homes, growth in the number of beds has evidently not kept pace with the growth of the elderly population (Scanlon, 1988). This apparent discrepancy may, however, reflect a shift in the locus of care to other long-term-care settings, rather than a shortage of nursing home beds (Gornick and Hall, 1988; NCHS, 1988a).
Home Health Care
Although expenditures for home health benefits represented only about 3.6 percent of total Medicare outlays in 1986, they have been one of the fastest growing components of the program. The number of Medicare-certified home health agencies grew from slightly over 2,200 in 1972 to almost 6,000 in 1986 (Gornick and Hall, 1988). Home health services covered under Medicare include nursing care, physical, speech, and occupational therapy, home health aide services, and some medical supplies and equipment. There is no limit to the number of covered visits for beneficiaries confined to their homes (i.e., those people meeting the strict “homebound” requirements as defined by the Medicare program) and no prior hospitalization or cost-sharing requirements are imposed.
Between 1974 and 1986, Medicare reimbursements for home health care increased from $141 million to $1.8 billion (while total visit charges increased from $137 million to $2.1 billion in the same period), with an average annual growth rate of 24 percent (Ruther and Helbing, 1988). Following PPS implementation, the growth rate of home health expenditures and persons served has declined, as has the number of visits per person (Table 3.10). For example, from 1980 to 1983, the number of persons served increased at an average annual rate of 12.2 percent; however, the average annual rate of growth of persons served after 1983 was only 5.8 percent (Ruther and Helbing, 1988).
The slower rate of growth in the use of Medicare home health services since PPS may be the result of movement toward equilibrium following the growth spurt before PPS. For example, the percent of patients using covered home health services within 60 days of hospital discharge increased 55 percent from 1981 to 1983, but increased only 27 percent between 1983 and 1985 (Gornick and Hall, 1988). Further, the decline in short-stay hospital use among Medicare beneficiaries since PPS is often cited as a reason for the related decline in home health care, although the reduced lengths of
TABLE 3.10 Trends in Use and Costs of Home Health Agency Services Under Medicare: Selected Years
Year | Number of Persons Served (thousands) | Number of | Visits (thousands) Visits per Person | Charges per Visit (dollars) | Total Visit Charges (dollars) | Total Medicare Reimbursement (thousands) |
1974 | 393 | 8,070 | 21 | $17 | $ 37,406 | $ 141,464 |
1976 | 589 | 13,335 | 23 | 22 | 292,697 | 289,851 |
1980 | 957 | 22,428 | 23 | 33 | 734,718 | 662,133 |
1983 | 1,351 | 36,844 | 27 | 43 | 1,596,989 | 1,398,092 |
1985 | 1,589 | 39,742 | 25 | 51 | 2,040,697 | 1,773,048 |
1986 | 1,600 | 38,359 | 24 | 55 | 2,102,253 | 1,795,820 |
SOURCE: Ruther and Helbing, 1988. | ||||||
hospital stay following PPS should in theory have had the practical consequence of a greater need for home health services. Other factors in this leveling may be a strict interpretation of the homebound provisions and an inability of the home care market to expand sufficiently to meet the immediate demand.
A detailed examination of 1986 home health statistics (Table 3.11) shows that service use increases with age, measured as visits per 1,000 enrollees; visits per elderly person are about the same at every age (visits per nonelderly person are considerably higher than for elderly). The proportion of females using home health services is 29 percent higher than that of males.
Community-Based Services
In 1985, 80 percent of the elderly who required assistance with activities of daily living (ADLs) lived at home. Women outnumbered men 2 to 1 in this population (GAO, 1988).
Formal community-based services help address the needs of persons with activity limitations and include a broad range of health and social services such as home health care, rehabilitation programs, homemaker and chore services, personal care services, adult day care, and meals on wheels. Some nursing home patients do not require the level of care provided in an institutional setting and could remain at home assuming that appropriate services could be provided (Rice and Estes, 1984). Community-based services, therefore, are intended to help the elderly (among others) cope with independent or community living, so as to improve the quality of individuals’ lives and forestall institutionalization.
TABLE 3.11 Home Health Agency Services Under Medicare: 1986
Age and Sex | Number of Persons Served (thousands) | Visits per 1,000 Enrollees | Visits per Person | Total Visit Charges (dollars) | Charges per Person (dollars) | Charges per Visit (dollars) |
Age | ||||||
<65 | 102 | 982 | 28.6 | $ 158,816 | $1,562 | $55 |
65–66 | 102 | 578 | 22.3 | 126,946 | 1,242 | 56 |
67–68 | 94 | 609 | 22.8 | 119,603 | 1,266 | 56 |
69–70 | 109 | 757 | 23.0 | 139,544 | 1,277 | 56 |
71–72 | 125 | 939 | 23.5 | 162,754 | 1,299 | 55 |
73–74 | 133 | 1,124 | 23.7 | 173,131 | 1,301 | 55 |
75–79 | 350 | 1,493 | 23.8 | 456,208 | 1,302 | 55 |
80–84 | 301 | 2,023 | 24.0 | 394,139 | 1,311 | 55 |
85+ | 283 | 2,352 | 24.3 | 371,112 | 1,310 | 54 |
Sex | ||||||
Male | 579 | 1,011 | 23.4 | 745,178 | 1,286 | 55 |
Female | 1,021 | 1,353 | 24.3 | 1,357,075 | 1,329 | 55 |
Total | 1,600 | 1,182 | 24.0 | 2,102,253 | 1,308 | 55 |
SOURCE: Ruther and Helbing, 1988. | ||||||
Most of these services are not covered by Medicare, and a significant number of noninstitutionalized individuals who need such services do not receive them. Of the dependent community-dwelling elderly in 1985, almost 74 percent received all of their care from informal care givers; only a small percentage relied exclusively on formal sources of care of the sort previously mentioned (Scanlon, 1988).
The Federal Government’s Role in Support of the Elderly
As a result of legislative changes over the last several decades, federal spending has grown for income protection, health insurance, and other services designed to reduce high levels of poverty among the elderly. The focus of this spending has also shifted. According to the Special Committee on Aging (1987–1988), in 1960, less than 15 percent of the federal budget was spent on the elderly; 90 percent was for retirement income and 6 percent for health care. By contrast, in 1986 an estimated 26 percent of the federal budget (nearly $270 billion) went to programs in direct benefit to older Americans. Retirement income accounted for approximately 67 percent, and Medicare and Medicaid benefits accounted for nearly 27 percent of these monies. The federal government also spends money on general bene-
fit programs through the Older Americans Act (social, nutritional, and employment services), the Social Services Block Grants, and research conducted through the National Institutes of Health.
HEALTH STATUS
Self-Assessment of Health Status
Contrary to stereotype, most older persons view their health in a positive manner. In 1987, almost 70 percent of elderly people living in the community described their health as excellent, very good, or good compared with others their own age (Figure 3.3); only about 30 percent reported their health as poor (NCHS, 1989).
Life Expectancy
The trends in life expectancy both at birth and at age 65 continue upward (Table 3.12). The greatest gains in life expectancy at birth occurred at the beginning of the century, owing to reductions in deaths from infectious disease and in infant and childhood mortality. Most of the increase in life expectancy in the later part of the century (since 1970) has come from decreased mortality from chronic conditions among the middle-aged and the elderly populations.
Life expectancy at birth differs by sex; in 1986, life expectancy for males was 71.4 and for females 78.6 (NCHS, forthcoming, Table 20). Since 1900, white females have had the highest life expectancy and black males have had the lowest (NCHS, 1989, Table 13). The probability of surviving

FIGURE 3.3 Self-Assessment of Health by Age Group, 1987
TABLE 3.12 Life Expectancy at Birth and Additional Years of Life Expectancy at Age 65, by Sex: Selected Years
Year | Male | Female |
Life Expectancy at Birth | ||
1900 | 46.3 | 48.3 |
1950 | 65.6 | 71.1 |
1980 | 70.0 | 77.4 |
1985 | 71.2 | 78.2 |
1990 | 71.6 | 79.2 |
2000 | 72.9 | 80.5 |
2050 | 75.5 | 83.6 |
Additional Years of Life Expectancy at Age 65 | ||
1900–1902 | 11.5 | 12.2 |
1950 | 12.8 | 15.0 |
1980 | 14.1 | 18.3 |
1985 | 14.6 | 18.6 |
1990 | 15.0 | 19.5 |
2000 | 15.7 | 20.5 |
2050 | 17.4 | 23.1 |
SOURCES: Special Committee on Aging, 1987–1988; NCHS, 1989. | ||
to age 65 has increased substantially for all race-sex groups since 1900 (NCHS, 1988b).
Life expectancy at age 65 is more pertinent to the elderly population since it estimates additional years of life anticipated after entering the elderly population. Although the differences in life expectancy at age 65 by race are small, the differences by sex are large. According to NCHS (forthcoming, Table 20), life expectancy in 1986 at age 65 for males was 14.8 years and for females, 18.6 years. Males’ life expectancy at age 65 ranks tenth among countries with at least one million population, and females share the rank of seventh.
Mortality
Age-specific death rates for the elderly have improved dramatically in the last several decades (Table 3.13), although the amount of improvement
varies for individual age-race-sex groups. For example, declines in death rates have been more dramatic for those age 65 to 84 than for those age 85 and older. Additionally, decreases for older females are greater than those for older males.
The top ten causes of death in the United States have changed since 1900, the most striking change being the shift from infectious to noninfectious diseases. Today, heart disease, cancer, and cerebrovascular disease and stroke are the three leading causes of death for the elderly; two of three persons die of one of these conditions. The death rate from stroke has been decreasing over the past 30 years, probably owing to improved control of hypertension and better diagnosis, management, and rehabilitation of stroke
TABLE 3.13 Death Rates for All Causes per 100,000 Population, by Age, Race, and Sex: Selected Years
Age | 1960 | 1970 | 1980 | 1986 |
All races | ||||
55–64 | 1,735 | 1,659 | 1,346 | 1,255 |
65–74 | 3,822 | 3,583 | 2,995 | 2,801 |
75–84 | 8,745 | 8,004 | 6,693 | 6,348 |
85+ | 19,858 | 17,539 | 15,980 | 15,399 |
White male | ||||
55–64 | 2,225 | 2,203 | 1,729 | 1,573 |
65–74 | 4,484 | 4,810 | 4,036 | 3,635 |
75–84 | 10,300 | 10,099 | 8,830 | 8,342 |
85+ | 21,750 | 20,393 | 19,097 | 18,576 |
White female | ||||
55–64 | 1,079 | 1,015 | 876 | 853 |
65–74 | 2,780 | 2,471 | 2,067 | 2,032 |
75–84 | 7,697 | 6,699 | 5,402 | 5,109 |
85+ | 19,478 | 16,730 | 14,980 | 14,503 |
Black male | ||||
55–64 | 3,316 | 3,257 | 2,873 | 2,546 |
65–74 | 5,799 | 5,803 | 5,131 | 4,790 |
75–84 | 8,605 | 9,455 | 9,232 | 9,291 |
85+ | 14,845 | 14,415 | 16,099 | 15,488 |
Black female | ||||
55–64 | 2,511 | 1,986 | 1,561 | 1,470 |
65–74 | 4,064 | 3,861 | 3,057 | 2,892 |
75–84 | 6,730 | 6,692 | 6,212 | 6,149 |
85+ | 13,053 | 12,132 | 12,367 | 12,510 |
SOURCE: NCHS, 1989. | ||||
TABLE 3.14 Death Rates for Three Major Causes of Death per 100,000 Population: Selected Years
Age | 1960 | 1970 | 1980 | 1986 |
Heart disease | ||||
65–74 | 1,741 | 1,558 | 1,219 | 1,043 |
75–84 | 4,089 | 3,684 | 2,993 | 2,638 |
85+ | 9,318 | 8,468 | 7,777 | 7,179 |
All agesa | 286 | 254 | 202 | 175 |
Malignant neoplasms | ||||
65–74 | 714 | 754 | 818 | 847 |
75–84 | 1,127 | 1,168 | 1,232 | 1,287 |
85+ | 1,450 | 1,417 | 1,595 | 1,612 |
All agesa | 126 | 130 | 133 | 133 |
Cerebrovascular disease | ||||
65–74 | 469 | 384 | 220 | 164 |
75–84 | 1,491 | 1,254 | 789 | 574 |
85+ | 3,681 | 3,235 | 2,289 | 1,763 |
All agesa | 80 | 66 | 41 | 31 |
aRates are age-adjusted. SOURCE: NCHS, 1989. | ||||
victims. The death rate from heart disease has also been decreasing over the last several decades, but the death rate from cancer has been increasing.
The greatest number of deaths still occur from heart disease, but deaths from cancer continue to rise relative to that number (Table 3.14). Eliminating deaths from heart disease would add an estimated five years of life expectancy at age 65 (NCHS, 1988c). By contrast, if cancer were eliminated as a cause of death, the average life span would be extended by less than two years.
Although many elderly experience declines in organ functioning and physiologic processes, this is not necessarily an inherent part of the aging process (Manton, 1986; Guralnik and Kaplan, 1989). Since the elderly have experienced improvements in life expectancy and declines in mortality, an important issue to consider is whether these declines in mortality are accompanied by similar declines in morbidity, resulting in an elderly population with improved health status and physical functioning.
Chronic Illness and Impairment
More than four of five older persons have at least one chronic condition, and many have several, although these conditions do not necessarily limit
significant daily activities. The most prevalent chronic conditions (expressed in terms of morbidity from these conditions) in the elderly population include arthritis, hypertension, hearing impairments, and heart conditions (Table 3.15).
Older women experience chronic conditions (such as arthritis and osteoporosis) more frequently than men, and older men experience acute conditions (such as heart attacks) more often than women. In general, the health situation of elderly blacks is poorer than that of elderly whites.
Activity Limitations
Most elderly people do not need long-term-care assistance, but many suffer from some form of impairment that limits their ability to perform basic activities of daily living (ADLs) (Rowland et al., 1988). A broad set of ADLs includes eating, toileting, dressing, bathing, transferring, going outside, and walking; a “core set” of five ADLs includes all those except walking and going outside. ADLs categorize levels of functional impairment and thus have many health care planning, research, and policy purposes, such as increasing our understanding of the population at risk of institutionalization (or alternatively, in need of long-term-care services).
Functional impairment can be defined in many ways—ranging from difficulty with at least one ADL in the broad set (e.g., difficulty bathing) to
TABLE 3.15 Prevalence per 1,000 Population of Top Ten Chronic Conditions, by Age Group: 1986
Condition | All Ages | Age 45–64 | Age 65+ | Age 65–74 | Age 75+ |
Arthritis | 131 | 285 | 480 | 443 | 540 |
Hypertension | 123 | 251 | 394 | 385 | 409 |
Sinusitis | 145 | 187 | 169 | 169 | 171 |
Orthopedic impairment | 115 | 162 | 173 | 158 | 196 |
Hearing impairment | 88 | 136 | 296 | 244 | 378 |
Heart disease | 78 | 123 | 277 | 250 | 319 |
Diabetes | 28 | 64 | 98 | 92 | 109 |
Tinnitus | 27 | 49 | 85 | 83 | 88 |
Visual impairment | 35 | 46 | 95 | 69 | 136 |
Cataracts | 21 | 21 | 141 | 84 | 233 |
SOURCE: NCHS, 1987c. | |||||
difficulty with two or more ADLS in the core set. Some experts also use “instrumental” ADLs (IADLs), which attempt to assess cognitive as well as physical impairment and thus include various home care management activities (e.g., using the telephone, managing finances, and taking medications).
Data from the 1984 National Health Interview Survey Supplement on Aging show that, of the population age 65 and older living in the community, 6 million (23 percent) had difficulty with one or more personal care ADLs inventoried (Table 3.16); this figure is expected to reach 7.3 million by the year 2000. Close to 1.2 million community residents had difficulty with three or more ADLs.
Walking was the most frequently reported limitation, affecting 4.9 million elderly (19 percent of the population surveyed). The severity of ADL limitations is associated with age (Table 3.16). Nevertheless, even at very high levels of impairment, a significant number of community residents with ADL limitations manifest long-term improvements in functioning (Manton, 1988).
Mental Health
Mental health problems of the elderly are significant in frequency and in their influence on the overall well-being of the individual. Between 15 and 25 percent of older persons have serious symptoms of mental disorders (Special Committee on Aging, 1987–1988), and the elderly make up a considerable fraction (well beyond their proportion in the population) of the institutionalized mentally ill. For example, among all state mental hospital patients, 27 percent are age 65 and older (Special Committee on Aging, 1987–1988).
Depression is the psychiatric illness that occurs most commonly in old age; it is more prevalent than all forms of dementia and psychosis (Frengley, 1987). Symptoms of depression have been described in as many as 15 percent of community residents (Special Committee on Aging, 1987–1988). This rate may be misleading, however, because it represents primary depression, or depression that occurs for, reasons other than physical causes or drug side effects, rather than secondary depressions due to illness or drug side effects. The elderly are more at risk for secondary depressions than any other age group.
Alzheimer’s disease is the leading cause of cognitive impairment in old age. Several studies have shown the prevalence of Alzheimer’s disease in the older adult population to range from approximately 6 percent (Special Committee on Aging) to more than 10 percent (Evans et al., 1989). In addition, the prevalence rate is strongly associated with age. For example, one study of the prevalence of Alzheimer’s disease in a noninstitutionalized
TABLE 3.16 Age and Sex Distribution of the Elderly Population by Level of Impairment: 1984
|
| Percent Distribution | ||||
|
| Age | Sex | |||
Level of Impairment | Number (millions) | 65–74 | 75–84 | 85+ | Female | Male |
One of Seven ADLsa | 6.0 | 47 | 38 | 15 | 66 | 34 |
One Plus, Core ADLsb | 3.7 | 44 | 38 | 18 | 68 | 32 |
Two Plus, Core ADLsb | 2.0 | 42 | 37 | 21 | 67 | 33 |
Three Plus, Core ADLsb | 1.2 | 39 | 39 | 22 | 68 | 32 |
Total elderly | 26.4 | 62 | 31 | 75 | 9 | 41 |
aOne or more activities of daily living (ADL) limitations based on seven ADLs (walking, getting outside, bathing, transferring, eating, toileting, and dressing). bOne, two, or three or more ADL limitations based on the core set (bathing, transferring, eating, toileting, and dressing). SOURCE: Rowland et al., 1988. | ||||||
community sample revealed that 3.0 percent of those age 65 to 74 had probable Alzheimer’s disease compared with 18.7 percent of those age 75 to 84 (Evans et al., 1989).
Suicide is a more frequent cause of death among the elderly than any other age group (owing to the high suicide rate of older white men). In 1984, the suicide rate for white men age 65 and older was 41.6 deaths per 100,000 population, which was four times the national rate and six times the rate for white women age 65 and older (NCHS, 1988b).
SUMMARY
The United States will experience continued growth of the total population and the elderly population, especially among the oldest age groups. Between the years 2000 and 2040, the “baby boom” generation will turn 65, thus increasing the demands on the Medicare program and the long-term-care system.
The ratio of females to males in the elderly population will continue to rise. In addition, elderly women on average have a higher prevalence of limitations in activities of daily living, visit physicians more frequently, and are more predominant users of hospital and nursing home care than men. These trends have significant implications for demands on the Medicare program and the long-term-care system.
Because of increases in life expectancy and declining fertility rates, the ratio of elderly persons to working-age persons is increasing. This has significant economic implications, insofar as working-age persons support their own children, help support their own parents, provide for their own retirement (and health care), and provide the tax base for that portion of Medicare services covered by payroll taxes and general revenues (rather than those services covered by premiums). The increase in life expectancy also manifests changes in the social circumstances of our population. For instance, there are now four generations of persons, and informal caregivers are themselves older. With more women in the work force, the demand for professional long-term-care services rather than hands-on, informal support is higher. Together these two phenomena may move health care towards a more formalized system of care.
The incidence and prevalence of chronic illness increase with age, and chronic ailments are a major cause of disability requiring medical care. The new elderly population, however, may be healthier than previous cohorts of elderly because they will have experienced a lifetime of different and better medical care. These factors will have complex effects on future mortality rates, utilization of services, and health care expenditures.
Although the average level of economic well-being of the elderly has improved substantially over the past few decades, the incomes of the elderly are still less, on average, than those of the nonelderly. In addition, there are major disparities among subgroups of the elderly population with respect to economic well-being. These factors, too, will affect health, demand for care, and ability to pay for care out-of-pocket.
Health care expenditures for the elderly are expected to increase in the future, although at a slower rate than in the past. With respect to health services utilization, the hospital discharge rate and average length of stay are declining for the elderly population, while the use of physician and outpatient visits and other ambulatory services (such as outpatient surgery) is increasing. These shifts arise from several factors: the advent of PPS and the related incentives to hospitals for changes in behavior; cost containment initiatives fostering a movement from inpatient to outpatient care; expanding coverage for services rendered outside institutions; and the aging of the population.
These changes all increase the potential for overuse of certain services (e.g., procedures done in ambulatory settings) and underuse of other services (e.g., home health care), and they may have unpredictable effects on the technical quality of care.
The availability and adequacy of noninstitutional long-term, or post-acute, care is a specific concern. As the elderly population increases in both size and age, the need for noninstitutional services will be greater. Furthermore, since the beginning of PPS, length-of-stay reductions have been the greatest
for patients 85 years of age and older, precisely those who may need outside assistance the most. In addition to the higher discharge acuity, death or institutionalization of a spouse prompts concern about post-acute care because many elderly will then live alone and be likely to face special care needs. Finally, other social and economic trends occurring simultaneously are sure to affect the demand for and supply of long-term-care services. Among these trends are a decrease in family size and an increase of women in the work force, both of which lower the pool of women available to provide informal health care services in the home setting.
In summary, continuing rapid increases in the size and the age of the elderly population are expected over the next several decades. By the year 2000, the elderly population will stand at nearly 35 million, of whom almost 18 million will be ages 65 to 74, 12 million ages 75 to 84, and 5 million ages 85 and older. Taking these factors into account and assuming that current demand for care and utilization patterns remain stable, a myriad of services including alternatives to inpatient care such as outpatient physician care and innovative approaches to long-term and home health care services, will need to increase to meet the needs of the elderly. These changes all have major implications for the quality of and access to needed health care over the coming decade and beyond.
NOTE
1. | Patients with end-stage renal disease (ESRD) and disabled patients are the remaining 4 percent of the Medicare enrolled population. |
REFERENCES
Cohen, M.A., Tell, E.J., and Wallack, S. The Lifetime Risks and Costs of Nursing Home Use Among the Elderly. Medical Care 24:1161–1172, 1986.
The Commonwealth Fund Commission on Elderly People Living Alone. Old, Alone, and Poor. Baltimore, Md.: The Commission, 1987.
The Commonwealth Fund Commission on Elderly People Living Alone. Aging Alone: Profiles and Projections. Baltimore, Md.: The Commission, 1988.
CRS (Congressional Research Service, U.S. Library of Congress). Financing and Delivery of Long Term Care Services for the Elderly. 88–379 EPW. Washington, D.C.: U.S. Government Printing Office, May 25, 1988.
Evans, D.A., Funkenstein, H.H., Albert, M.S., et al. Prevalence of Alzheimer’s Disease in a Community of Older Persons: Higher Than Previously Reported. Journal of the American Medical Association 262:2551–2556, 1989.
Frengley, J.D. Depression. Generations 7(1):29–33, 1987.
GAO (General Accounting Office). Long-Term Care for the Elderly: Issues of Need, Access, and Cost . GAO/HRD-89–4. Washington, D.C.: General Accounting Office, November 28, 1988.
Gornick, M. and Hall, M.J. Trends in Medicare Use of Post-Hospital Care. Health Care Financing Review (Annual Supplement):27–38, 1988.
Guralnik, J.M. and Kaplan, G.A. Predictors of Healthy Aging: Prospective Evidence from the Alameda County Study. American Journal of Public Health 79:703–708, 1989.
Hurd, M. The Economic Status of the Elderly. Science 244:659–664, 1989.
Manton, K.G. Past and Future Life Expectancy Increases at Later Ages: Their Implications for the Linkage of Chronic Morbidity, Disability, and Mortality. Journal of Gerontology 41(5):672–681, 1986.
Manton, K.G. A Longitudinal Study of Functional Change and Mortality in the United States. Journal of Gerontology 43(5):163–61, 1988.
Manton, K. and Liu, K. The Future Growth of the Long-Term Care Population: Projections Based on the 1977 National Nursing Home Survey and the 1982 Long-Term Care Survey. Paper prepared for the Third National Leadership Conference on Long-Term Care Issues, Washington, D.C., 1984.
Moon, M. Emerging Wealth and Continuing Hardship: The Ecomonic Consequences of Aging Differently. Washington, D.C.: American Association of Retired Persons, 1988.
NCHS (National Center for Health Statistics). Use of Nursing Homes by the Elderly: Preliminary Data From the 1985 National Nursing Home Survey. Advancedata. No. 135. DHHS Publ. No. (PHS) 87–1250. Public Health Service. Hyattsville, Md.: National Center for Health Statistics, May 14, 1987a.
NCHS. Recent Declines in Hospitalization: United States, 1982–1986. Data From the Nation Hospital Interview Survey and the National Hospital Discharge Survey. Advancedata. No. 140. DHHS Publ. No. (PHS) 87–1250. Public Health Service. Hyattsville, Md.: National Center for Health Statistics, September 24, 1987b.
NCHS. Dawson, D.A., and Adams, P.F. Current Estimates From the National Health Interview Survey, United States, 1986. Vital and Health Statistics. Series 10, No. 164. DHHS Publ. No. (PHS) 87–1592. Public Health Service. Washington, D.C.: U.S. Government Printing Office, October 1987c.
NCHS. Nursing and Related Care Homes as Reported From the 1986 Inventory of Long-Term Care Places. Advancedata. No. 147. DHHS Publ. No. (PHS) 88–1250. Public Health Service. Hyattsville, Md.: National Center For Health Statistics, January 22, 1988a.
NCHS. Health, United States, 1987. DHHS Publ. No. (PHS) 88–1232. Public Health Service. Washington, D.C.: U.S. Government Printing Office, March 1988b.
NCHS. 1987 Summary: National Hospital Discharge Survey. Advancedata. No. 159 (Rev.). DHHS Publ. No. (PHS) 88–1250. Public Health Service. Hyattsville, Md.: National Center for Health Statistics, September 28, 1988c.
NCHS. Health, United States, 1988. DHHS Publ. No. (PHS) 89–1232. Public Health Service. Washington, D.C.: U.S. Government Printing Office, March 1989.
NCHS. Health, United States, 1989. Public Health Service. Washington, D.C.: U.S. Government Printing Office, forthcoming.
Rice, D.P. and Estes, C.L. Health of the Elderly: Policy Issues and Challenges. Health Affairs 3(4):25–49, Winter 1984.
Rowland, D., Lyons, B., Neuman, P., et al. Defining the Functionally Impaired Elderly Population. Center for Hospital Finance. Baltimore, Md.: The Department of Health Policy and Management, School of Hygiene and Public Health, The Johns Hopkins University. Report prepared under a grant from the American Association of Retired Persons, 1988.
Ruther, M. and Helbing, C. Use and Cost of Home Health Agency Services Under Medicare. Health Care Financing Review 10(1):105–108, 1988.
Scanlon, W.J. A Perspective on Long-Term Care for the Elderly. Health Care Financing Review (Annual Supplement):7–15, 1988.
Special Committee on Aging, U.S. Congress, Senate. Aging America: Trends and Projections. Washington, D.C.: U.S. Department of Health and Human Services, 1987–1988 Edition.
The Villers Foundation. On The Other Side of Easy Street. Washington, D.C., 1987.
Waldo, D.R., Sonnefeld, S.T., McKusick, D.R., et al. Health Expenditures by Age Group, 1977 and 1987. Health Care Financing Review 10(4):111–120, 1989.