Acute Exposure Guideline Levels for Selected Airborne Chemicals: Volume 14 (2013)
Chapter: 4 Methanesulfonyl Chloride Acute Exposure Guideline Levels
Acute Exposure Guideline Levels
PREFACE
Under the authority of the Federal Advisory Committee Act (FACA) P.L. 92-463 of 1972, the National Advisory Committee for Acute Exposure Guideline Levels for Hazardous Substances (NAC/AEGL Committee) has been established to identify, review, and interpret relevant toxicologic and other scientific data and develop AEGLs for high-priority, acutely toxic chemicals.
AEGLs represent threshold exposure limits for the general public and are applicable to emergency exposure periods ranging from 10 minutes (min) to 8 hours (h). Three levels—AEGL-1, AEGL-2, and AEGL-3—are developed for each of five exposure periods (10 and 30 min and 1, 4, and 8 h) and are distinguished by varying degrees of severity of toxic effects. The three AEGLs are defined as follows:
AEGL-1 is the airborne concentration (expressed as parts per million or milligrams per cubic meter [ppm or mg/m3]) of a substance above which it is predicted that the general population, including susceptible individuals, could experience notable discomfort, irritation, or certain asymptomatic, nonsensory effects. However, the effects are not disabling and are transient and reversible upon cessation of exposure.
____________________
1This document was prepared by the AEGL Development Team composed of Cheryl Bast (Oak Ridge National Laboratory), Lisa Ingerman (SRC, Inc.), Chemical Manager Roberta Grant (National Advisory Committee [NAC] on Acute Exposure Guideline Levels for Hazardous Substances), and Ernest V. Falke (U.S. Environmental Protection Agency). The NAC reviewed and revised the document and AEGLs as deemed necessary. Both the document and the AEGL values were then reviewed by the National Research Council (NRC) Committee on Acute Exposure Guideline Levels. The NRC committee has concluded that the AEGLs developed in this document are scientifically valid conclusions based on the data reviewed by the NRC and are consistent with the NRC guidelines reports (NRC 1993, 2001).
AEGL-2 is the airborne concentration (expressed as ppm or mg/m3) of a substance above which it is predicted that the general population, including susceptible individuals, could experience irreversible or other serious, long-lasting adverse health effects or an impaired ability to escape.
AEGL-3 is the airborne concentration (expressed as ppm or mg/m3) of a substance above which it is predicted that the general population, including susceptible individuals, could experience life-threatening health effects or death.
Airborne concentrations below the AEGL-1 represent exposure concentrations that could produce mild and progressively increasing but transient and nondisabling odor, taste, and sensory irritation or certain asymptomatic, nonsensory effects. With increasing airborne concentrations above each AEGL, there is a progressive increase in the likelihood of occurrence and the severity of effects described for each corresponding AEGL. Although the AEGL values represent threshold concentrations for the general public, including susceptible subpopulations, such as infants, children, the elderly, persons with asthma, and those with other illnesses, it is recognized that individuals, subject to idiosyncratic responses, could experience the effects described at concentrations below the corresponding AEGL.
SUMMARY
Methanesulfonyl chloride is a pale yellow liquid with an unpleasant odor. It is made commercially either by the chlorination of methyl mercaptan or by the sulfochlorination of methane. It is used as an intermediate in the pharmaceutical, photographic, fiber, dye, and agricultural industries. It is also used as a stabilizer, catalyst, curing agent, and chlorinating agent. Methanesulfonyl chloride causes severe ocular, dermal, and mucous membrane irritation. Chlorine gas and sulfur oxides are produced when it is heated until decomposition.
Data were insufficient to derive AEGL-1 values for methanesulfonyl chloride. Therefore, AEGL-1 values are not recommended.
Appropriate chemical-specific data were not available for deriving AEGL-2 values. In the absence of such data, chemicals with a steep concentration-response curve may be derived by dividing AEGL-3 values by 3 (NRC 2001). A steep concentration-response curve has been demonstrated for methanesulfonyl chloride; mortality in rats exposed to it for 4 h was 10% at 20 ppm and 90% at 28 ppm (Pennwalt Corporation 1987).
A 4-h rat BMCL05 (benchmark concentration, 95% lower confidence limit with 5% response) of 15.5 ppm (Pennwalt Corporation 1987) was used as the point of departure for AEGL-3 values. Values were time scaled using the equation Cn × t = k, where n ranges from 0.8 to 3.5 (ten Berge et al. 1986). An empirical value for n was sought by analyzing lethality data in rats exposed for 1-6 h by log probit analysis (see Appendix E). However, the data and modeling results were considered inadequate to define an empirical value of n, but
indicated that time is an important component of the concentration-time relationship for methanesulfonyl chloride. When an empirical value cannot be determined, default values of n = 1 for extrapolation to longer durations and n = 3 for extrapolation to shorter durations may be used to derive AEGL values protective of human health (NRC 2001). However, the log probit analyses suggested that the value of n is most likely around 1, and provided sufficient information to exclude the default value of n = 3 for scaling from longer to shorter durations. Therefore, on the basis of available data and log probit analyses, AEGL values were scaled across time using the equation Cn × t = k, with n = 1. Uncertainty factors of 10 were applied to account for interspecies differences and intraspecies variability (total uncertainty factor of 100), because of the lack of information available to describe species differences in toxicity and interindividual variability. Although clinical signs and pathologic findings from the limited data set suggest contact irritation (partial eye closure, disturbed respiratory patterns, salivation, nose rubbing, blinking, nasal discharge, lacrimation, increased relative lung weight, pulmonary congestion, and corneal surface damage) and this type of portal-of-entry effect is not expected to vary greatly between species, the available data are not sufficient to conclusively describe the mechanism of toxicity. The 30-min AEGL-3 value was adopted as the 10-min value because of the added uncertainty of extrapolating a 4-h point of departure to a 10-min value.
AEGL values for methanesulfonyl chloride are presented in Table 4-1.
1. INTRODUCTION
Methanesulfonyl chloride is a pale yellow liquid with an unpleasant odor. It is made commercially either by the chlorination of methyl mercaptan or by the sulfochlorination of methane. It is used as an intermediate in the pharmaceutical, photographic, fiber, dye, and agricultural industries. It is also used as a stabilizer, catalyst, curing agent, and chlorinating agent. Methanesulfonyl chloride causes severe ocular, skin, and mucous membrane irritation. Chlorine gas and sulfur oxides are produced when methanesulfonyl chloride is heated to decomposition (Shertzer 2001). Methanesulfonyl chloride is shipped in 55 gallon drums; production in 1981 was “probably greater than 2.27 × 10⁶ grams” (HSDB 2007). Chemical and physical data for methanesulfonyl chloride are presented in Table 4-2.
2. HUMAN TOXICITY DATA
Methanesulfonyl chloride is a strong irritant to the skin, eyes, mucous membranes, and respiratory tract and is corrosive. Its odor is described as unpleasant, although no information on an odor threshold was found (Shertzer 2001).
TABLE 4-1 AEGL Values for Methanesulfonyl Chloride
| Classification | 10 min | 30 min | 1 h | 4 h | 8 h | End Point (Reference) |
| AEGL-1 (nondisabliiig)a | NR | NR | NR | NR | NR | Insufficient data |
| AEGL-2 (disabling) | 0.40 ppm (1.9 mg/m3) | 0.40 ppm (1.9 mg/m3) | 0.21 ppm (0.98 mg/m3) | 0.053 ppm (0.25 mg/m3) | 0.026 ppm (0.12 mg/m3) | One third of AEGL-3 values (NRC2001). |
| AEGL-3 (lethal) | 1.2 ppm (5.6 mg/m3) | 1.2 ppm (5.6 mg/m3) | 0.62 ppm (2.9 mg/m3) | 0.16 ppm (0.75 mg/m3) | 0.078 ppm (0.37 mg/m3) | 4-h BMCL05 of 15.5 ppm in rats (Pennwalt Coip oration 1987) |
Abbreviations: BMCL05, benchmark concentration, 95% lower confidence limit with 5% response; NR, not recommended because of insufficient data.
aAbsence of an AEGL-1 value does not imply that concentrations below the AEGL-2 values are without effect.
TABLE 4-2 Chemical and Physical Data for Methanesulfonyl Chloride
|
Parameter |
Value |
References |
|
Synonyms |
Chloromethyl sulfone; mesyl chloride; methanesulfonic acid chloride; methyl sulfochloride |
HSDB 2007 |
|
CAS registry no. |
124-63-0 |
HSDB 2007 |
|
Chemical formula |
CH3ClO2S |
HSDB 2007 |
|
Molecular weight |
114.55 |
HSDB 2007 |
|
Physical state |
Pale, yellow liquid |
HSDB 2007 |
|
Freezing point |
-32°C |
HSDB 2007 |
|
Boiling point |
62°C @ 18mmHg |
HSDB 2007 |
|
Flash point |
110°C |
Shertzer 2001 |
|
Density/specific gravity |
1.4805 g/L @ 18°C |
HSDB 2007 |
|
Solubility in water |
Insoluble; hydrolyzes slowly |
HSDB 2007 |
|
Vapor pressure |
3.09 mm Hg @ 25°C |
HSDB 2007 |
|
Conversion factors |
1 ppm = 4.68 mg/m3 |
|
3. ANIMAL TOXICITY DATA
3.1. Acute Toxicity
Groups of five male and five female Sprague-Dawley rats were exposed to methanesulfonyl chloride at 0, 20, 28, or 54 ppm (analytic concentrations) for 4 h, followed by a 14-day observation period (Pennwalt Corporation 1987). Whole-body exposure chambers were constructed of Perspex and had an internal volume of 115 L. Test atmospheres were generated by supplying methanesulfonyl chloride from a syringe driven by a syringe pump. The compressed air supply to the generator was dried, filtered, and oil free; flow rate was 25 L/min. Test atmospheres were analyzed five times per exposure by gas chromatography flame ionization detection, and were monitored for the presence of droplets of methanesulfonyl chloride at 1.5 and 3.5 h. The study followed Good Laboratory Practice and the guidelines of Organisation for Economic Cooperation and Development for assessing acute inhalation toxicity (OECD Test 403). Clinical signs observed during exposure in all groups included closing or partial closing of the eyes, wet fur around the mouth, hunched body posture, and disturbed respiratory patterns. Clinical signs during the observation period included lethargy and disturbances of the respiratory pattern. Respiratory effects persisted for several days in rats that survived. Lung-to-body weight ratio was increased in most decedents, and pulmonary congestion and damage to the corneal surface of the eyes were also found. A 4-h LC50 (lethal concentration, 50% lethality) value of 25 ± 2.7 ppm, a BMCL05 of 15.5 ppm, and BMC01 (benchmark concentration with 1% response) of 17.4 ppm were calculated. Mortality data from this study are summarized in Table 4-3.
TABLE 4-3 Mortality in Rats Exposed to Methanesulfonyl Chloride for 4 Hours
| Mortality | |||
| Concentration (ppm) | Males | Females | Combined |
| 0 | 0/5 | 0/5 | 0/10 |
| 20 | 1/5 | 0/5 | 1/10 |
| 28 | 4/5 | 5/5 | 9/10 |
| 54 | 5/5 | 5/5 | 10/10 |
| LC50 | 25 ppm | ||
| BMC01 | 17.4 ppm | ||
| BMCL05 | 15.5 ppm | ||
Source: Pennwalt Corporation 1987.
Groups of five male and five female Sprague-Dawley rats were exposed to methanesulfonyl chloride at 165, 174, or 300 ppm (analytic concentrations) for 1 h, followed by a 14-day observation period (Pennwalt Corporation 1986). Animal were exposed (whole body) in 100-L Plexiglas chambers. Test atmospheres were generated by placing methanesulfonyl chloride into a bubbler fitted with an impinger. A metered, dried air supply was delivered into the bubbler and the resulting vapor laden air stream was introduced into the exposure chamber; flow rate was 25-26 L/min. Concentrations of methanesulfonyl chloride were analyzed twice per exposure. The study followed Good Laboratory Practice and U.S. Department of Transportation guidelines. Clinical signs noted during exposure and within 5-h post-exposure included secretory and pulmonary responses (not otherwise specified) and decreased activity in all groups. Rats in the 300-ppm group had closed eyes and exhibited prostration. Signs of toxicity in this group during the observation period included secretory and pulmonary responses and generally poor condition until death on the afternoon following exposure. Survivors in the 165- and 174-ppm groups showed secretory and pulmonary effects through days 4-5; these signs were noted sporadically thereafter. Corneal irregularities and opacities were found in three of nine rats in the 165-ppm group and all eight rats in the 174-ppm group at the end of the observation period. An LC50 value could not be calculated from the data; however, the investigators stated that the 1-h LC50 is most likely in the range of 175 to 250 ppm. Mortality data from this study are summarized in Table 4-4.
Groups of three rats were exposed to nominal concentrations of methanesulfonyl chloride at 2,145 ppm for up to 45 min, 29 ppm for 6 h, or 132 ppm for 6 h, followed by a 14-day observation period (TerHaar 1978). Chamber temperatures were 24-26°C. No further experimental details were provided. Methanesulfonyl chloride was described as a severe tissue irritant, capable of causing necrosis on any tissue it contacts. Results and observations of this study are presented in Table 4-5.
Oral LD50 values for methanesulfonyl chloride of approximately 175 mg/kg and 200 mg/kg were determined for rats and mice, respectively (TerHaar 1978). Deaths occurred immediately after dosing, except for two mice that survived a dose near the LD50. Hematuria developed in surviving rats. No additional details were presented.
TABLE 4-4 Mortality in Rats Exposed to Methanesulfonyl Chloride for 1 Hour
| Mortality | |||
| Concentration (ppm) | Males | Females | Combined |
| 165 | 1/5 | 0/5 | 1/10 |
| 174 | 1/5 | 1/5 | 2/10 |
| 300 | 5/5 | 5/5 | 10/10 |
Source: Pennwalt Corporation 1986.
TABLE 4-5 Mortality and Clinical Signs in Rats Exposed to Methanesulfonyl Chloride
| Concentration (ppm) | Duration | Mortality | Time to Death | Clinical Signs (when first observed) |
| 2.145 | 45 niin | 3/3 | 1 dead in 30 min 1 dead in 40 min 1 dead in 45 mill |
Blinking and nose nibbing (1 min). salivation (4 min). dyspnea and piloerection (5 min). lacrimation and clear nasal discharge (10 min). |
| 29 | 6 h | 0/3 | — | Blinking (1 min). nose nibbing (2 min). piloerection (5 min). vasodilation (15 min). |
| 132 | 6 h | 3/3 | 2 dead in 20-h post-exposure 1 dead in 3-d post-exposure | Blinking and nose nibbing (1 min). dyspnea and piloerection (10 min). clear nasal discharge (15 min). lacrimation and salivation (25 min). wheezing (265 min). |
Source: TerHaar 1978.
3.2. Developmental and Reproductive Toxicity
No data on the developmental and reproductive toxicity of methanesulfonyl chloride were available.
3.3. Genotoxicity
In the presence of exogenous metabolic activation (S9 mix), methanesulfonyl chloride induced chromosome aberrations in vitro in Chinese hamster ovary (CHO) cells (Sipi et al. 1997). Without metabolic activation, no response was observed.
3.4. Chronic Toxicity and Carcinogenicity
No data on the chronic toxicity or carcinogenicity of methanesulfonyl chloride were available.
3.5. Summary
Animal toxicity data are limited. Clinical signs, including ocular and nasal irritation, respiratory difficulty, nasal discharge, wheezing, and corneal opacities, are consistent with severe irritation. Methanesulfonyl chloride induced chromosome aberrations in CHO cells only in the presence of metabolic activation. No data on the developmental, reproductive, chronic, or carcinogenic effects of methanesulfonyl chloride were available.
4. SPECIAL CONSIDERATIONS
4.1. Metabolism and Disposition
No information was available on the metabolism and disposition of methanesulfonyl chloride.
4.2. Mechanism of Toxicity
No information was available on the mechanism of toxicity of methanesulfonyl chloride.
4.3. Structure-Activity Relationships
Methanesulfonyl chloride (CH3ClO2S) is structurally similar to thionyl chloride (Cl2OS) and sulfuryl chloride (Cl2O2S). However, thionyl chloride and sulfuryl chloride readily hydrolyze to SO2 and HCl whereas methanesulfonyl chloride hydrolyzes very slowly. The health effects of these three compounds are similar but their mechanism of toxicity is likely different. Although data are limited, it appears that the effects of thionyl chloride and sulfuryl chloride result from their hydrolysis products rather than from exposure to the parent compounds; in contrast, because methanesulfonyl chloride is hydrolyzed very slowly, the effects likely result from exposure to the parent compound (EPA 2006; NRC 2011).
4.4. Other Relevant Information
4.4.1. Species Variability
No information on species variability from inhalation exposure to methanesulfonyl chloride was available. However, clinical signs are consistent with contact irritation. Therefore, effects are not expected to vary widely between species. The limited data suggest no difference in acute oral lethality between rats and mice (TerHaar 1978).
4.4.2. Susceptible Populations
No information on populations especially sensitive to methanesulfonyl chloride toxicity was available. However, clinical signs are consistent with contact irritation. Therefore, effects are not expected to vary widely among individuals.
4.4.3. Time Scaling
AEGL values were scaled using the equation Cn × t = k where n ranges from 0.8 to 3.5 (ten Berge et al. 1986). An empirical value for n was sought by analyzing lethality data in rats exposed for 1-6 h. Log probit analysis of the data (see Appendix E) yielded a point estimate of n = 0.7, with lower and upper bounds of 0.3 and 1.1, respectively; however, the p value of the chi-square goodness-of fit-test indicated a poor fit of the model to the data. Additional log probit analysis without the 6-h data (the two data points were associated with 0% and 100% mortality, so added little useful information to the analysis) yielded an estimate of n = 0.66, with upper and lower confidence limits of 0.61 and 0.71, respectively. For the reduced data set, which only included two durations (1 and 4 h), the p-value of the chi-square goodness-of-fit test was 1.0, indicating an exact fit to the data. Overall, the data and modeling results were considered inadequate to define an empirical value of n, but indicated that time is an important component of the concentration-time relationship for methanesulfonyl chloride. When an empirical value cannot be determined, default values of n = 1 for extrapolation to longer durations and n = 3 for extrapolation to shorter durations may be used to derive AEGL values protective of human health (NRC 2001). However, the log probit analyses suggested that the value of n is most likely around 1, and provided sufficient information to exclude the default value of n = 3 for scaling from longer to shorter durations. Therefore, on the basis of available data and log probit analyses, AEGL values were scaled across time using the equation Cn × t = k, with n = 1.
5. DATA ANALYSIS FOR AEGL-1
5.1. Human Data Relevant to AEGL-1
No human data relevant to development of AEGL-1 values for methanesulfonyl chloride were available.
5.2. Animal Data Relevant to AEGL-1
No animal data relevant to development of AEGL-1 values for methanesulfonyl chloride were available.
5.3. Derivation of AEGL-1 Values
No human or animal data were available for derivation of AEGL-1 values for methanesulfonyl chloride. Therefore, no AEGL-1 values are recommended.
6. DATA ANALYSIS FOR AEGL-2
6.1. Human Data Relevant to AEGL-2
No human data relevant to development of AEGL-2 values for methanesulfonyl chloride were available.
6.2. Animal Data Relevant to AEGL-2
No animal data relevant to development of AEGL-2 values for methanesulfonyl chloride were available.
6.3. Derivation of AEGL-2 Values
Appropriate chemical-specific data for deriving AEGL-2 values were not available. In the absence of such data, chemicals with a steep concentration-response curve may be derived by dividing AEGL-3 values by 3 (NRC 2001). A steep concentration-response curve has been demonstrated for methanesulfonyl chloride; mortality in rats exposed to it for 4 h was 10% at 20 ppm and 90% at 28 ppm (Pennwalt Corporation 1987). AEGL-2 values are presented in Table 4-6, and calculations are presented in Appendix A.
7. DATA ANALYSIS FOR AEGL-3
7.1. Human Data Relevant to AEGL-3
No human data relevant to development of AEGL-3 values for methanesulfonyl chloride were available.
7.2. Animal Data Relevant to AEGL-3
A 4-h BMCL05 of 15.5 ppm and BMC01 of 17.4 ppm (Pennwalt Corporation 1987) was calculated from a well-conducted acute inhalation study with rats (see Appendix D). A 1-h rat study was also available (Pennwalt Corporation 1986); however, the data did not allow for the calculation of an LC50 value, although the investigators stated that the 1-h LC50 is most likely in the range of 175 to 250 ppm. Ocular and nasal irritation, piloerection, and vasodilation were observed within the first 15 min of exposure in rats exposed to methanesulfonyl chloride at 29 ppm for 6 h, but no deaths occurred (TerHaar 1978).
7.3. Derivation of AEGL-3 Values
The 4-h rat BMCL05 of 15.5 ppm (Pennwalt Corporation 1987) was used as the point of departure for calculating AEGL-3 values. Values were scaled
across time using the equation Cn × t = k, with n = 1, on the basis of the time-scaling analysis in Section 4.4.3. The 30-min AEGL-3 value was adopted as the 10-min value because of the uncertainty of extrapolating a 4-h point of departure to a 10-min value. Uncertainty factors of 10 were applied to account for inter-species differences and intraspecies variability (total uncertainty factor of 100), because of the lack of information available to describe species differences in toxicity and interindividual variability. Although clinical signs and pathologic finding from the limited data set suggest contact irritation (partial eye closure, disturbed respiratory patterns, salivation, nose rubbing, blinking, nasal discharge, lacrimation, increased relative lung weight, pulmonary congestion, and corneal surface damage) and this type of portal-of-entry effect is not expected to vary greatly between species, the available data are not sufficient to conclusively describe the mechanism of toxicity. AEGL-3 values for methanesulfonyl chloride are presented in Table 4-7, and calculations are presented in Appendix A.
AEGL-3 values are considered adequately protective. If the study by TerHaar (1978) is used to calculate values, a point of departure of 29 ppm for a 6-h exposure would be chosen on the basis of no mortality, although severe irritation was present. Time scaling and applying the uncertainty factors described above yields higher AEGL-3 values of 3.5 ppm for the 10-min and 30-min durations, 1.7 ppm for 1 h, 0.44 ppm for 4 h, and 0.22 ppm for 8 h.
8. SUMMARY OF AEGLS
8.1. AEGL Values and Toxicity End Points
AEGL values for methanesulfonyl chloride are presented in Table 4-8. AEGL-1 values are not recommended because of insufficient data. AEGL-2 values were derived by taking one-third of the AEGL-3 values, and AEGL-3 values were based on a 4-h rat BMCL05 value (Pennwalt Corporation 1987).
TABLE 4-6 AEGL-2 Values for Methanesulfonyl Chloride
| 10 min | 30 min | 1 h | 4 h | 8 h |
| 0.40 ppm (1.9 mg/m3) | 0.40 ppm (1.9 mg/m3) | 0.21 ppm (0.98 mg/m3) | 0.053 ppm (0.25 mg/m3) | 0.026 ppm (0.12mg/m3) |
TABLE 4-7 AEGL-3 Values for Methanesulfonyl Chloride
| 10 min | 30 min | 1 h | 4 h | 8 h |
| 1.2 ppm (5.6 mg/m3) | 1.2 ppm (5.6 mg/m3) | 0.62 ppm (2.9 mg/m3) | 0.16 ppm (0.75 mg/m3) | 0.078 ppm (0.37 mg/m3) |
TABLE 4-8 AEGL Values for Methanesulfonyl Chloride
| Exposure Duration | |||||
| Classification | 10 min | 30 min | 1 h | 4 h | 8 h |
| AEGL-1 (nondisabliiig)a | NR | NR | NR | NR | NR |
| AEGL-2 (disabling) | 0.40 ppm (1.9 mg/m3) | 0.40 ppm (1.9 mg/m3) | 0.21 ppm (0.98 mg/m3) | 0.053 ppm (0.25 mg/m3) | 0.026 ppm (0.12 mg/m3) |
| AEGL-3 (lethal) | 1.2 ppm (5.6mg/m3) | 1.2 ppm (5.6 mg/m3) | 0.62 ppm (2.9 mg/m3) | 0.16 ppm (0.75 mg/m3) | 0.078 ppm (0.37 mg/m3) |
Abbreviations: NR, not recommended because of insufficient data.
aAbsence of an AEGL-1 value does not imply that concentrations below the AEGL-2 values are without effect.
8.2. Comparison with Other Standards and Guidelines
There are no other standards or guidelines for methanesulfonyl chloride.
8.3. Data Adequacy and Research Needs
There are no human data on methanesulfonyl chloride, and animal data are limited. Additional acute inhalation toxicity studies in other species would be helpful.
9. REFERENCES
Arkema. 2007. Methanesulfonyl Chloride, IUCLID Data Set. Arkema, Toxicology and Environment Department. June 21, 2007.
EPA (U.S. Environmental Protection Agency). 2006. Proposed Acute Exposure Guideline Levels for Sulfuryl Chloride. NAC/AEGL Committee, U.S. Environmental Protection Agency, Washington, DC. November 2006.
HSDB (Hazardous Substances Data Bank). 2007. Methanesulfonyl chloride (CAS Reg. No. 124-63-0). TOXNET, Specialized Information Services, U.S. National Library of Medicine, Bethesda, MD [online]. Available: http://toxnet.nlm.nih.gov/cgi-bin/sis/htmlgen?HSDB [accessed Sept. 4, 2012].
NRC (National Research Council). 1993. Guidelines for Developing Community Emergency Exposure Levels for Hazardous Substances. Washington, DC: National Academy Press.
NRC (National Research Council). 2001. Standing Operating Procedures for Developing Acute Exposure Guideline Levels for Hazardous Chemicals. Washington, DC: National Academy Press.
NRC (National Research Council). 2011. Sulfuryl chloride. Pp. 282-306 in Acute Exposure Guideline Levels for Selected Airborne Chemicals, Vol. 10. Washington, DC: National Academies Press.
Pennwalt Corporation. 1986. An Acute Inhalation Toxicity Study of Methane Sulfonyl Chloride in the Rat. Report No. 85-7854. Bio/Dymanics Inc. October 8, 1986 (as cited in Arkema 2007).
Pennwalt Corporation. 1987. Methanesulfonyl Chloride, Acute Inhalation Toxicity in Rats, 4-Hour Exposure. Report No. PWT 45/861670. Huntingdon Research Centre. February 23, 1987 (as cited in Arkema 2007).
Shertzer, H.G. 2001. Organic sulfur compounds. Pp. 746-747 in Patty’s Toxicology, Vol. 7, 5th Ed., E. Bingham , B. Cohrssen, and C.H. Powell, eds. New York: Wiley.
Sipi, P., C. Rosenberg, Z. Rudek, P. Jäppinen, H. Vainio, and H. Norppa. 1997. Cytogenetic effects of softwood kraft pulp bleaching effluents and methanesulfonyl chloride in Chinese hamster ovary cells. Mutat. Res. 390(1-2):105-112.
ten Berge, W.F., A. Zwart, and L.M. Appelman. 1986. Concentration-time mortality response relationship of irritant and systemically acting vapours and gases. J. Hazard. Mater. 13(3):301-309.
TerHaar, C.J. 1978. Initial Submission: Basic Toxicity of Methanesulfonyl Chloride with Cover Letter Dated 08/26/92. Submitted to EPA by Eastman Kodak Co., Rochester, NY. EPA Document No. 88-920009463. Microfiche No. OTS0571119.
APPENDIX A
DERIVATION OF AEGL VALUES FOR METHANESULFONYL CHLORIDE
Derivation of AEGL-1 Values
Data are insufficient to derive AEGL-1 values for methanesulfonyl chloride. Therefore, AEGL-1 values are not recommended.
Derivation of AEGL-2 Values
AEGL-2 values were derived by taking one-third of the respective AEGL-3 values, because there inadequate data to derive AEGL-2 values. This approach is justified by the steep concentration-response for this chemical (NRC 2001).
|
10-min AEGL-2: |
1.2 ppm ÷ 3 = 0.40 ppm |
|
30-min AEGL-2: |
1.2 ppm ÷ 3 = 0.40 ppm |
|
1-h AEGL-2: |
0.62 ppm ÷ 3 = 0.21 ppm |
|
4-h AEGL-2: |
0.16 ppm ÷ 3 = 0.053 ppm |
|
8-h AEGL-2: |
0.078 ppm ÷ 3 = 0.026 ppm |
Derivation of AEGL-3 Values
|
Key study: |
Pennwalt Corporation. 1987. Methanesulfonyl Chloride, Acute Inhalation Toxicity in Rats, 4-Hour Exposure. Report No. PWT 45/861670. Huntingdon Research Centre. February 23, 1987 (as cited in Arkema 2007). |
|
Toxicity end point: |
4-h rat BMCL05 of 15.5 ppm |
|
Time scaling: |
AEGL values were scaled using the equation Cn × t = k where n ranges from 0.8 to 3.5 (ten Berge et al. 1986). An empirical value for n was sought by analyzing lethality data in rats exposed for 1-6 h. Log probit analysis yielded a point estimate of n = 0.7, with lower and upper bounds of 0.3 and 1.1, respectively; however, the p value of the chi-square |
|
goodness-of-fit test indicated a poor fit of the model to the data. Additional log probit analysis without the 6-h data (the two data points were associated with 0% and 100% mortality, so added little useful information to the analysis) yielded an estimate of n = 0.66, with upper and lower confidence limits of 0.61 and 0.71, respectively. For the reduced data set, which only included two durations (1 and 4 h), the p-value of the chi-square goodness-of-fit test was 1.0, indicating an exact fit to the data. Overall, the data and modeling results were considered inadequate to define an empirical value of n, but indicated that time is an important component of the concentration-time relationship for methanesulfonyl chloride. When an empirical value cannot be determined, default values of n = 1 for extrapolation to longer durations and n = 3 for extrapolation to shorter durations may be used to derive AEGL values protective of human health (NRC 2001). However, the log probit analyses suggested that the value of n is most likely around 1, and provided sufficient information to exclude the default value of n = 3 for scaling from longer to shorter durations. Therefore, on the basis of available data and log probit analyses, AEGL values were scaled across time using the equation Cn × t = k, with n = 1. (15.5 ppm)1 × 4 h = 62 ppm-h |
|
|
Uncertainty factors: |
10 for interspecies differences |
|
10-min AEGL-3: |
Set equal to the 30-min value of 1.2 ppm |
|
30-min AEGL-3: |
C1 × 0.5 |
|
1-h AEGL-3: |
C1 × 1 |
|
4-h AEGL-3: |
C = 15.5 ppm |
APPENDIX B
ACUTE EXPOSURE GUIDELINE LEVELS FOR METHANESULFONYL CHLORIDE
Derivation Summary
AEGL-1 VALUES
Data were insufficient for deriving AEGL-1 values for methanesulfonyl chloride. Therefore, AEGL-1 values are not recommended for this chemical.
AEGL-2 VALUES
| 10 min | 30 min | 1 h | 4 h | 8 h |
| 0.40 ppm (1.9 mg/m3) | 0.40 ppm (1.9 mg/m3) | 0.21 ppm (0.98 mg/m3) | 0.053 ppm (0.25 mg/m3) | 0.026 ppm (0.12 mg/m3) |
| Data adequacy: Sparse data set for methanesulfonyl chloride. For chemicals with a steep concentration-response curve, AEGL-3 values may be divided by 3 to estimate AEGL-2 values (NRC 2001). A steep concentration-response curve has been demonstrated for methanesulfonyl chloride; mortality in rats exposed to it for 4 h was 10% at 20 ppm and 90% at 28 ppm. | ||||
AEGL-3 VALUES
| 10 min | 30 min | 1 h | 4 h | 8 h |
| 1.2 ppm (5.6 mg/m3) | 1.2 ppm (5.6 mg/m3) | 0.62 ppm (2.9 mg/m3) | 0.16 ppm (0.75 mg/m3) | 0.078 ppm (0.37 mg/m3) |
| Key reference: Pennwalt Corporation. 1987. Methanesulfonyl Chloride, Acute Inhalation Toxicity in Rats, 4-Hour Exposure. Report No. PWT 45/861670. Huntingdon Research Centre. February 23, 1987 (cited in Arkema 2007). | ||||
| Test species/Strain/Number: Rat, strain not specified, 10/sex/concentration | ||||
| Exposure route/Concentrations/Durations: Inhalation; 20, 28, and 54 ppm for 4 h | ||||
| Effects: Clinical signs of irritation in all test groups. | ||||
| Concentration (ppm) | Mortality | |||
| 0 | 0/10 | |||
| 20 | 1/10 | |||
| 28 | 9/10 | |||
| 54 | 10/10 | |||
| LC50 | 25 ppm | |||
| BMC01 | 17.4 ppm | |||
| BMCL05 | 15.5 ppm | |||
| End point/Concentration/Rationale: 4-h BMCL05 of 15.5 ppm (see Appendix D), considered threshold for lethality. | ||||
| Uncertainty factors/Rationale: No information available to describe species differences in toxicity or interindividual variability. Although clinical signs and pathologic findings from the limited data set suggest contact irritation and this type of portal-of-entry effect is not expected to vary greatly between species, the available data are not sufficient to conclusively describe the mechanism of toxicity. Total uncertainty factor: 100 Interspecies: 10 Intraspecies: 10 |
||||
| Modifying factor: Not applicable | ||||
| Animal-to-human dosimetric adjustment: Not applicable | ||||
| Time scaling: AEGL-3 values were scaled using the equation Cn × t = k where n ranges from 0.8 to 3.5 (ten Berge et al. 1986). An empirical value for n was sought by analyzing lethality data in rats exposed for 1–6 h. Log probit analysis yielded a point estimate of n = 0.7, with lower and upper bounds of 0.3 and 1.1, respectively; however, the p value of the chi-square goodness-of-fit test indicated a poor fit of the model to the data. Additional log probit analysis without the 6-h data (the two data points were associated with 0% and 100% mortality, so added little useful information to the analysis) yielded an estimate of n = 0.66, with upper and lower confidence limits of 0.61 and 0.71, respectively. For the reduced data set, which only included two durations (1 and 4 h), the p-value of the chi-square goodness-of-fit test was 1.0, indicating an exact fit to the data. Overall, the data and modeling results were considered inadequate to define an empirical value of n, but indicated that time is an important component of the concentration-time relationship for methanesulfonyl chloride. When an empirical value cannot be determined, default values of n = 1 for extrapolation to longer durations and n = 3 for extrapolation to shorter durations may be used to derive AEGL values protective of human health (NRC 2001). However, the log probit analyses suggested that the value of n is most likely around 1, and provided sufficient information to exclude the default value of n = 3 for scaling from longer to shorter durations. Therefore, on the basis of available data and log probit analyses, AEGL values were scaled across time using the equation Cn × t = k, with n = 1. The 30-min AEGL-3 value was adopted as the 10-min value because of the uncertainty associated with extrapolating a 4-h point of departure to a 10-min value. | ||||
| Data adequacy: Sparse data set. AEGL-3 values are considered protective. If the study by TerHaar (1978) is used to calculate values, a point of departure of 29 ppm for a 6-h exposure would be chosen on the basis of no mortality, although severe irritation was present. Time scaling and applying the uncertainty factors described above yields higher AEGL values of 3.5 ppm for the 10- and 30-min durations, 1.7 ppm for 1h, 0.44 ppm for 4 h, and 0.22 ppm for 8 h. | ||||
APPENDIX C
CATEGORY PLOT FOR METHANESULFONYL CHLORIDE

FIGURE C-1 Category plot of animal data and AEGL values for methanesulfonyl chloride.
TABLE C-1 Data Used in the Category Plot for Methanesulfonyl Chloride
| Source | Species | Sex | No. Exposures | ppm | Minutes | Category | Comments |
| NAC/AEGL-1 | NR | 10 | AEGL | ||||
| NAC/AEGL-1 | NR | 30 | AEGL | ||||
| NAC/AEGL-1 | NR | 60 | AEGL | ||||
| NAC/AEGL-1 | NR | 240 | AEGL | ||||
| NAC/AEGL-1 | NR | 480 | AEGL | ||||
| NAC/AEGL-2 | 0.40 | 10 | AEGL | ||||
| NAC/AEGL-2 | 0.40 | 30 | AEGL | ||||
| NAC/AEGL-2 | 0.21 | 60 | AEGL | ||||
| NAC/AEGL-2 | 0.053 | 240 | AEGL | ||||
| NAC/AEGL-2 | 0.026 | 480 | AEGL | ||||
| Source | Species | Sex | No. Exposures | ppm | Minutes | Category | Comments |
| NAC/AEGL-3 | 1.2 | 10 | AEGL | ||||
| NAC/AEGL-3 | 1.2 | 30 | AEGL | ||||
| NAC/AEGL-3 | 0.62 | 60 | AEGL | ||||
| NAC/AEGL-3 | 0.16 | 240 | AEGL | ||||
| NAC/AEGL-3 | 0.078 | 480 | AEGL | ||||
| Pemiwalt Coiporation 1987 | Rat | Both | 1 | 20 | 240 | SL | Mortality (1/10); clinical signs, pulmonary function changes for several days; relative lung weight increase in decedents: damase to corneal surface of eyes |
| Rat | Both | 1 | 28 | 240 | SL | Mortality (9/10) | |
| Rat | Both | 1 | 54 | 240 | 3 | Mortality (10/10) | |
| Pemiwalt Coiporation 19S6 | Rat | Both | 1 | 165 | 60 | SL | Mortality (1/10); secretory and pulmonary effects through days 4–5: corneal uresulanties (3/9 survivors) |
| Rat | Both | 1 | 174 | 60 | SL | Mortality (2/10); secretory and pulmonary effects through days 4–5: corneal uresulanties (8/8 survivors) | |
| Rat | Both | 1 | 300 | 60 | 3 | Mortality (10/10); | |
| TerHaar 1978 | Rat | 1 | 2,145 | 45 | 3 | Mortality (3/3) | |
| Rat | 1 | 29 | 360 | 1 | Blinkius. nose rubbing, piloerectiou, vasodilation (3 exposed rats) | ||
| Rat | 1 | 132 | 360 | 3 | Mortality (3/3) | ||
For category: 0 = no effect, 1 = discomfort, 2 = disabling, 3 = lethal; SL = some lethality.
APPENDIX D
BENCHMARK DOSE CALCULATIONS FOR METHANESULFONYL CHLORIDE
Probit Model (Version: 2.8; Date: 02/20/2007)
Input Data File: C:\BMDS\UNSAVED1.(d)
Gnuplot Plotting File: C:\BMDS\UNSAVED1.plt
Wed Jul 11 10:33:08 2007
BMDS MODEL RUN - 4-hour study
![]()
The form of the probability function is:
P[response] = Background
+ (1-Background) * CumNorm(Intercept+Slope*Log(Dose)), where CumNorm(.) is the cumulative normal distribution function
Dependent variable = COLUMN3
Independent variable = COLUMN1
Slope parameter is not restricted
Total number of observations = 4
Total number of records with missing values = 0
Maximum number of iterations = 250
Relative Function Convergence has been set to: 1e-008
Parameter Convergence has been set to: 1e-008
User has chosen the log transformed model
Default Initial (and Specified) Parameter Values
Background = 0
Intercept = -8.60752
Slope = 2.6668
Asymptotic Correlation Matrix of Parameter Estimates
|
Background |
Intercept |
|
|
Background |
1 |
-1 |
|
Intercept |
-1 |
1 |
(***The model parameter(s) -background have been estimated at a boundary point, or have been specified by the user, and do not appear in the correlation matrix)
Analysis of Deviance Table
| Model | Log (likelihood) | No. Parameters | Deviance Test | DF | P-value |
| Full model | −6.50166 | 4 | |||
| Fitted model | −6.50166 | 2 | 3.41848e-009 | 2 | 1 |
| Reduced model | −27.7259 | 1 | 42.4485 | 3 | <0.0001 |
AIC: 17.0033
Parameter Estimates
| 95.0% Wald Confidence Interval | ||||
| Variable | Estimate | Standard Error | Lower Confidence Limit | Upper Confidence Limit |
| Background | 0 | NA | ||
| Intercept | −24.1018 | 7.1988 | −38.2112 | −9.99242 |
| Slope | 7.61759 | 2.27204 | 3.16448 | 12.0707 |
NA: indicates that this parameter has hit a bound implied by some inequality constraint and thus has no standard error.
Goodness of Fit
| Scaled | |||||
| Dose | Estimated probability | Expected | Observed | Size | Residual |
| 0.0000 | 0.0000 | 0.000 | 0 | 10 | 0.000 |
| 20.0000 | 0.1000 | 1.000 | 1 | 10 | −0.000 |
| 28.0000 | 0.9000 | 9.000 | 9 | 10 | −0.000 |
| 54.0000 | 1.0000 | 10.000 | 10 | 10 | 0.000 |
Chi-square = 0.00; DF = 2; P-value = 1.0000
Benchmark Dose Computation
Specified effect = 0.05
Risk Type = Extra risk
Confidence level = 0.95
BMD = 19.0685
BMDL = 15.5113
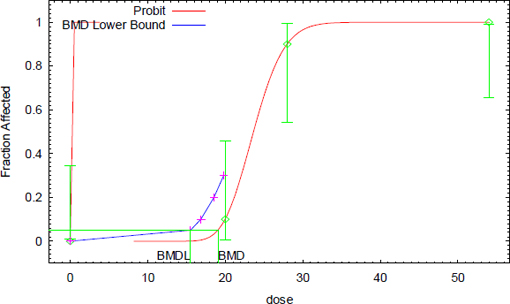
FIGURE B-1 Probit model with 0.95 confidence level.
APPENDIX E
CALCULATION OF THE TIME-SCALING EXPONENT ‘n’
Log Probit Analysis of Full Dataset:
Filename: Methanesulfonyl chloride time scaling
Date: 09 February 2012 Time: 16:05:18
| Sequence No. | Concentration (ppm) | Minutes | Exposed | Responded |
| 1 | 165 | 60 | 10 | 1 |
| 2 | 174 | 60 | 10 | 2 |
| 3 | 300 | 60 | 10 | 10 |
| 4 | 20 | 240 | 10 | 1 |
| 5 | 28 | 240 | 10 | 9 |
| 6 | 54 | 240 | 10 | 10 |
| 7 | 29 | 360 | 3 | 0 |
| 8 | 132 | 360 | 3 | 3 |
Used Probit Equation Y = B0 + B1*X1 + B2*X2
X1 = conc mg/m3, ln-transformed
X2 = minutes, ln-transformed
Chi-square = 48.83
Degrees of freedom = 5
Probability Model = 2.40E-09
Ln(Likelihood) = -20.30
B 0 = -2.3058E+01 Student t = -1.1494
B 1 = 2.5164E+00 Student t = 1.3933
B 2 = 3.5681E+00 Student t = 1.3718
Variance B 0 0 = 4.0242E+02
Covariance B 0 1 = -3.5556E+01
Covariance B 0 2 = -5.1770E+01
Variance B 1 1 = 3.2617E+00
Covariance B 1 2 = 4.4695E+00
Variance B 2 2 = 6.7650E+00
Estimation ratio between regression coefficients of ln(conc) and ln(minutes)
Point estimate = 0.705
Lower limit (95% CL) = 0.296
Upper limit (95% CL) = 1.114
Log Probit Analysis of Reduced Dataset:
Filename: Methanesulfonyl chloride time scaling
Date: 09 February 2012 Time: 16:07:06
| Sequence No. | Concentration (ppm) | Minutes | Exposed | Responded |
| 1 | 165 | 60 | 10 | 1 |
| 2 | 174 | 60 | 10 | 2 |
| 3 | 300 | 60 | 10 | 10 |
| 4 | 20 | 240 | 10 | 1 |
| 5 | 28 | 240 | 10 | 9 |
| 6 | 54 | 240 | 10 | 10 |
Used Probit Equation Y = B0 + B1*X1 + B2*X2
X1 = conc mg/m3, ln-transformed
X2 = minutes, ln-transformed
Chi-square = 0.01
Degrees of freedom = 3
Probability Model = 1.00E+00
Ln(Likelihood) = -4.05
B 0 = -8.3259E+01 Student t = -3.5083
B 1 = 7.6810E+00 Student t = 3.5633
B 2 = 1.1669E+01 Student t = 3.7691
Variance B 0 0 = 5.6320E+02
Covariance B 0 1 = -5.1013E+01
Covariance B 0 2 = -7.3391E+01
Variance B 1 1 = 4.6466E+00
Covariance B 1 2 = 6.6254E+00
Variance B 2 2 = 9.5856E+00
Estimation ratio between regression coefficients of ln(conc) and ln(minutes)
Point estimate = 0.658
Lower limit (95% CL) = 0.611
Upper limit (95% CL) = 0.705


