Under the Influence?: Drugs and the American Work Force (1994)
Chapter: I Scope Of Alcohol and Other Drug Use
2
Etiology of Alcohol and Other Drug Use: An Overview of Potential Causes
The underlying causes of alcohol and other drug use and abuse are many, varied, and not well understood. Hundreds of variables have been studied as potential predictors of the onset of alcohol and other drug use. While most alcohol and other drug use initiation occurs with friends or peers who are also using drugs, the stage for this event has been set much earlier by parents, the community, and society.
OVERVIEW
This chapter provides some insight into the causes of alcohol and other drug use and proceeds to focus on the potentially different causes of off-and on-the-job alcohol and other drug use. Finally, it examines the potential influence of environmental factors on workers' alcohol and other drug use.
The individual and social influences that have been investigated can be classified into four categories: (1) the cultural/societal environment, (2) the immediate community, (3) interpersonal forces such as school, peers, and family, and (4) individual factors, including genetics, personality, and attitudes. An individual can be considered ''at risk" because of factors or forces within each of these areas. Considerable theoretical and empirical attention has been devoted to each of these possible influences (e.g., Glantz and Pickens, 1992; Galizio and Maisto, 1985; Lettieri, 1985; Lettieri et al., 1980). Hawkins et al. (1992) reviewed the possible risk factors for youth-
TABLE 2.1 Summary of Risk Factors for Drug Use
Domain | Risk Factor |
Culture and Society | Laws favorable to drug use Social norms favorable to drug use Availability of drugs Extreme economic deprivations Neighborhood disorganization |
Interpersonal | Family use Positive family attitudes toward drug use Poor/inconsistent family management practices Family conflict and disruption Peer rejection Association with drug-using peers |
Psychobehavioral | Early/persistent problem behavior Academic failure Low commitment to school Alienation Rebelliousness Favorable attitudes toward drug use Early onset of drug use |
Biogenetics | Inherited susceptibility to drug use Psychophysiological vulnerability to drug effects |
SOURCE: Adapted from Hawkins et al. (1992). | |
ful alcohol and other drug use and identified 20 potential causes reflecting the 4 general areas listed above (see Table 2.1). Cultural/societal factors include laws and norms favorable to drug use, the availability of drugs, extreme economic deprivation, and neighborhood disorganization. Interpersonal factors include family alcohol and drug use behavior and attitudes, poor and inconsistent family management practices, family conflict, peer rejection in elementary grades, and association with drug-using peers. Psychobehavioral influences include early and persistent problem behaviors, academic failure, a low degree of commitment to school, alienation and rebelliousness, attitudes favorable to drug use, and early onset of drug use. And biogenetic factors include the possible heritability of a vulnerability to drug abuse and a psychophysiological susceptibility to the effects of drugs. In a comprehensive review of the "risk factor" literature, Clayton (1992) provides a tabulation of the primary topologies and concludes that there is an emergent consensus on the most important risk factors for drug use and abuse.
Within the behavioral sciences it is often stated that the best predictor of future behavior is past behavior. The study of alcohol and other drug use behavior is no exception to this rule. For any given individual, the strongest predictor of current use is past use. Other potential predictors are relatively more important in predicting the initiation of use or the progression of alcohol and other drug abuse. If, however, the question is whether a particular individual is likely to use or abuse drugs in the future, the individual's past history of use and abuse will tell us more about future prospects than the incremental contributions of other variables related to alcohol and other drug use.
The risk for initiating alcohol and other drug use increases for most drugs to a peak during mid-to late adolescence and decreases thereafter (Kandel and Logan, 1984). Tobacco has the youngest age of highest vulnerability, usually in early adolescence. Increased likelihood for beginning alcohol, marijuana, and psychedelics typically occurs in mid-adolescence. Interestingly, the most hazardous age for experimenting with cocaine has typically been young adulthood—about the mid-twenties; however, this pattern for cocaine may be changing due to the emergence of crack, the inexpensive and smokable form of cocaine, which may be more available and alluring to teenagers.
Some types of alcohol and other drug abuse appear to have a genetic component (Cadoret, 1992; Merikangas et al., 1992; Vaillant and Milofsky, 1982), although environmental, social, and psychological factors have received primary attention as causes of the initiation of alcohol and other drug use and progression to abuse (e.g., Sadava, 1987; Zucker and Gomberg, 1986). Attention to the latter factors is appropriate, for biogenetic influences are shaped and modified by personal attributes and environmental conditions (e.g., Marlatt et al., 1988). An important question concerns what precisely is inherited if there is a genetic influence for alcoholism or other drug abuse. Research evidence, primarily but not exclusively based on animal models, suggests at least two mechanisms (e.g., Bardo and Risner, 1985). Those at genetic risk for alcohol and other drug abuse may inherit a biological vulnerability to the hedonic effects of the drug, so for them drug effects are more attractive than for others. They may also not experience the withdrawal effects as severely as those not at risk (i.e., less likelihood of hangover). However, these proposed mechanisms and perhaps others (e.g., inherited behavioral traits; Tarter, 1988) must be evaluated more conclusively in further research (Schuckit, 1987).
Some have suggested that involvement with alcohol and other drugs progresses in a fixed sequence, moving from licit drugs to illicit substances (e.g., Kandel, 1975; Kandel and Faust, 1975). An individual's drug-using career might start with beer, wine, or cigarettes, move to hard liquor, then to marijuana, and subsequently to other illicit drugs, such as amphetamines,
cocaine, and heroin. Desistance may occur at any point (O'Donnell and Clayton, 1982), meaning that involvement at one stage does not necessarily lead to involvement at the next stage, but rather that involvement at the next stage is unlikely without prior involvement in the previous stage. Results in various cross-sectional and longitudinal studies have generally confirmed the stage hypothesis with some variations (e.g., Hays et al., 1987; Mills and Noyes, 1984; Newcomb and Bentler, 1986a). Donovan and Jessor (1983), for example, found that problem drinking occurred higher in the progression than general alcohol use, and Newcomb and Bentler (1986a) found that, when the role of cigarettes and nonprescription medications was included, several mini-sequences accounted for drug involvement from early adolescence to young adulthood.
Social factors that determine the availability and the attractiveness of alcohol and other drugs to particular individuals are important to this progression, and highly addictive drugs, such as crack cocaine, may alter this sequence of drug progression. Thus it may be that the severe addictive potential and wide and inexpensive availability of crack may lead to its being used earlier in the sequence than other less addictive illicit drugs or even licit drugs. There are, however, few data currently available to test this notion. The mechanism that drives staging, such as availability, anxiety reduction, peer groups norms, and physiological vulnerability, are not known, but these factors may not be the same at all stages. Peer group norms, for example, might be of vital importance to initiation, while individual psychopathology may figure more in shifts toward the end of the involvement sequence.
Some research suggests that the reasons people begin using alcohol and other drugs are different from the reasons they continue or escalate their use, which is to say, the factors that influence initiation are different from those that influence progression to more serious use. Several researchers have found that initiation is often strongly tied to social and peer influences, whereas biological and psychological processes appear to be associated with abuse (Carman, 1979; Kandel et al., 1978; Newcomb and Bentler, 1990; Paton et al., 1977). Even though data may as yet be too sparse to establish firmly that the causes of use are different from the causes of abuse, the evidence consistent with this hypothesis is accumulating (Glantz and Pickens, 1992).
A wide range of correlates with the initiation of alcohol and other drug use have been identified. They tend to overlap substantially with predictors of general problem behavior or deviance, which is not surprising given the correlation of other problem behaviors with alcohol and other drug use. The primary mechanism for establishing unique predictors of alcohol and other drug use has been longitudinal studies, controlling statistically for other deviant behaviors and attitudes using structural equation modeling
methods (Bentler, 1980; Newcomb, 1990). These studies suggest that peer influences (such as modeling use, providing drugs, and encouraging use) are the most consistent and strongest predictors. In addition to the role of prior behavioral experience with alcohol and other drugs and peer influences, other factors associated with initial involvement with drugs include social structural variables, such as socioeconomic status (with heavier use among more disadvantaged groups), family role and socialization variables (with greater use in families with adult drug users, dysfunctional family structures), educational variables (with poor school attachment and performance associated with greater drug use), psychological variables (such as a high need for stimulation), attitudinal variables such as tolerance for deviance (with nontraditionalism associated with greater drug use), behavioral variables such as deviant behaviors and low law abidance (implying greater substance use), emotional variables (such as anxiety and need for excitement), psychopathology (with greater depression and antisocial personality related to higher drug use), temperament and exposure to stressful life events (see Hawkins et al., 1992; Clayton, 1992).
While influences like these have been related to involvement with alcohol and other drug use or abuse, none has ever been found to be a single primary factor that causes alcohol and other drug use or abuse. Indeed, it seems highly unlikely that any one factor or even a few factors will ever be found to account fully for all variations in drug involvement. Because the range of variables leading to initial involvement in alcohol and other drug use is so large, recent views of this phenomenon have emphasized the risk factor notion that is often used in medical epidemiology (Bry et al., 1982; Schreier and Newcomb, 1991a,b). Risk factors include environmental, behavioral, psychological, and social attributes.
Viewing alcohol and other drug involvement as multiply determined suggests that the more risk factors someone is exposed to that encourage use, the more likely he or she is to use or abuse alcohol and other drugs. Exposure to a greater numbers of risk factors is not only a reliable correlate of use, but it also influences the increase in alcohol and other drug use over time, implying a true causal role for those variables that together make for increased risk (Schreier and Newcomb, 1991b). It appears from this approach that the presence of particular factors that can encourage drug use are not as important as the accumulation and interaction of such factors in a person's life.
Protective factors, in contrast to risk factors for alcohol and other drug use, reduce the likelihood and level of drug use and abuse. Protective factors are those psychosocial influences that limit or reduce drug involvement (Newcomb, 1992). Only recently has the risk factors approach to drug use and abuse been expanded to test for multiple protective factors as well (Newcomb, 1992; Newcomb and Felix-Ortiz, 1992). Protective factors may
operate through mechanisms other than simply by a direct reduction of alcohol and drug involvement. For example, protective factors have been shown to buffer or moderate the association between risk factors and drug use and abuse (Brook et al., 1992). Recent examples of protective factors that have been found to mitigate the risk of alcohol and other drug use or abuse involve aspects of the environment (e.g., maternal affection—Brook et al., 1989) and the individual (e.g., introversion or self-acceptance—Stacy et al., 1992).
ALCOHOL AND OTHER DRUG USE ON THE JOB
As we discussed in Chapter 1, the definition of terms can significantly shape the problem under study. More specifically, with respect to on-the-job versus off-the-job drug use, Chapter 1 indicates the importance of such a distinction in the study of alcohol and other drug use by the work force. The term on-the-job drug use is ambiguous and can mean different things in different studies. Taken literally, the phrase refers only to drugs used at the work site while work is or should be going on. By this definition, a three-martini lunch or a two-joint break would not be considered drug use on the job. Yet many drugs affect work performance for hours, if not days, after consumption. Several self-report measures of workplace drug use ask respondents whether they have used a particular drug on the job. It is unclear whether employees interpret this question to include alcohol and other drugs used just before work, during breaks, or at lunch. Alcohol and other drugs used at these times could lead to workplace impairment even though they do not involve "drug use on the job" if the term is taken literally. The more relevant question might be whether employees have ever been drunk, high, or stoned at work, but this is rarely asked. It is well known that small differences in question wording or even question order can affect survey responses, and attention should be paid to this dynamic in future surveys of workplace drug use.
Patterns of Alcohol and Other Drug Use on the Job
Employers have often been plagued by the occasional alcoholic employee who is frequently absent or tardy or may drink or be drunk on the job. Some employers believe that such behavior is increasing and extends to drugs other than alcohol. However, no large-scale surveys of adult workers exist to substantiate such conclusions.
Alcohol is believed to be the most frequently used drug in the workplace (apart from nicotine and caffeine), but precise comparisons with other drugs and evaluations of their relationship to alcohol cannot be made (Cohen, 1984, 1986). The few surveys that attempt to assess the prevalence of
alcohol and other drug use in the work site typically report estimates from management or union sources rather than from employees (e.g., Schreier, 1987; Steele, 1981). Such surveys report the perceptions of knowledgeable observers who are close to the problem, but as a measure of actual alcohol and other drug use they are obviously flawed.
Nevertheless, as discussed in more detail in Chapter 3, a few studies designed specifically to estimate rates of alcohol and other drug use on the job provide tentative estimates of work force alcohol and other drug use. Those studies vary greatly in terms of methods used to assess alcohol and other drug use and when similar methods are used, they often define their measures of alcohol and other drug use differently (e.g., on-the-job drug use).
Although these studies do not provide precise estimates of the rate of alcohol and other drug use by the work force, they do, however, provide information concerning which members of the work force are more likely to use drugs and what drugs are most likely to be used. Rates of self-reported alcohol and other drug use on the job vary according to occupation, age, gender, and ethnicity. Excluding tobacco and caffeine, most surveys find that fewer than 10 percent of workers report having used alcohol or other drugs while on the job during the prior year. Some studies, however, report significantly higher use rates. Much of the difference in the rates reported appears attributable to differences in samples surveyed and questions asked.
It appears that a sizable number of people use alcohol or other drugs regularly, but not at work; others use alcohol or other drugs both at work and away from work. Some use alcohol or other drugs only when they are away from the workplace, and others use alcohol or other drugs only when they are at work. There may also be a group of individuals who use one drug at work and other drugs at home or away from the work site. Researchers have only begun to confront the degree of correspondence between a general proclivity to use alcohol and other drugs and the use of alcohol or other drugs on the job. Often implicit is the yet unproven assumption that the association is quite high, if not perfect. For instance, many discussions of on-the-job drug use cite statistics of general drug use of various populations and argue that alcohol and other drug use in the workplace must be rampant (e.g., Backer, 1987). Since people can choose where to use alcohol and other drugs and what drugs to use, heavy off-the-job use of specific drugs does not mean that those drugs will be used at work. The "weekend drunk" is an example. It is, however, reasonable to assume that at least some general drug use must precede on-the-job use for most people.
Newcomb (1988) found that alcohol and other drug use at work and general alcohol and other drug use were highly, but not perfectly, related (i.e., high general use of drugs did not mean drugs would necessarily be used in the workplace, but the two were clearly associated). In most cases,
knowing the extent of general alcohol and other drug use among a sample of individuals predicted less than 50 percent of the variance of on-the-job alcohol and other drug use. Thus the propensity to use alcohol and other drugs on the job varied with the degree of off-the-job alcohol and other drug involvement, but the relationship was not so strong as to justify treating overall alcohol and other drug use prevalence rates as indicators of the likely extent of different types of drug use on the job.
The association that Newcomb found between the use of drugs at and away from work varied by drug combination. For instance, those who reported using marijuana off the job were twice as likely to use alcohol and seven time more likely to use cocaine on the job than those who did not report off-the-job marijuana use (Newcomb, 1988:72-73). Similarly, cigarette smokers were twice as likely to use alcohol on the job and over three times as likely to use marijuana, cocaine, or other hard drugs on the job, as those who did not smoke cigarettes.
Moreover, previous research has revealed that a person's drug use is typically not limited to one specific substance, but often involves the use of various drugs, sometimes more or less simultaneously. This is particularly true for teenagers and for those who use illicit drugs (i.e., marijuana, cocaine), but it has been documented among young adults (Newcomb and Bentler, 1998a,b) and adults (Newcomb, 1992) as well. Clayton and Ritter (1985:83), after examining many studies, concluded that "more often than not, the persons who are using drugs frequently are multiple drug users." Cocaine users, for example, reported significantly higher rates of use for all other types of drugs, including cigarettes, alcohol, marijuana, over-the-counter medications, hypnotics, stimulants, psychedelics, inhalants, narcotics, and PCP, compared with those who had never used cocaine. These large differences were found for both men and women and were prevalent during adolescence as well as young adulthood (e.g., Newcomb and Bentler, 1986b). The association between various types of drug use is so high that common underlying constructs of general polydrug use (Newcomb and Bentler, 1986b) and polydrug use in the workplace (Newcomb, 1988; Stein et al., 1988) have been distinctly and reliably identified.
In an extensive series of analyses of alcohol and other drug use, one of the overriding conclusions reached by Newcomb (1988) was that alcohol and other drug use in the workplace was not typically restricted to single drugs but was highly related to the use of other drugs of both similar and different types. Thus someone caught using marijuana at work is more likely than a random worker to have also used alcohol on the job and far more likely to have used harder drugs. Indeed, Newcomb's study suggests that substance use in the workplace is best characterized as polydrug use at work. The use of one substance at work increases the likelihood of using other drugs in that context.
As we already noted, it appears that alcohol and other drug involvement progresses by stages (Kandel, 1975; Kandel and Faust, 1975). Newcomb (1988) reports data suggesting that using alcohol and other drugs at work reflects a relatively high level of drug involvement. Newcomb's data indicate that using drugs at work is located after both alcohol and marijuana use on the drug involvement continuum for men and subsequent to cocaine use for women. Thus it appears that workplace alcohol and other drug use implies a degree of drug involvement somewhere between that implied by marijuana and cocaine use, on one hand, and cocaine and harder drug use, on the other. The different scaling results for men and women suggest that using alcohol and other drugs at work occurs earlier in the sequence of drug involvement for men than women. This may help explain the gender differences in the prevalence of alcohol and other drug use in the workplace that is reported in Chapter 3. The polydrug use concept is consistent with the view of drug involvement as a staged process defined in large measure by the types of drugs used (e.g., Newcomb and Bentler, 1986b). Those who have tried drugs high in the progression of drug involvement may also continue to use the drugs that do not by themselves characterize high involvement. Indeed, a more elaborate stage model might identify certain configurations of polydrug use as separate stages in the progression of drug involvement.
Predictors of Alcohol and Other Drug Use on the Job
Evidence of social-environmental influences on drug use have led many to believe that job conditions constitute important risk or protective factors with respect to alcohol and other drug use. Among the characteristics of the work environment that have been posited to influence employee alcohol and other drug use are organizational frustration and job stress (Milbourn, 1984), distancing forces, attractions, and constraints (Gupta and Jenkins, 1984), occupational and coworker norms (Shore, 1986), and alcohol and other drug use "enabling" aspects of the work environment (Ames, 1990; Roman et al., 1992).
In empirical tests of these expectations, the primary focus has been on correlates with alcohol and other drug use in general and not specifically with alcohol and other drug use on the job. Markowitz (1984), for example, found that indicators of general alcohol misuse were significantly correlated with less responsibility and autonomy in the workplace. Martin et al. (1992) found that some form of alcohol use was significantly associated with more pressure and fewer extrinsic rewards, although demographic factors (divorced and urban residence) were far more important than these job characteristics.
A few studies have directly examined the relationship of job character-
istics as they relate to actual alcohol and other drug use on the job. Lehman and Simpson (1992) found that alcohol and other drug use at work was directly correlated with male gender, depression, not working in an office, job dissatisfaction, job tension, accidents, and absences; it was inversely correlated with age, education, faith in management, job involvement, and organizational commitment. Some of these correlations appear to be causally related to alcohol and other drug use (e.g., age); others are the likely results of use (e.g., accidents); and for still others the relationship is likely to be bidirectional (e.g., organizational involvement). In a different analysis of this data set, Lehman et al. (1991) found seven significant predictors of alcohol and other drug use at work: (1) not being married, (2) having been arrested, (3) low self-esteem, (4) high peer drug use, (5) working alone or in a small group, (6) having a high-risk job, and (7) low job involvement.
Mensch and Kandel (1988) examined various job dimensions as possible correlates of on-the-job marijuana use for men and women. They found eight small, but significant correlates of using marijuana at work among men: (1) low skill discretion, (2) low decision authority, (3) high job insecurity, (4) low supervisor support, (5) high physical demands, (6) high hazardous exposure, (7) low substantive complexity, and (8) high motor skills. Among women, marijuana use on the job was significantly correlated with five job characteristics: (1) low skill discretion, (2) low decision authority, (3) high coworker support, (4) low substantive complexity, and (5) high physical demands.
Mangione and Quinn (1975) examined relationships between alcohol and other drug use on the job and job satisfaction among men and women above and below age 30. There were no significant correlations between alcohol and other drug use in the workplace and job satisfaction for either group of women. The only significant correlation was found for men 30 years or older—but it was small (r = –.12).
Using ethnographic methods, Ames (1990) found that certain aspects of the work environment, as well as ambiguous or conflicting responsibilities of supervisors, encouraged drinking on the job. They characterized these aspects of the working environment as enabling influences for on-the-job alcohol use.
Newcomb (1988) has presented a comprehensive set of both cross-sectional and prospective survey findings on the correlates and predictors of alcohol and other drug use in the workplace. He examined many personal, social, and work-related factors in terms of their associations with using alcohol and other drugs on the job. Demographically, Newcomb found that those most likely to use alcohol and other drugs in the workplace were male, either black (for use of marijuana) or white (for use of other drugs), had few educational plans, had cohabited sometime in their life, had no
children, and were not currently married. Higher income was related to greater use of cocaine and harder drugs. A wide range of personality, emotional functioning, social support, and problem variables were examined as possible correlates of alcohol and other drug use in the workplace. Several small, but significant, effects were found. Using alcohol or other drugs at work was slightly but significantly related to relationship and family problems and emotional distress. Alcohol and other drug use at work was most highly related to having drug and alcohol problems, being low in law abidance, being liberal, feeling powerless, and lacking fear of injury. In other words, alcohol and other drug use in the workplace typically does not appear to result from life problems or general unhappiness (although a few small associations in these variables were found). It was most related to general nonconformity, low fearfulness, having some trouble with an intimate relationship, off-the-job drug or alcohol problems, and feeling powerless.
Workplace alcohol and other drug use was not highly related to such work-related variables as income, collecting public assistance, hours worked, and support for work problems. It was most strongly related to job instability (frequently being fired), committing vandalism at work, and somewhat less strongly to job dissatisfaction. Alcohol and other drug use in the workplace was only slightly but significantly related to problems and unhappiness in the workplace.
To summarize, Newcomb's studies indicate that alcohol and other drug use in the workplace appears to be more a function of the personal qualities of individuals, rather than functions of their work environments. Alcohol and other drug use on the job is strongly related to such personality characteristics as rebelliousness, nonconformity, deviance, and perhaps acting out; the prospective studies reveal that people with such traits are more likely than others to use alcohol and other drugs at work at later points in time. Based on Newcomb's studies, it appears that alcohol and other drug use on the job is neither largely nor generally situationally determined, but is a manifestation of a general syndrome of problem behaviors, both related to and separate from alcohol and other drug use. But some of the other studies reviewed by the committee do show small but not always consistent workplace environment effects.
Several reviews of the literature reach conclusions similar to those of Newcomb. For instance, Harris and Heft (1992:241) concluded that ''though statistically significant in some cases, the relationship between work conditions and drug/alcohol consumption appears to be quite small." Over a decade earlier, Herold and Conlon (1981:337) reached the same conclusion regarding the association between work factors and alcohol abuse, stating that "unequivocal evidence of such linkages is scarce."
There are, however, problems with this general conclusion, which mean that the work environment cannot be ruled out as a contributing or interac-
tive factor for generating alcohol and other drug use among workers or protecting them from it. All the studies that find that personality variables dwarf work environment variables are biased by an imbalance in the use of individual and job condition and attitude measures. Some studies measure many individual traits but have relatively few measures of job conditions; in a few others, the imbalance is reversed. One might expect that the more variables used to measure a domain, the greater the amount of variance attributable to a domain and the more likely some significant relationships will be revealed. These complexities are confounded by the fact that no existing study has been designed to test directly and explicitly whether alcohol and other drug use on the job is associated more or less with personal qualities (i.e., traits) or job characteristics (e.g., role ambiguity, stress, shift work) when appropriate and thorough measures of both domains have been gathered.
Moreover, most existing studies employ models that assume only direct or main effects of work environment on alcohol and other drug use. This perspective is too narrow. As several reviews have noted, the associations between work environment and on-or off-the-job alcohol and other drug use are likely to be far more complex (e.g., Martin et al., 1992). They may involve intervening variables (e.g., Violanti et al., 1983), generalization processes (e.g., Martin et al., 1992), influence by individual differences (Conway et al., 1981), as well as interactions or moderated relationships between personal characteristics and job conditions (e.g., Brief and Folger, 1992). For example, a poor work environment may lead to family stresses that promote alcohol and other drug use, or those with low self-esteem may be prone to use alcohol and other drugs on the job, but only on those jobs in which supervisors are authoritarian and seldom give positive feedback. Because of possibilities like these and the shortcomings of the extant research, we cannot conclude that the work environment does not affect worker alcohol and other drug use both on and off the job to an important extent. More comprehensive analyses and tests of more realistic theories are necessary to sort out the relative impact of work environment and individual traits on worker alcohol and other drug use and the ways in which variables in these domains relate to each other.
Nature Versus Nurture in Alcohol and Other Drug Use on the Job
Data on different levels of alcohol and other drug use across occupations that are discussed in Chapter 3 raise an important issue. that is, are these occupational differences explained in part by the social dynamics of particular occupations, or are they the result of the individual characteristics of those who gravitate toward certain occupations? Okinuora (1984) and
Plant (1981) identified several risk factors that were related to the connection between occupation and alcoholism. These included the availability of alcohol at work, social pressure to drink on the job, separation from normal social relationships, freedom from supervision, very high or very low income, collusion by colleagues, strains, stresses, and hazards, and self-selection for high-risk occupations.
The association between job type and alcohol or other drug use may be because those with a propensity to use drugs are attracted to particular positions/occupations (e.g., alcoholics may find brewery jobs enticing), because particular job conditions are conducive to drug use (e.g., brewery workers may find it hard to resist social pressures to drink), or to some combination of causal possibilities. Plant (1978, 1979) attempted to tease apart these possibilities by studying new recruits to the liquor or brewery trade (a very high-risk occupation) and comparing them with those applying for jobs at low risk for alcohol problems. He found that those who sought liquor and brewery jobs had poorer employment records and were heavier drinkers prior to their employment than were applicants to lower-risk occupations. This supports the self-selection hypothesis. He also found, however, that those in the liquor industry increased their drinking behavior (including on-the-job drinking) in conformity to perceived social norms. Thus it appears that self-selection and environmental pressures combine to account for the high rates of alcoholism that are found in the alcoholic beverage industry.
In a study of prevalence rates for lifetime cocaine use (Trinkoff et al., 1990) reported that among 6 job categories studied, the skilled labor category had the highest level of lifetime cocaine use (12 percent) followed by management professionals (8 percent), technical/sales/support (8 percent), service (7 percent), farm/forest/fishing (7 percent), and unskilled labor with the lowest rate of 6 percent. The authors point out that such rates were strongly related to education level and varied substantially across age groups with the highest reported rates observed among respondents below age 35. In another prevalence study Trinkoff et al. (1991) analyzed a different subset of data from the Epidemiologic Catchment Area Program to estimate rate of alcohol and other drug use among nurses and compared those rates to a matched control group of employed non-nurses. Their results showed that nurses were no more likely to have engaged in illicit drug use than non-nurses. However nurses were found to be less likely to have experienced problems with alcohol abuse than non-nurses. Unfortunately, prevalence estimates on specific drug types, other than alcohol, were unstable with large confidence intervals due to the missing data and the small size of the samples studied.
Cosper (1979) and Cosper and Hughes (1982) challenged the notion that occupations associated with heavy drinking are disproportionately char-
acterized by alcohol abuse or alcoholism. They suggested that the frequency, but not the quantity, of drinking is higher in certain occupations, and that the frequency of drinking may not reflect problem levels. They suggest that conformity to the unique norms of an occupation may generate differences in drinking behavior and thus may not indicate deviance or low social conformity. Although this may be true in certain jobs (they studied naval officers and journalists), it does not account for the differential treatment rates for alcohol and other drugs nor for mortality differences observed in other studies.
Alcohol and Other Drug Use by Occupation and Context
Several recent studies have identified industries or job categories that have different risks for on-the-job alcohol and other drug use. Lehman et al. (1990) found the highest rates of alcohol and other drug use in the workplace for skilled, technical, paraprofessional, and service occupations (ranging from 3 to 4 percent) and the lowest for professional and clerical positions (from 0 to 1 percent). Mensch and Kandel (1988), in exploring similar occupations, found interactions between job sector, drug type, and gender. Among men, the recreation, entertainment, and construction industries were associated with the highest rates of alcohol, marijuana, and cocaine use on the job. Among women, alcohol use at work was most likely in the agriculture, forestry, and fishery industries; marijuana use on the job most often occurred in construction jobs, and cocaine was most prevalent on the job in the transportation sector. Gleason et al. (1991) found that the highest prevalence rates of drug use on the job were in the construction and entertainment/recreation industries, whereas the lowest rates were found in the professional services and public administration industries.
Results from the High School Senior survey presented in detail in Chapter 3 indicate that military and protective services occupational groups (e.g., police, fire fighters) had very low rates of use at work. Reported alcohol use at work (at least once in the previous 12 months) was highest for men in professional, skilled, and managerial or semiskilled jobs. Women were only slightly lower than men in their rate of using alcohol. The High School Senior follow-up survey revealed greater variation in marijuana use at work. Between 9 and 10 percent of skilled and semiskilled male workers had smoked marijuana at work, compared with less than 5 percent in any of the other gender-occupation categories. Skilled and semiskilled male workers were also more likely to report having used cocaine at work; 2 to 4 percent said they had done so. The situation was different for the nonmedical use of psychotherapeutic drugs. Amphetamine use was highest among female skilled workers, with prevalence rates of 4 percent, while male and female semiskilled workers and men in the military had rates of around 3
percent. About 3 percent of female skilled workers had taken tranquilizers at work; no other group much exceeded 1 percent.
CONCLUSIONS AND RECOMMENDATIONS
The most vulnerable age and primary risk factors associated with drug use initiation typically precede an individual's entry into the work force. This fact has important implications for work-related prevention interventions designed to prevent the onset of drug use. This means that workplace interventions may have only limited effects on preventing initiation into most categories of drug use.
Most alcohol and other drug users do not develop patterns of clinically defined abuse or dependence. The progression from use to abuse and dependence varies with drug type as well as with factors that are specific to individuals and their environments. It is not possible, however, to predict with great accuracy which alcohol and other drug users will become abusers or will eventually need treatment.
If use and abuse have different causes, it follows that they are likely to benefit from different types of interventions, so it is important to further explore the hypothesis that any type of drug or alcohol use at the work site in fact reflects abuse.
Among illicit drug users, polydrug use, most often including the use of alcohol and tobacco, is the norm rather than the exception.
Recommendation: In evaluating the impact of alcohol and other drug use on behavior, specific attention should be paid to the actions of drugs in combination.
• Based on the sparse empirical evidence accumulated to date, alcohol and other drug use by the work force appears to be more a function of the personal qualities of individuals than of their work environments. However, most studies of why workers use alcohol and other drugs have serious methodological flaws. Hence, the work environment cannot be ruled out as a contributing or interactive factor in generating use among workers or protecting them from it.
Recommendation: Research is still needed to sort out the relative impact of the work environment and individual traits on workers' alcohol and other drug use. This research should test realistic theories involving such potential critical variables such as drug availability, local norms, and work stress and attending to such complexities as interaction effects can reverse causation.
REFERENCES
Ames, G.M. 1990 The workplace as an enabling environment for alcohol problems. Anthropology of Work Review 11:12-16.
Backer, T. E. 1987 Strategic Planning for Workplace Drug Abuse Problems. Rockville, Md.: National Institute on Drug Abuse.
Bardo, M.T., and M.E. Risner 1985 Biochemical substrates of drug abuse. Pp. 65-99 in M. Galizio and S.A. Maisto, eds., Determinants of Substance Abuse: Biological, Psychological, and Environmental Factors. New York: Plenum Press.
Bentler, P.M. 1980 Multivariate analysis with latent variables: Causal modeling. Annual Review of Psychology 31:419-456.
Brief, A.P., and R.G. Folger 1992 The workplace and problem drinking as seen by two novices. Alcoholism: Clinical and Experimental Research 16:190-198.
Brook, J.S., C. Nomura, and P. Cohen 1989 Prenatal, perinatal, and early childhood risk factors and drug involvement in adolescence. Genetic, Social, and General Psychology Monographs 115:223-241.
Brook, J.S., P. Cohen, M. Whiteman, and A.S. Gordon 1992 Psychosocial risk factors in the transition from moderate to heavy use or abuse of drugs. Pp. 359-388 in M.D. Glantz and R. Pickens, eds., Vulnerability to Drug Abuse. Washington, D.C.: American Psychological Association.
Bry, B.H., P. McKeon, and R. Pandina 1982 Extent of drug use as a function of number of risk factors. Journal of Abnormal Psychology 91:273-279.
Cadoret, R.J. 1992 Genetic and environmental factors in initiation of drug use and the transition to abuse. Pp. 99-114 in M.D. Glantz and R. Pickens, eds., Vulnerability to Drug Abuse. Washington, D.C.: American Psychological Association .
Carman, R.S. 1979 Motivations for drug use and problematic outcomes among rural junior high school students. Addictive Behaviors 4:91-93.
Clayton, R.R. 1992 Transitions in drug use: risk and protective factors. Pp. 15-52 in M. Glantz and R. Pickens, eds., Vulnerability to Drug Abuse. Washington, D.C.: American Psychological Association.
Clayton, R.R., and C. Ritter 1985 The epidemiology of alcohol and drug abuse among adolescents. Advances in Alcohol and Substance Abuse 4:69-97.
Cohen, S. 1984 Drugs in the workplace. Journal of Clinical Psychiatry 45:4-8. 1986 Drug urinalysis: selected questions. Drug Abuse and Alcoholism Newsletter 15:10.
Conway, T.L., R.R. Vickers, H.W. Ward, and R.H. Rahe 1981 Occupational stress and variation in cigarette, coffee, and alcohol consumption. Journal of Health and Social Behavior 22:155-165.
Cosper, R. 1979 Drinking as conformity. Journal of Studies on Alcohol 40:868-891.
Cosper, R., and F. Hughes 1982 So-called heavy drinking occupations. Journal of Studies on Alcohol 43:110-118.
Donovan, J.E., and R. Jessor 1983 Problem drinking and the dimensions of involvement with drugs: a Guttman scalogram analysis of adolescent drug use. American Journal of Public Health 73:543-552.
Galizio, M., and S.A. Maisto, eds. 1985 Determinants of Substance Abuse: Biological, Psychological, and Environmental Factors. New York: Plenum Press.
Glantz, M.D., and R.W. Pickens 1992 Vulnerability to drug abuse: introduction and overview. Pp. 1-14 in M. Glantz and R. Pickens, eds., Vulnerability to Drug Abuse. Washington, D.C.: American Psychological Association.
Gleason, P.M., J.R. Veu, and M.R. Pergamit 1991 Drug and alcohol use at work: a survey of young workers. Monthly Labor Review August:3-7.
Gupta, N., and G.D. Jenkins, Jr. 1984 Substance use as an employee response to work environment. Journal of Vocational Behavior 24:84-93.
Harris, M.M., and L.L. Heft 1992 Alcohol and drug use in the workplace: issues, controversies, and directions for future research. Journal of Management 18:239-266.
Hawkins, J.D., R.F. Catalano, and J.Y. Miller 1992 Risk and protective factors for alcohol and other drug problems in adolescence and early adulthood: implications for substance abuse problems. Psychological Bulletin 112:64-105.
Hays, R.D., K.F. Widaman, M.R. DiMatteo, and A.W. Stacy 1987 Structural equation models of current drug use: are appropriate models so simple? Journal of Personality and Social Psychology 52:134-144.
Herold, D.M., and E.J. Conlon 1981 Work factors as potential causal agents of alcohol abuse. Journal of Drug Issues 11:337-356.
Kandel, D.B. 1975 Stages in adolescent involvement in drug use. Science 190:912-914.
Kandel, D.B., and R. Faust 1975 Sequence and stages in patterns of adolescent drug use. Archives of General Psychiatry 32:923-932.
Kandel, D.B., and J.A. Logan 1984 Patterns of drug use from adolescence to young adulthood: I: Periods of risk for initiation, continued use, and discontinuation. American Journal of Public Health 74:660-666.
Kandel, D.B., R.C. Kessler, and R.Z. Margulies 1978 Antecedents of adolescent initiation into stages of drug use: a developmental analysis . In D.B. Kandel, ed., Longitudinal Research on Drug Use: Empirical Findings and Methodological Issues. Washington, D.C.: Hemisphere.
Lehman, W.E.K., andD.D. Simpson 1992 Employee substance use and on-the-job behaviors. Journal of Applied Psychology 77:309-321.
Lehman, W.E.K., D.J. Farabee, M.L. Holcom, and D.D. Simpson 1991 Prediction of Substance Use in the Workplace: Unique Contributions of Demographic and Work Environment Variables. Unpublished manuscript, Institute of Behavioral Research, Texas Christian University, Fort Worth.
Lehman, W.E.K., M.L. Holcom, and D.D. Simpson 1990 Employee Health and Performance in the Workplace: A Survey of Municipal Employees
of a Large Southwest City. Unpublished manuscript, Institute of Behavioral Research, Texas Christian University, Fort Worth.
Lettieri, D.J. 1985 Drug abuse: a review of explanations and models of explanations. Advances in Alcohol and Substance Abuse 4:9-40.
Lettieri, D.J., M. Sayers, and H.W. Pearson, eds. 1980 Theories on Drug Abuse: Selected Contemporary Perspectives. Rockville, Md.: National Institute on Drug Abuse.
Mangione, T.W., and R.P. Quinn 1975 Short note: job satisfaction, counter-productive behavior, and drug use at work. Journal of Applied Psychology 60:114-116.
Markowitz, M. 1984 Alcohol misuse as a response to perceived powerlessness in the organization. Journal of Studies on Alcohol 45:225-227.
Marlatt, G.A., J.S. Baer, D.M. Donovan, and D.R. Kivlahan 1988 Addictive behaviors: etiology and treatment. Annual Review of Psychology 39:223-252.
Martin, J.K., T.C. Blum, and P.M. Roman 1992 Drinking to cope and self-medication: characteristics of jobs in relation to workers' drinking behavior. Journal of Organizational Behavior 13:55-71.
Mensch, B.S., and D.B. Kandel 1988 Do job conditions influence the use of drugs? Journal of Health and Social Behavior 29:169-184.
Merikangas, K.R., B.J. Rounsaville, and B.A. Prusoff 1992 Familial factors in vulnerability to substance abuse. Pp. 75-98 in M.D. Glantz and R. Pickens, eds., Vulnerability to Drug Abuse. Washington, D.C.: American Psychological Association.
Milbourn, G. 1984 Alcoholism, drug abuse, job stress: what small business can do. American Journal of Small Business 8:36-48.
Mills, C.J., and H.L. Noyes 1984 Patterns and correlates of initial and subsequent drug use among adolescents. Journal of Consulting and Clinical Psychology 52:231-243.
Newcomb, M.D. 1988 Drug Use in the Workplace: Risk Factors for Disruptive Substance Use Among Young Adults. Dover, Mass.: Auburn House. 1990 Losing the War on Drugs: Are We Too Addicted to the Quick Fix to Seek the Ultimate Fix. Paper presented to United States Congress sponsored by the Federation of Behavioral, Psychological, and Cognitive Sciences, Washington, D.C. 1992 Understanding the multidimensional nature of drug use and abuse: the role of consumption, risk factors, and protective factors. Pp. 255-297 in M.D. Glantz and R. Pickens, eds., Vulnerability to Drug Abuse. Washington, D.C.: American Psychological Association.
Newcomb, M.D., and P.M. Bentler 1986a Cocaine use among adolescents: longitudinal associations with social context, psychopathology, and use of other substances. Addictive Behaviors 11:263-273. 1986b Cocaine use among young adults. Advances in Alcohol and Substance Abuse 6:73-96. 1988a Consequences of Adolescent Drug Use: Impact on the Lives of Young Adults. Beverly Hills, Calif.: Sage Publications.
1988b Impact of adolescent drug use and social support on problems of young adults: a longitudinal study. Journal of Abnormal Psychology 97:64-75. 1990 Antecedents and consequences of cocaine use: an eight-year study from early adolescence to young adulthood. Pp. 158-181 in L. Robins, ed., Straight and Devious Pathways from Childhood to Adulthood. Cambridge, Mass.: Cambridge Press.
Newcomb, M.D., and M. Felix-Ortiz 1992 Multiple protective and risk factors for drug use and abuse: cross-sectional and prospective findings. Journal of Personality and Social Psychology 63:280-296.
O'Donnell, J.A., and R.R. Clayton 1982 The stepping-stone hypothesis: marijuana, heroin, and causality. Chemical Dependencies: Behavioral and Biomedical Issues 4:229-241.
Okinuora, M. 1984 Alcoholism and occupation. Scandinavian Journal of Work and Environmental Health 10:511-515.
Paton, S., R.C. Kessler, and D.B. Kandel 1977 Depressive mood and illegal drug use: a longitudinal analysis. Journal of Genetic Psychology 131:267-289.
Plant, M.A. 1978 Occupation and alcoholism: cause or effect? A controlled study of recruits to the drink trade. International Journal of the Addictions 13:605-626. 1979 Occupations, drinking patterns and alcohol-related problems: conclusions from a follow-up study. British Journal of Addiction 74:267-273. 1981 Risk factors in employment. In B.D. Hore and M.A. Plant eds., Alcohol Problems in Employment. London: Croom Helm.
Roman, P.M., T.C. Blum, and J.K. Martin 1992 Enabling of male problem drinkers in work groups. British Journal of Addiction 87:275-298.
Sadava, S.W. 1987 Interactional theories. In H.T. Blane and K.E. Leonard, eds., Psychological Theories of Drinking and Alcoholism. New York: Guilford.
Schreier, J.W. 1987 Substance Abuse in Organizations, 1971-1986: Realities, Trends, Reactions. Milwaukee, Wis.: Far Cliffs Consulting.
Schreier, L.M., and M.D. Newcomb 1991a Differentiation of early adolescent predictors of drug use versus abuse: a developmental risk factor model. Journal of Substance Abuse 3:277-299. 1991b Psychosocial predictors of drug use initiation and escalation: an expansion of the multiple risk factors hypothesis using longitudinal data. Contemporary Drug Problems 18:31-73.
Schuckit, M.A. 1987 Biological vulnerability to alcoholism. Journal of Consulting and Clinical Psychology 3:301-309.
Shore, E.R. 1986 Norms regarding drinking behavior in the business environment. Journal of Social Psychology 125:735-741.
Stacy, A.W., M.D. Newcomb, and P.M. Bentler 1992 Interactive and higher-order effects of social influences on drug use. Journal of Health and Social Behavior 33:226-241.
Steele, P.D. 1981 Labor perceptions of drug use and drug problems in the workplace. Journal of Drug Issues 11:279-292.
Stein, J. A., M.D. Newcomb, and P.M. Bentler 1988 Structure of drug use behaviors and consequences among young adults: multitrait-multimethod assessment of frequency, quantity, work site, and problem substance use. Journal of Applied Psychology 73:595-605.
Tarter, R.E. 1988 Are there inherited behavioral traits that predispose to substance abuse? Journal of Consulting and Clinical Psychology 56:189-196.
Trinkoff, A.M., C. Ritter, and J.C. Anthony 1990 The prevalence and self-reported consequences of cocaine use: an exploratory and descriptive analysis. Drug and Alcohol Dependence 26:217-225.
Trinkoff, A.M., W.W. Eaton, and J.C. Anthony 1991 The prevalence of substance abuse among registered nurses. Nursing Research 40(3):172-175.
Vaillant, G., and E. Milofsky 1982 The etiology of alcoholism: a prospective viewpoint. American Psychologist 37:494-503.
Violanti, J., J. Marshall, and B. Howe 1983 Police occupational demands, psychological distress and the coping function of alcohol. Journal of Occupational Medicine 25:455-458.
Zucker, R.A., and E.S.L. Gomberg 1986 Etiology of alcoholism reconsidered: the case for a biopsychosocial approach. American Psychologist 41:783-793.
3
Epidemiological Evidence: The Dimensions of the Problem
This chapter presents epidemiological evidence regarding drug use from a number of sources and different populations and discusses its implications for the workplace. The studies reviewed provide data on prevalence and trends in alcohol and other drug use by the U.S. work force, including use in general—for which there is considerable information—and use on the job—for which there is relatively little information.
There is a wide array of studies that examine the prevalence and impact of drug use in the workplace; some of the more recent work is summarized in two NIDA monographs, edited by Gust et al. (1990) and Gust and Walsh (1989). The most informative data come from four sources that are reviewed in this chapter: large-scale surveys conducted over the last two decades, large-scale drug testing among employed people, organization-specific studies, and other studies assessing on-the-job drug use.
Three large-scale survey series have closely examined issues that concern this study: the High School Senior surveys (HSS) and their follow-up component on college-age youth and young adults; the National Household Surveys on Drug Abuse (NHSDA); and the Worldwide Surveys of Substance Abuse and Health Behaviors Among Military Personnel (MWS). These surveys provide several perspectives about drug use and the work force. The HHS surveys, with their follow-up components, furnish data about youth who are prospective workers, who have just recently entered the work force, or who are relatively young members of the work force. The NHSDA surveys offer data on drug use among the general household population and
about the subset of this population who constitute the mainstream workers in the nation. The MWS surveys contribute data on a large but distinctive work force, the U.S. military. The self-report data from these studies are compared with data obtained from a large-scale drug-testing monitoring project across work sites. The chapter also examines organization-specific studies that have assessed the prevalence of alcohol and other drug use within specific organizations based on self-reports and/or urinalysis. Finally, the chapter looks at studies that have attempted to assess the prevalence rates of on-the-job drug use.
Over the past 15 years, there has been substantial epidemiological research conducted on drug abuse. This chapter does not exhaustively review all of this work, but looks at those studies that best allow us to provide sound estimates of prevalence and trends of alcohol and other drug use by the work force. From time to time we call on other sources of data (e.g., the National Longitudinal Survey, the Drug Abuse Warning Network data [DAWN], the Drug Use Forecasting system data [DUF]) to complement the primary data sources.
In reviewing research in this area, we highlight some of the strengths and limitations of self-report and urinalysis data. Specific methodological and measurement weaknesses associated with the primary data sources relied on in this chapter are addressed in their respective sections. More general limitations associated with epidemiological research are addressed in Appendix A (e.g., self-report measures).
SURVEY AND DRUG-TESTING APPROACHES: STRENGTHS AND LIMITATIONS
The methodological differences between data obtained from surveys and from work site drug testing mean that one can expect to gain from these sources somewhat differing pictures of alcohol and other drug use. Surveys designed to estimate the prevalence of drug use suffer from that very fact; their purposes are transparent and sensitive, and respondents may not give candid answers. Drug-testing programs, in contrast, have not been developed to provide prevalence estimates, but the widespread implementation of testing programs may allow aggregate test results to serve as a broad barometer of drug use among the work force. Using results of urine testing as an epidemiologic tool serves a complementary role to studies based on self-reports such as the three large-scale survey series we examine.
Urine testing, done with appropriate quality control procedures, provides an objective indicator of recent drug use, which complements the subjectivity of survey studies. Drug-testing results are readily available in large numbers. Approximately 100 laboratories certified by the National Institute on Drug Abuse conduct much of the work site drug testing. These
laboratories typically store test results in computer files, a procedure that allows large numbers of test results to be easily accumulated.
At the same time, drug test results do have limitations as epidemiologic indicators. Applicants and employees are selected for testing for corporate rather than statistical sampling reasons. Consequently, those tested are not a random sample of the work force population, and drug use estimates based on test results are likely to be biased. Most drug testing is designed to detect between five and eight drugs. Most work site urine testing protocols, for example, do not test for alcohol; thus, no reliable test-based information can be provided about this drug. Moreover, positive urine test results indicate only that a person has recently used a particular drug, typically, in the past 2 to 7 days, varying with the drug tested. Heavy marijuana use, however, can produce positive results for up to a month after cessation of use. Moreover, positive rates at NIDA-certified laboratories will be inflated due to the required blind-spiked quality control samples that are submitted to all certified laboratories as part of the NIDA certification process. Furthermore, test results, either positive or negative, also provide no information on patterns of use such as frequency, amount or place of use (e.g., off or on the job). In contrast, studies based on self-reports generally inquire into alcohol and other drug use over an extended period of time, frequently the previous month, year, or lifetime. Self-report studies typically ask about the amount and frequency of use to distinguish casual from regular or heavy users and occasionally inquire about the context or social setting in which the drug was used.
Changes in drug-testing programs, usually to encompass new situations or new groups of workers or applicants, hamper longitudinal comparisons of drug use unless specific information on reasons for testing and types of people tested is linked to test results in the computerized data base. Even then, labs and industries perceive little reason to link wide-ranging demographic or attitudinal information to test results, although such information would allow for a far richer analysis of the types of people who use drugs and a more comprehensive study of trends in drug use over time. Currently available work site drug-testing data banks can provide valuable information on differences in prevalence rates across types of industries and on the relative frequency of use of specific drugs, but much more could be learned if additional data were systematically collected.
Survey data, such as those from the three studies that are the focus of much of this chapter's discussion, often use sophisticated sampling techniques that allow for precise estimates of drug use for well-defined populations. They also collect demographic information that allows for estimates of alcohol and other drug use within population subgroups. Survey results, however, are subject to the potential bias of self-reports as well as to the ambiguities caused by questions that are subject to varying interpretations.
The populations they represent often exclude groups, like high school dropouts, who are part of the work force. In addition, surveys are relatively expensive to conduct, so sample sizes even in large-scale studies may have too few members of particular subgroups or users of particular drugs to allow for the computation of reliable estimates.
Thus, in investigating trends in alcohol and other drug use, both surveys and drug test data have their uses and limits. When the implications of the two types of data converge, we may have increased confidence in the jointly suggested conclusions. But because of the nature of these two data sources, far more could be learned if individual survey data designed to capture demographic traits and worker attitudes could be combined with drug test results of the millions of people tested for drugs each year.
Interestingly, both demographic and attitudinal/personality data are often routinely collected in the preemployment setting, in which most job-related drug testing occurs. Employers typically require personal background information from job applicants and often give applicants additional personality and other tests. Those data, however, are rarely accessible for research, since they are not usually linked to drug test results. If a link could be made, considerably more could be learned about trends in and correlates of drug use.
LARGE-SCALE SURVEYS
The three survey series we review are similar in that they provide estimates of illicit drug use based on self-reports of representative samples of the populations under study. Illicit drug use, as measured in these surveys, involves the use of illegal drugs and the nonmedical use of prescription-type psychotherapeutic drugs. Respondents are typically asked about their use of such drugs in the month or year preceding the survey.
The surveys all asked about use of marijuana (including hashish); hallucinogens (including phencyclidine or PCP and lysergic acid diethylamide or LSD); cocaine (including crack); heroin and other opiates; inhalants such as lighter fluids, aerosol sprays, glue, paint thinners, and cleaning fluids; and the nonmedical use of prescription-type psychotherapeutic drugs (i.e., stimulants, sedatives, tranquilizers, and analgesics used without a doctor's prescription or for purposes other than intended). In addition, the surveys gathered information about alcohol use and cigarette smoking.
The different surveys, however, define ''heavy drinking" somewhat differently. For the HSS, heavy drinking refers to 5 or more drinks in a row at least once in the prior 2 weeks. For the NHSDA, heavy drinking refers to the consumption of five or more drinks on the same drinking occasion on 5 or more days in the last 30 days. For the MWS, the definition of heavy drinking is similar to that of the NHSDA and refers to consumption of 5 or
more drinks of beer, wine, or liquor per typical drinking occasion at least once a week.
Definitions of cigarette smokers are similar with some slight variations. All of the surveys asked respondents about smoking cigarettes during various time periods (lifetime, past year, past month). The HHS and the NHSDA define smokers as those who have smoked one or more cigarettes during those periods. The MWS definition is similar, but for past month use, which is the primary measure (i.e., current smokers), it incorporates an additional criterion that individuals must have smoked at least 100 cigarettes (i.e., five or more packs) during their lifetime.
High School Senior Surveys
The High School Senior surveys are an ongoing study of young Americans, conducted by the Institute for Social Research at the University of Michigan (Johnston et al., 1992). The studies began with the high school class of 1975, and follow-up surveys began with the class of 1976. Thus, through 1991, the population surveyed consists of young American men and women ages 18 to 33 who were not high school dropouts. For present purposes, high school seniors and high school graduates ages 19 to 28 are discussed in this report (because sufficient trend data exist for the latter). The HSS respondents who are in the work force are young workers, members of the age group most likely to be involved with alcohol and other drug use, particularly illicit drug use.
Prevalence and Trends in Illicit Drug Use
Over the past 10 years there have been appreciable declines in the use of a number of illicit drugs among high school seniors and over the past 5 years (for which data are available) among young adults more generally. Figure 3.1 shows trends for any illicit drug use and heavy alcohol use along with marijuana use and cocaine use among high school seniors: more than half of the high school classes of 1977 through 1981 had used an illicit drug during their senior year, a proportion peaking at 54 percent for the class of 1979; this statistic fell gradually, reaching 29 percent for the class of 1991. The decline in recent years is also evident among young adults ages 19 to 28, as shown in Figure 3.2. In 1991, 27 percent of these young adults reported having used an illegal drug at least once in the past 12 months; that statistic was over 40 percent as recently as 1986 (the first year for which the data are available for this age range). Clearly, new workers entering the work force in the 1990s are likely to have substantially less experience with illicit drugs than did their counterparts in the 1980s and the late 1970s.


Alcohol and Cigarettes
Most high school seniors use alcohol, even though there is now a minimum purchase age of 21 in all 50 states. Heavy drinking is the behavior of most concern (5 or more drinks in a row almost surely result in inebriation), and it is strikingly prevalent. In 1991, some 30 percent of seniors reported having had 5 or more drinks in a row at least once in the prior 2 weeks; young adults up to about age 22 report such binge drinking even more frequently. Although heavy drinking is distressingly common, the prevalence of such behavior among high school seniors has steadily decreased from about 41 percent in the early 1980s (Figure 3.1). The trend among young adults ages 19 to 28 is not so encouraging: in the last 6 years, prevalence has stayed at about 35 percent (Figure 3.2).
Cigarette use changed surprisingly little during the 1980s. An estimated 28 percent of 1991 seniors smoked cigarettes in the month prior to the survey and 19 percent were daily smokers. In 1981, the figures were 29 and 20 percent, respectively. In addition, some of the lighter smokers become heavy smokers after high school. For example, more than 1 in every 5 young adults ages 19 to 28 is a daily smoker (22 percent), and one in six (16 percent) smokes a half-pack a day or more.
National Household Surveys on Drug Abuse
The National Household Surveys on Drug Abuse (NHSDA) provide national data about the prevalence, correlates, and trends in the use of illicit drugs, alcohol, and tobacco among members of the household population age 12 and older, including members of the household population who are employed. Surveys were conducted in 1971, 1972, 1974, 1976, 1977, 1979, 1982, 1985, 1988, 1990, 1991, and 1992 and are currently conducted annually. The 1988, 1990, and 1991 NHSDAs provide the basis of much of the discussion here because more recent data from the 1992 NHSDA have not yet been fully analyzed. Some trend data from 1979 to 1991 are presented.
The surveys reveal that there has been a decline in the use of illicit drugs and alcohol since the late 1970s; they also report a longer-term decline in tobacco use. These trends for the household population are likely to be reflected in the employed population, as some data from the NHSDAs indicate.
Prevalence and Trends in Alcohol and Other Drug Use
The percentage of the household population who were current (past month) users of any illicit drug, alcohol, or cigarettes has steadily declined over the past decade. In 1979, approximately 14 percent of the total household
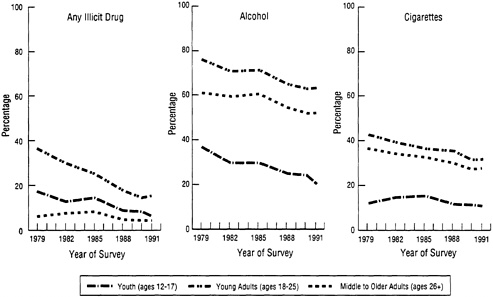
FIGURE 3.3 Trends in the percentage reporting use of all illicit drugs, alcohol, and cigarettes in the past month, by age group, 1979-1991. SOURCE: Data from the National Household Survey on Drug Abuse (Substance Abuse and Mental Health Services Administration, 1993).
population had used one or more illicit drugs in the past month compared with 6 percent in 1991 (Substance Abuse and Mental Health Services Administration, 1993). The decreases were more rapid in the earlier part of this period and have since leveled off. Illicit drug use has historically been highest among young adults, and dramatic decreases in the percentage of this group using any illicit drugs in the past month were observed between 1979 and 1991. Intermediate rates of use were found for youth; these rates also decreased, but not as rapidly. Use rates among older adults were the lowest of the three age groups, and more modest decreases were observed (Figure 3.3).
Alcohol use has also declined over the past 15 years: although prevalence of any alcohol use has decreased for all three age groups since the late 1970s, rates of heavy alcohol use have been more stable. In 1988, 1990, and 1991, about 5 percent of the total household population were heavy alcohol users. Decreases in current cigarette use have been steadier over the period, diminishing from a prevalence rate of 32 percent in 1985 to 27 percent in 1991 for the total household population. Related decreases in current cigarette use were observed for young adults and middle to older adults, but current cigarette use has remained relatively stable among youth ages 12 to 17 (see Figure 3.3).
Demographic Correlates of Alcohol and Other Drug Use
Current use of illicit drugs was more common among those ages 18 to 25 than among other age groups and more common among men, blacks, residents of large metropolitan areas, and residents of the West than among other groups (Figure 3.4). For alcohol use in the past month, rates were significantly greater among those ages 18 to 25 and 26 to 34 than among other age groups, among men than among women, among whites than among blacks and Hispanics, among residents of large and small metropolitan areas than among residents of nonmetropolitan areas, and among residents of the Northeast, North Central, and West regions than among residents of the South (Substance Abuse and Mental Health Services Administration, 1993). Rates of cigarette smoking were significantly higher among adults aged 18 to 25 and 26 to 34 than among other age group, among men than women, among whites and blacks than among Hispanics, among residents of nonmetropolitan areas. There were no differences among the four regions of the country (Substance Abuse and Mental Health Services Administration, 1993).
Alcohol and Other Drug Use by the Work Force
Relatively few analyses of the prevalence of the use of illicit drugs, alcohol, and tobacco among employed and unemployed persons or among occupational groups have been conducted. The NHSDA surveys have some data that bear on these issues. Although the surveys do not gather information specific to alcohol and other drug use at work (i.e., on the job), they do nonetheless, provide valuable estimates of the extent of alcohol and other drug use by various segments of the work force (regardless of where the use took place). Kopstein and Gfroerer (1990), using data from the 1988 NHSDA, found that illicit drug use was substantially higher among unemployed (18 percent) than among full-time (8 percent) or part-time (9 percent) employed persons. In contrast, weekly alcohol use was higher among full-time employed persons (40 percent) than among those in other employment statuses (33 percent), whereas heavy alcohol use showed little variation among employment groups. Age and sex differentials in rates of alcohol and other drug use among employed persons were similar to those for all adults.
To explore alcohol and other drug use among the work force further, the Kopstein and Gfroerer analyses were replicated using data from the 1990 NHSDA. These data examine the prevalence of current use of selected illicit drugs and heavy alcohol among employed and unemployed persons age 18 and older. Findings from the 1990 NHSDA substantiate many of the findings from the 1988 analyses. As shown in Table 3.1, illicit

TABLE 3.1 Prevalence of Alcohol and Other Drug Use, by Selected Type of Use, Employment Status, Sex, and Age, 1990
| Percent of Population | |||||||
| Past Month Use of Any Illicita | Past Month Use of Marijuana | Past Year Use of Cocaine | Heavy Use of Alcoholb | ||||
Employment Status and Age Group | Male | Female | Male | Female | Male | Female | Male | Female |
Full-Time Employed | ||||||||
18-25 years | 17.1 | 10.1 | 15.1 | 9.2 | 9.5 | 6.4 | 20.7 | 4.4 |
26-34 years | 10.1 | 5.8 | 8.9 | 4.9 | 8.5 | 4.0 | 12.6 | 1.5 |
35+ years | 4.0 | 4.3 | 2.6 | 3.3 | 1.3 | 1.6 | 5.1 | 2.2 |
All ages 18+ | 7.8 | 5.7 | 6.3 | 4.8 | 4.7 | 3.1 | 9.6 | 2.4 |
Part-Time Employed | ||||||||
18-25 years | 17.6 | 14.7 | 14.7 | 10.1 | 7.3 | 14.8 | 5.2 | |
26-34 years | 25.0 | 11.6 | 23.3 | 10.2 | 17.2 | 4.8 | 22.9 | |
35+ years | ||||||||
All ages 18+ | 12.0 | 6.5 | 10.3 | 5.8 | 5.8 | 1.1 | 11.7 | 2.6 |
Unemployed | ||||||||
18-25 years | 24.2 | 14.3 | 22.4 | 11.8 | 20.2 | 11.1 | 10.7 | |
26-34 years | 20.0 | 24.9 | 19.6 | 21.5 | 18.3 | 9.9 | 4.5 | |
35+ years | 14.1 | |||||||
All ages 18+ | 19.3 | 17.0 | 17.0 | 9.0 | 15.0 | 5.3 | 10.8 | 3.7 |
a Includes use of marijuana, hashish, inhalants, hallucinogens, cocaine, heroin, and nonmedical use of stimulants, sedatives, tranquilizers, or analgesics. b Heavy drinking is having 5 or more drinks on the same occasion 5 or more times in the past 30 days. c Low precision; no estimate reported. SOURCE: Data from the National Household Survey on Drug Abuse (National Institute on Drug Abuse, 1991). | ||||||||
drug use is substantially higher among the unemployed (14 percent) than among the full-time (7 percent) or part-time (8 percent) employed. The highest rate of illicit drug use was among unemployed persons ages 26 to 34 (23 percent). Weekly alcohol use was somewhat higher among full-time employed persons (27 percent) than among part-time employed persons (22 percent) or the unemployed (20 percent). Overall, heavy alcohol use showed similar rates among employment groups (5 to 7 percent). Both weekly alcohol use (34 compared with 21-25 percent) and heavy alcohol use (14 compared with 9 percent) were highest among full-time employed people ages 18 to 25 relative to their part-time employed and unemployed counterparts.
The prevalence of illicit drug use diminished between 1988 and 1990 for most drugs and employment groups, as shown in Table 3.2. The exception to the general downward trend in rates of use was an increase in past-year cocaine use among the full-time employed, from 6 to 7 percent. Alcohol use decreased for most comparisons, and decreases of more than 10 percent were observed in the rates of weekly alcohol use for all three employment groups. Rates of heavy alcohol use were more stable.
Among full-time employed male workers, rates of marijuana, cocaine, heavy alcohol, and any illicit drug use varied inversely with income level, as shown in Table 3.3. Among women, the reported use of these substances was lower and an association with income was not found. Rates of any illicit drug use were higher among blacks than among whites or Hispanics for both men and women. Cocaine use was also higher among black men than white or Hispanic men, whereas cocaine use was relatively low among women with little variation among racial or ethnic groups. There were no racial or ethnic differences in heavy alcohol use for men, and because of sample size constraints an estimate of heavy alcohol use was available only for white women.
Among full-time employed persons, rates of illicit drugs and heavy alcohol use varied across industries and for men and women, as shown in Table 3.4. Many of the estimates for women are unreliable due to small sample sizes, but the available data show few differences for women across industries. Among men, current use of illicit drugs and heavy alcohol use were highest among construction workers. Some 20 percent of male construction workers reported using one or more illicit drugs in the past month, 18 percent used marijuana, 14 percent used cocaine, and 26 percent were heavy drinkers. Rates of illicit drug use were relatively low among male professional, manufacturing, and transportation workers. Intermediate levels of any illicit drug use were found among male retail trade, repair services, and wholesale trade workers. More than 20 percent of men employed full time in construction, transportation, and wholesale trade were heavy drinkers.
TABLE 3.2 Prevalence of Alcohol and Other Drug Use, by Selected Type of Use, and Employment Status, Age 18 and Older, 1988 and 1990
| Past Month Use of Any Illicita | Past Month Use of Marijuana | Past Year Use of Cocaine | Weekly Use of Alcoholb | Heavy Use of Alcohol | |||||
Employment Status | 1988 | 1990 | 1988 | 1990 | 1988 | 1990 | 1988 | 1990 | 1988 | 1990 |
Full-Time Employed | 8.2 | 7.0 | 6.8 | 5.7 | 5.7 | 7.2 | 39.9 | 27.4 | 6.4 | 6.8 |
Part-Time Employed | 9.4 | 8.0 | 7.5 | 6.2 | 4.5 | 2.4 | 32.9 | 21.6 | 5.6 | 5.1 |
Unemployed | 18.2 | 14.0 | 14.8 | 12.3 | 9.5 | 9.3 | 32.9 | 19.7 | 7.9 | 6.6 |
a Includes use of marijuana, hashish, inhalants, hallucinogens, cocaine, heroin, and nonmedical use of stimulants, sedatives, tranquilizers, or analgesics. b Heavy drinking is having 5 or more drinks on the same occasion 5 or more times in the past 30 days. SOURCE: Data from the National Household Survey on Drug Abuse (National Institute on Drug Abuse, 1991). | ||||||||||
TABLE 3.3 Prevalence of Alcohol and Other Drug Use Among Full-Time Employed Persons Ages 18-34, by Selected Type of Substance, Sex, Personal Income, and Race/Ethnicity, 1990
| Percent of Full-Time Employed | |||||||
| Past Month Use of Any Illicita | Past Month Use of Marijuana | Past Year Use of Cocaine | Heavy Use of Alcoholb | ||||
Personal Income and Race/Ethnicity | Male | Female | Male | Female | Male | Female | Male | Female |
Annual Income | ||||||||
Less than $12,000 | 21.7 | 7.8 | 19.5 | 6.9 | 11.1 | 6.0 | 19.1 | 3.2 |
$12,000 to $19,999 | 11.7 | 5.8 | 10.4 | 5.4 | 9.3 | 5.4 | 17.2 | 2.2 |
$20,000 to $29,999 | 11.0 | 9.7 | 9.8 | 8.2 | 9.7 | 11.8 | 3.5 | |
$30,000 or over | 7.8 | 6.2 | 6.3 | 5.0 | 5.7 | 4.4 | 13.9 | |
Race/Ethnicity | ||||||||
White | 12.2 | 7.2 | 10.7 | 6.2 | 8.0 | 5.0 | 15.5 | 2.9 |
Black | 17.8 | 10.1 | 17.3 | 9.6 | 14.5 | 3.9 | 14.3 | |
Hispanic | 11.1 | 6.4 | 8.4 | 5.3 | 11.3 | 4.2 | 14.8 | |
a Includes use of marijuana, hashish, inhalants, hallucinogens, cocaine, heroin, and nonmedical use of stimulants, sedatives, tranquilizers, or analgesics. b Heavy drinking is having 5 or more drinks on the same occasion 5 or more times in the past 30 days. c Low precision; no estimate reported. SOURCE: Data from the National Household Survey on Drug Abuse (National Institute on Drug Abuse, 1991). | ||||||||
TABLE 3.4 Prevalence of Alcohol and Other Drug Use Among Full-Time Employed Persons Ages 18 to 34, by Selected Industries, Selected Type of Substance, and Sex, 1990
| Percent of Full-Time Employed | |||||||
| Past Month Use of Any Illicita | Past Month Use of Marijuana | Past Year Use of Cocaine | Heavy Use of Alcoholb | ||||
Selected Industry | Male | Female | Male | Female | Male | Female | Male | Female |
Construction | 20.0 | c | 18.1 | c | 14.0 | c | 26.4 | |
Manufacturing | 9.7 | 5.0 | 7.7 | 5.0 | 8.9 | c | 12.7 | |
Transportation | 10.5 | 6.9 | c | 9.5 | c | 20.4 | ||
Wholesale Trade | 13.8 | 11.0 | 12.7 | c | 20.5 | |||
Retail Trade | 16.8 | 7.3 | 15.2 | 5.2 | 9.8 | 7.3 | 14.3 | 4.3 |
Finance | 11.3 | 7.0 | 13.6 | 16.7 | ||||
Repair Services | 16.1 | 15.8 | 5.7 | c | 9.3 | |||
Professional | 9.0 | 5.5 | 9.0 | 4.1 | 4.5 | 5.6 | 9.9 | 3.9 |
a Includes use of marijuana, hashish, inhalants, hallucinogens, cocaine, heroin, and nonmedical use of stimulants, sedatives, tranquilizers, or analgesics. b Heavy drinking is having 5 or more drinks on the same occasion 5 or more times in the past 30 days. c Low precision; no estimate reported. SOURCE: Data from the National Household Survey on Drug Abuse (National Institute on Drug Abuse, 1991). | ||||||||
Similar variations across occupational groups in alcohol consumption were recently reported by Parker and Harford (1992). These investigators provided estimates of the prevalence of alcohol use, alcohol dependence, and severe alcohol dependence among working men and women in both blue-collar and white-collar occupations. Self-report interview data obtained from 26,738 employed respondents who participated in the National Health Interview Survey revealed that rates of drinking (i.e., respondents reporting the consumption of 12 drinks or more during the year preceding the interview) were higher among people in white-collar occupations such as managerial, professional, technical, and sales. Although fewer current drinkers were found among blue-collar workers, those who were current drinkers were found to have higher average daily consumption levels, alcohol dependence, and severe dependence rates than members of white-collar occupations. Their analysis indicated that the prevalence of dependence and severe dependence on alcohol was especially high among food service workers, farmers, mechanics, construction workers, machine operators, and laborers.
In summary, the percentage of the work force population who are using illicit drugs, alcohol, or cigarettes has decreased over the past decade. However, rates of use remain relatively high among young workers ages 18 to 25. Rates of illicit drug use are higher among unemployed than employed persons. Also potentially affecting the workplace are the relatively higher rates of weekly and heavy alcohol use among full-time employed workers ages 18 to 25, compared with the part-time employed or unemployed. Some industries are more likely to be affected by high rates of alcohol and other drug use. Among the full-time employed, rates of illicit drug use and heavy alcohol use are highest among male construction workers. Rates of heavy drinking are also relatively high among male transportation workers, a fact that has obvious public safety implications.
Military Worldwide Surveys
The U.S. Department of Defense worldwide surveys of military personnel provide data comparable to the High School Senior surveys and the National Household Surveys on Drug Abuse for active-duty military personnel stationed across the world. Surveys were conducted in 1980, 1982, 1985, 1988, and 1992.
The military is a distinctive workplace, however, in that members have a special mission to preserve and defend the nation and consequently are often subject to a strictly controlled environment, including a well-established substance abuse policy aimed at preventing the misuse of alcohol and other drugs.
Trends in Alcohol and Other Drug Use
Figure 3.5 presents trends over the five surveys in the proportions of the total active military force who engaged in illicit drug use, heavy drinking, and cigarette smoking between 1980 and 1992. As shown, there are significant declines in all three measures, although the rate of decline varied for each. The percentage of military personnel admitting to having used any illicit drug within the past 30 days declined significantly and markedly from 28 percent in 1980 to 3 percent in 1992.
The prevalence of heavy drinking among military personnel also declined significantly between 1980 and 1992, although the decrease was less dramatic than for illicit drug use. In 1980, 21 percent of military personnel reported heavy drinking, compared with 15 percent in 1992. Although heavy drinking does not by itself constitute alcohol abuse, it does indicate drinking levels that are likely to have detrimental consequences, particularly in a group that works with weapons, vehicles, and other dangerous equipment. The percentage of military personnel who were cigarette smokers also decreased during the 12-year period, from 51 percent in 1980 to 35 percent in 1992.
The question arises whether these decreases in alcohol and other drug use are an artifact of changes in the demographic composition of the armed forces during the 1980s and early 1990s, a reflection of general population trends, or the result of military policy. Recuriting and reenlistment successes
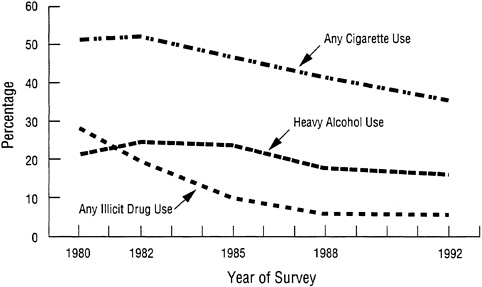
FIGURE 3.5 Trends in alcohol and other drug use, past 30 days, total U.S. Department of Defense, 1980-1992. SOURCE: Bray et al. (1992).
during this time resulted in a military work force in 1992 that was somewhat older, had more married personnel, and was better educated than in 1980, characteristics that are associated with a lower likelihood of alcohol and other drug use. For example, nearly 63 percent of the military force in 1992 were married compared with 53 percent in 1980; moreover, 61 percent were over age 25 in 1992 compared with 43 percent in 1980.
To assess the effect of the changing demographic characteristics on rates of alcohol and other drug use, the 1982, 1985, 1988, and 1992 surveys were standardized to the age, education, and marital status distribution of the military population in 1980. Significant declines in any illicit drug use and cigarette smoking remained after adjusting for demographic changes in the military population. In contrast, much of the decline in heavy drinking observed between 1980 and 1992 was attributable to changes in the demographic composition of the armed forces. After the data were adjusted to reflect demographic changes, the rate of heavy drinking in 1992 (19 percent) did not differ significantly from the rate in 1980 (21 percent).
Demographic Correlates of Alcohol and Other Drug Use
Table 3.5 presents data on reported illicit drug use during the past year and on heavy drinking and cigarette smoking for the past 30 days among various demographic subgroups. Overall, illicit drug and heavy alcohol use occurred among those who were younger, single, and less educated. In addition, men were much more likely to drink heavily than women. The common patterns observed for age, marital status, and educational status were not surprising because marriage and higher educational attainment generally occur with increasing age. Data on marital status indicate that the presence of a spouse was associated with reduced alcohol and other drug use. Among military personnel whose spouses were not with them, illicit drug use rates were similar to what they were among unmarried personnel, and rates of heavy alcohol use were above what they were for those who had spouses present.
Cigarette smoking was also associated with education and marital status. More educated military personnel were less likely to smoke than those with less education, and married personnel accompanied by a spouse were somewhat less likely to smoke than those who were unmarried or married but unaccompanied by a spouse. Blacks and Hispanics were less likely to smoke than whites, and women were less likely to smoke than men, but the differences were not large. Smoking prevalence declined with increasing age, but less dramatically than did illicit drug and alcohol use.
TABLE 3.5 Prevalence of Alcohol and Other Drug Use Among Military Personnel by Sociodemographic Characteristics (in percent)
Effects of Alcohol and Other Drug Use at Work
Two measures from the MWS were used to examine selected aspects of alcohol and other drug use on work behavior. The first focused on productivity loss attributed to alcohol and other drug use, and the second examined alcohol use at work, during lunch breaks, or shortly before going to work. Five items on the MWS sought to measure productivity losses attributed to alcohol and other drug use: being late, leaving work early, not coming to work, performing below normal, and after effects or illnesses. Figure 3.6 presents trends in self-perceived productivity losses due to any illicit drug or alcohol use. Overall, the data indicate that military personnel are more likely to experience work-related deficits because of alcohol use than because of illicit drug use. In the 1992 survey, about one in six military personnel reported some productivity loss due to alcohol use during the past year. As might be expected, the probability of a productivity loss is directly related to the level of use.
Table 3.6 presents information about alcohol use by military personnel immediately before or during work hours. As shown, 6 percent of military personnel reported drinking at these times. The percentage using alcohol was slightly lower among officers than enlisted personnel, indicating that the former had a somewhat lower exposure to the risk of alcohol-related problems at work. Taken together, the findings in Figure 3.6 and Table 3.6 suggest that alcohol use has some negative effects on the productivity and
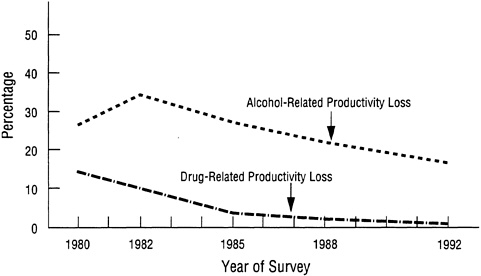
FIGURE 3.6 Trends in drug-and alcohol-related productivity loss, past 12 months, total U.S. Department of Defense, 1980-1992. SOURCE: Bray et al. (1992).
TABLE 3.6 Alcohol Use Among Military Personnel on Workdays, Past 30 Days (in percent of total personnel)
| Grade | ||
Drinking Occasion | Enlisted | Officers | Total |
Within 2 hours of going to work | 3.4 | 0.5 | 2.9 |
During lunch break | 4.1 | 3.7 | 4.0 |
During work or work break | 1.6 | 0.7 | 1.4 |
Total | 6.5 | 4.4 | 6.2 |
SOURCE: Data from Bray et al. (1992). | |||
work behaviors of military personnel, but drug use is now affecting the work of relatively few.
Comparing Military and Civilian Alcohol and Other Drug Use
Because of the unique mission of the military, the armed forces impose rather strict controls over the lives of their members in a number of areas, including alcohol and other drug use. To help gauge the relative magnitude of alcohol and other drug use patterns among military personnel, it is useful to have a civilian comparison group to serve as a benchmark.
In a recent study, Bray et al. (1991) conducted standardized comparisons of illicit drug use, heavy alcohol use, and smoking among military personnel and civilians. Military data were drawn from the 1985 MWS and civilian data from the 1985 NHSDA. The two data sets were equated for age and geographic location of respondents, and civilian alcohol and other drug use rates were standardized to reflect the sociodemographic distribution of the military. Standardized comparisons showed that military personnel were significantly less likely than civilians to report having used any illicit drugs during the past 30 days (8 compared with 24 percent), but they were significantly more likely to be heavy drinkers (21 compared with 11 percent) and to be cigarette smokers (44 compared with 39 percent).
More recently, similar analyses were conducted using data from the 1992 MWS and the 1991 NHSDA (Bray et al., 1992). Findings showed the same basic pattern of results as in the 1985 data: military personnel were still significantly less likely than civilians to engage in any illicit drug use (3 compared with 10 percent), but more likely than civilians to drink heavily (15 compared with 10 percent), especially men ages 18 to 25 (26 compared with 14 percent) and to smoke cigarettes (34 compared with 30 percent).
The fact that the proportion of illicit drug users is lower among military personnel than among civilians does not in itself constitute evidence of the
effectiveness of military policies and practices concerning illicit drug use. Nonetheless, it does make it a plausible hypothesis worth evaluating according to scientific methods. The military surveys point to the potential preventive effects of a clearly articulated and well-advertised policy against illicit drug use that is supported by drug testing with serious consequences for violations. However, the military is so different from most work settings that it is not clear to what extent military practices can be generalized to the civilian work force.
Is Heavy Illicit Drug Use Declining?
Although the overall prevalence of illicit drug use is declining, there is some question as to whether heavy use of illicit drugs is also declining. Some researchers believe that there may be a population of hard-core users whose numbers are not declining (Wish, 1990-1991). A 1993 National Research Council report (Gerstein and Green, 1993:2) vividly describes two worlds of drug use:
In one world, that of relatively low-intensity consumption (drug use) among individuals who can be found in schools and households, drug experience is self-reported more frequently by the wealthy than the less wealthy and by whites than Hispanics or blacks. In this world, there have been steady and cumulatively very marked declines in the prevalence of marijuana use since the late 1970s and of cocaine since the middle 1980s, and heroin use is so rare as to be barely measurable. In another world, that of emergency rooms, morgues, drug clinics, juvenile detention centers, jails, and prisons, in which indicators of intensive drug consumption (abuse and dependence) are collected: the poor predominate, blacks and Hispanics appearing in numbers much higher than their household or school proportions; marijuana and heroin use are common (though less so in some areas than in the 1970s); and cocaine use increased explosively throughout the 1980s and simply leveled off at high levels in the 1990s.
As Gerstein and Green suggest, trend data from the HSS and the NHSDA indicate that current (past 30 days) as well as heavy use of marijuana has declined (Table 3.7). The declines have been substantial for high school seniors as well as young adults ages 18 to 25—those for whom drug use tends to be highest. But these surveys of the general population do not capture large enough numbers of addicts or very heavy users of cocaine or heroin to provide reliable estimates of such drug users. Thus, to examine hard-core users, alternative sources of data should be investigated.
Perhaps the best information available to examine the extent and trends in the use of heroin and cocaine among hard-core users is the Drug Abuse Warning Network (DAWN) data from hospital emergency rooms. Prior to
TABLE 3.7 Comparison of Trends in Current Use and Daily Use of Marijuana from the High School Senior Surveys and the National Household Surveys on Drug Abuse, Past 30 Days (in percent)
| Year of Survey | ||||||
Use Level/Survey | 1985 | 1986 | 1987 | 1988 | 1989 | 1990 | 1991 |
Current Marijuana Use | |||||||
HHS, seniors | 25.7 | 23.4 | 21.0 | 18.0 | 16.7 | 14.0 | 13.8 |
NHSDA, young adultsa | 21.8 |
|
| 15.5 |
| 12.7 | 13.0 |
Daily Marijuana Use | |||||||
HHS, seniors | 4.9 | 4.0 | 3.3 | 2.7 | 2.9 | 2.2 | 2.0 |
NHSDA, young adultsa | 4.7 |
|
| 2.4 |
| 2.0 | 1.7 |
a Young adults aged 18-25. SOURCES: Data from the National Household Survey on Drug Abuse (Substance Abuse and Mental Health Services Administration, 1993); unpublished data from the High School Senior Survey (1992). | |||||||
1989, these data were obtained from a set of hospitals that were not statistically representative of any defined population, making it difficult to assess the validity of trends. Since 1989, however, participating hospitals are representative of defined areas, so trend data can be more reliably assessed. These data, which are reported quarterly, showed upward trends in the first three quarters of 1991 and the first quarter of 1992 in the number of persons treated in emergency rooms for cocaine use. These increases do not, however, necessarily indicate increased use among the hard-core population. There are many possible alternative explanations. For example, there could be changes in the extent to which emergency room personnel correctly ascertain the presence of cocaine in a presenting patient; changes in the purity of cocaine may have increased the effective dosage; added adulterants could have increased toxicity; lower prices may have resulted in people taking higher doses; or more new users may be taking cocaine, resulting in ''over" reactions to its effects. Nevertheless, the recent increases in emergency room mentions of cocaine suggest that cocaine use may not be declining among all subgroups. The data for heroin use also show similar trends: increases in the first three quarters of 1991 and again in the first quarter of 1992 (HHS News, October 23, 1992).
Other less reliable indicators than the DAWN data corroborate the suggestion that illicit drug use may not be declining among all subgroups of the population. One such indicator comes from the Drug Use Forecasting (DUF) system (Wish, 1990-1991). This system assesses illicit drug use among recent arrestees in selected metropolitan areas. Because of the nature of the data collection procedures, as well as aspects of the design of the system, it
is difficult to know what these data reflect about the larger society. However, the data do show that there are very high levels of illicit drug use among recent arrestees, approaching or even exceeding 50 percent in some locations. And there is no evidence of any consistent decline in such proportions since the data were first collected in 1986.
Treatment facilities could, in theory, provide additional information on trends in illicit drug use among the general population. However, there are no data that can be reliably used to assess such trends in treatment facility utilization. Factors such as cost of treatment, availability, preferred modality, referral sources, and length of treatment all vary tremendously, and each can have major effects on treatment utilization.
Despite the fact that there may be some hard-core illicit drug users whose numbers are not declining, it seems clear that there are declining numbers of experimental and casual users among the general population. It is these latter users who have been most likely to be members of the work force. Although some, if not many, hard-core illicit drug users are employed at various times, their numbers in recent years have been relatively low compared with the number of experimental or casual users, most of whom are regular members of the work force.
Summary
All three survey series indicate that illicit drug use has declined over the past decade or more. The decline is evident among the populations of young people, households, and military personnel. Use has similarly declined both among the working-age population and among people who are currently working. Nevertheless, despite these declines, alcohol and other drug use continues to affect significant proportions of the work force and selected industries. Heavy alcohol use also affects performance negatively and, unlike illicit drug use, survey findings suggest that its prevalence has not been decreasing. Although surveys of the general population do not provide meaningful estimates of hard-core use of illicit drugs, findings from alternative sources suggest that rates of heavy use of cocaine and heroin may be stable or even increasing. The implications of such trends for the work force are largely unknown. Heavy drug use is likely to prevent hard-core users from becoming productive workers, so such users may not be actively employed in the work force.
WORK SITE DRUG TESTING
Increasing proportions of the work force have undergone urine tests for drug use in recent years. The most common reason for conducting the tests was as part of job application procedures.
The data from work site drug testing reviewed here consist of urinalysis results obtained from a monitoring project of laboratories certified by the National Institute on Drug Abuse (NIDA). The labs tested large numbers of urine samples for organizations with drug-testing programs. Urine testing done with appropriate quality control procedures provides an objective indicator of recent drug use that is not subject to problems of underreporting, as are self-reports of use. However, because this kind of testing measures only a subset of drugs and detects only very recent drug use, the results may not be directly comparable with self-reported data, which are typically based on longer reference periods such as a month or a year. Furthermore, drug test findings are not based on probability samples, hence estimates of drug use prevalence derived from them may be subject to unknown biases. An inherent source of bias of NIDA-certified laboratory test results is a direct consequence of the blind quality control programs. That is, spiked samples will be reported as positive and will inevitably inflate the estimated positive rate.
Background
The most comprehensive and up-to-date source of information on work site drug-testing results is a study funded by NIDA1 that summarizes test results collected quarterly from a sample of seven NIDA-certified laboratories that currently report on over 300,000 tests per quarter. For each test, laboratories provide information on the drugs included in the test protocol along with screening and confirmatory levels used in the testing procedure.2 Along with information on the testing protocol, data are collected on geographic location, type of industry, and reason for testing. (No information that can link a test result to a company or an individual is submitted to the project.)
These test situations vary with the group to be tested and whether the person has any forewarning that testing will occur. The latter is important, as prior notification provides an opportunity for a drug user to temporarily suspend use to avoid a positive test result. The testing categories used include:
Preemployment—testing of job applicants, typically announced.
1 | NIDA Contract No. 271-89-8525, "Drug Testing Laboratories Data Analysis" performed by Research and Evaluation Associates, Chapel Hill, N.C. |
2 | Chapter 6 of this report deals extensively with the procedures and protocols of testing, in both NIDA-certified and other laboratories. |
Random—unannounced testing of current employees unrelated to suspicion about a specific individual.
Periodic medical—announced testing of current employees, often part of a regularly scheduled physical, again unrelated to suspicion about a specific individual.
Reasonable cause—unannounced testing of current employees suspected of drug use.
Post-accident—testing of employees involved in an accident or incident.
Return-to-duty—unannounced testing of employees who are returning to work after a leave related to drug use.
Findings
Of the nearly 2 million test results obtained from October 1990 through March 1992, almost 4 percent3 or nearly 70,000 were positive for one or more illicit drugs. Marijuana was the most commonly detected drug, with 2 percent of the specimens testing positive for its metabolites, followed by cocaine (1 percent), opiates (0.6 percent), and benzodiazepines (0.5 percent) (Figure 3.7).
As discussed in more detail in Chapter 6, the standard test protocol, commonly referred to as the "NIDA-5," includes testing for marijuana, cocaine, phencyclidine (PCP), opiates, and amphetamines, using standard cutoff levels for screening and confirmatory results. The advantage of examining results from the NIDA-5 panel is that any variations observed reflect differences in rates of drug use rather than in testing procedures. The disadvantage of limiting the discussion to this testing protocol is that it does not include findings on drugs such as alcohol, benzodiazepines, and barbiturates.
Using the NIDA-5 panel, the positive rate for detecting any illicit drug was 3 percent; using any test protocol, the rate was 4 percent. Part of the difference between the two percentages is that the NIDA-5 protocol tests for only five drugs, and most of the other protocols test for six to eight different drugs. The additional drugs included in the testing protocol do not, however, account for all of the observed difference in positive rates. The positive rates for specific drugs are typically 20 percent lower with the
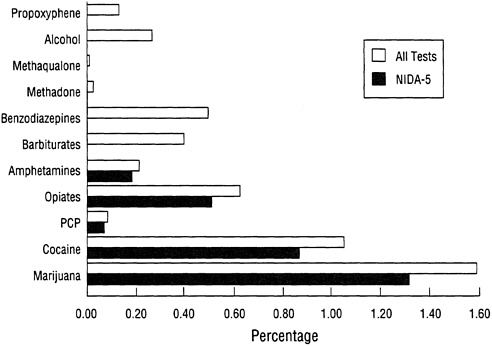
FIGURE 3.7 Positive rates for work site urine testing by type of drug, October 1990March 1992. SOURCE: Unpublished data from the NIDA Drug Testing Laboratories analysis.
NIDA-5 panel compared with all testing. One factor is that many private employers have set up drug-testing programs that have lower cutoff levels than the NIDA-5 protocol for either the initial screening test, the confirmation test, or both. The use of a lower cutoff would result in a higher detection rate. Another factor that might account for this difference is the type of work settings that use the NIDA-5 panel. Many of the employers using the NIDA-5 panel are under a mandate, such as the U.S. Department of Transportation (DOT) regulations, to have an antidrug program. Organizations that are required to have a program may be more aggressive in their efforts to deter drug use with programs involving a range of antidrug activities, not just urine testing. From an epidemiologic perspective, the advantage of the NIDA-5 test panel is that it is a standardized measure of drug use. Any differences in positive rates by reason, over time, or across regions or industries will not reflect variations in the test methods. For this reason, the remaining comparisons we make are limited to testing done using the NIDA-5 panel.
Reasons for Testing
For the NIDA-5 test results, the reasons for testing reported to the project were preemployment (44 percent), random (27 percent), and periodic medical (26 percent) testing. Of these three types of testing, preemployment tests for job applicants have the highest positive test rate, with one or more drugs detected in 3 percent of the specimens. With current employees, the positive rate for random testing was almost 3 percent and for periodic medical testing it was 2 percent (see Figure 3.8). The figure for periodic medical testing, although low, is striking, since employees are typically aware that testing will occur. In spite of forewarning, nearly 2 percent test positive. One possible explanation is that some employees are not capable or
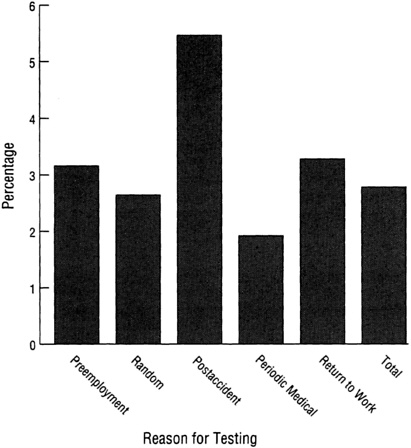
FIGURE 3.8 Positive rates for work site urine testing by reason for testing, October 1990-March 1992. SOURCE: Unpublished data from the NIDA Drug Testing Laboratories analysis.
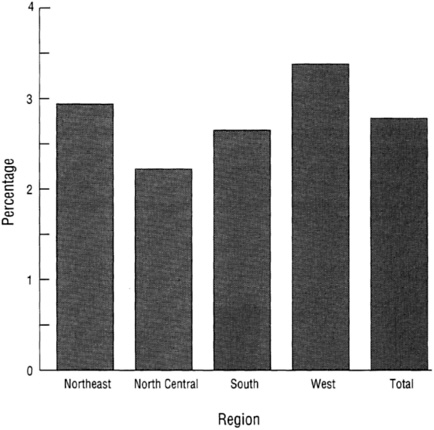
FIGURE 3.9 Positive rates for work site urine testing by region of the country, October 1990-March 1992. SOURCE: Unpublished data from the NIDA Drug Testing Laboratories analysis.
willing to stop their drug use, even for the brief period necessary to produce a "clean" specimen. It is also possible, particularly with respect to marijuana, that use was not stopped soon enough to eliminate metabolites from the urine.
Results from random testing without notification provide the best indicator of the actual prevalence of regular drug use among workers. Approximately 1 in 40 employees tested positive (3 percent) on random tests. Among all categories of testing, the highest rate was observed for post-accident testing, with 5 percent of more than 12,000 tests positive.4
Region and Type of Industry
As shown in Figure 3.9, there were small but significant regional differences in positive rates, with the West having the highest rate (3.36 percent), followed by the Northeast (2.94 percent), the South (2.65 percent), and the lowest in the North Central (2.22 percent). All differences between regions were statistically significant. The rate for the West is over 50 percent higher than the one observed in the North Central region. Except for cocaine, positive rates for particular drugs were also highest in the West. The highest positive rate for cocaine has consistently been in the Northeast.
Consistent with data from self-reports based on the 1990 National Household Surveys on Drug Abuse (NHSDA) cited earlier in this chapter, differences were also observed across industry types. As was the case with the NHSDA, the highest rate of drug use was observed in the construction industry (see Figure 3.10). However, a much lower positive rate for urine tests (6 percent)
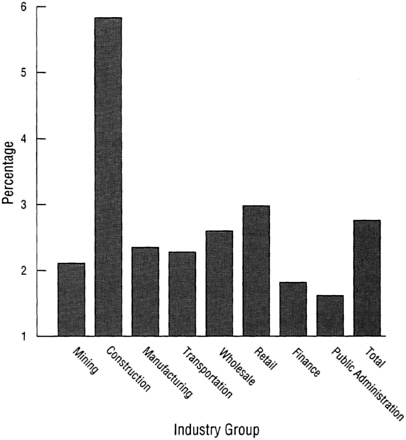
FIGURE 3.10 Positive rates for work site uring testing by industry groups, October 1990-March 1992. SOURCE: Unpublished data from the NIDA Drug Testing Laboratories analysis.
was observed among construction workers than from self-reports in the 1990 NHSDA (20 percent). This lower rate from urine testing is to be expected for several reasons. First, testing yields information only on recent use, whereas the NHSDA is based on self-reported use in the past 30 days. Second, the NHSDA asks about the use of a larger number of drugs than in the NIDA-5 test panel. Third, the NHSDA includes responses from casual construction workers working for small companies; those tested were more likely to be working on government projects or for larger organizations. Despite the difference in absolute values between questionnaire data and the urine test data, there is a concordance in the relative rankings between the 1990 NHSDA results for men aged 18 to 34 and the results of urine testing data. Moreover, among the industries common to the two studies, rank ordering of the top three was the same (construction, retail sales, and wholesale trade).
Time Trends
Quarter-to-quarter variations were observed in the positive rate for any illicit drug, ranging from 2.53 to 2.95 percent (Figure 3.11). The most striking fluctuations were in the rates for marijuana and cocaine. Positive rates for marijuana, the most frequently detected drug, ranged from 0.93 percent to 1.65; with cocaine, the low was 0.71 percent and the high was 1.07 percent. Changes in positive rates for the two drugs were inversely related, with cocaine increasing when marijuana declined and visa versa. As data from additional quarters become available, it may be possible to
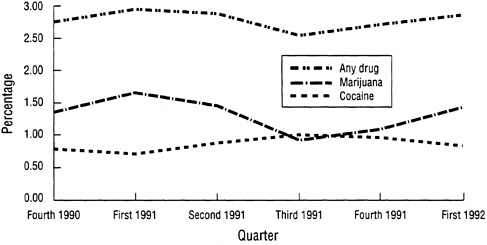
FIGURE 3.11 Positive rates by quarter for work site drug testing. SOURCE: Unpublished data from the NIDA Drug Testing Laboratories analysis.
identify factors, such as variations over time, related to changes in illicit drug use patterns.
Summary
As with survey findings, drug-testing results indicate that the vast majority of the work force does not use the illicit drugs that are included in the test protocol. Alcohol is generally not included in employment drug test panels. Random testing results, which provide the best indicator of recent worker illicit drug use suggest that approximately 1 in 40 workers uses illicit drugs at a given point in time. Among those who do, marijuana is the most commonly detected drug, followed by cocaine; although the relative prevalence of marijuana use may be overstated because its metabolites are detectable for a longer period than those of most other drugs, this finding is consistent with survey results and so appears reliable. Variations in the positive rate were observed across regions of the country (with the highest in the West) and type of industry (with construction highest).
ORGANIZATION-SPECIFIC PREVALENCE STUDIES
Another source of data about drug use in the work force is a set of recent studies of the prevalence of alcohol and other drug use within single organizations. However, these studies as a group have significant limitations. Because many private corporations do not want to publicize information on alcohol and other drug use within their organizations, the published research involves mainly government employees (Postal Service, military, and municipal employees) and employees of utility companies. Moreover, these studies have seldom been designed to estimate prevalence of employee alcohol and other drug use or the characteristics of employees using alcohol and other drugs. Rather they report results from company drugtesting programs from which it is possible to make certain inferences regarding the extent of employee alcohol and other drug use, the kinds of drugs used, and the characteristics of at-risk employees. Because these data are less than ideal, the inferences are limited and most must be put forth tentatively.
A brief list of organization-specific studies and a summary of each study's results is provided in Table 3.8.
U.S. Postal Service
Normand and others (Normand and Salyards, 1989; Normand et al., 1990) studies drug test results of 5,465 job applicants to the U.S. Postal Service and followed the careers of those who were hired. The drug tests
TABLE 3.8 Organization-Specific Prevalence Studies
Study | Sample | Measures | Results |
Normand et al. (1990) | Applicants to U.S. Postal Service from 21 sites | Preemployment urine test | 9.4% positive for illicit drug; 6.2 % for marijuana, 2.6% for cocaine, 0.2% for other drugs; blacks, males, aged 25-35 more likely to test positive |
Zwerling et al. (1990) | Applicants to U.S. Postal Service in Boston | Preemployment urine test | 8% positive for marijuana, 2% for cocaine, 2% for other drugs; males more likely to test positive for marijuana but less likely for cocaine and other drugs; blacks more likely to test positive for marijuana and cocaine |
Parish (1989) | Hospital hires | Preemployment urine test | 12% positive for drug use; clerical/aide positions more likely to test positive; young males more likely to test positive |
Lehman et al. (1990a) | Municipal employees | Self-report substance use on and off the job and voluntary urine test | 12.6% tested positive; 9.6% for marijuana, 2.8% for cocaine, 2.8% for other drugs; 38% reported last year alcohol use, 14% reported getting drunk weekly; 7% drink at work, 17% report alcohol-related problems; 22% report lifetime marijuana use, 6% lifetime cocaine; 7% report last year marijuana use, 3% last year cocaine use; 2% report use at work |
Lehman et al. (1990b) | Municipal Housing Authority employees | Self-report substance use on and off the job | 38% report weekly use of alcohol in last year, 15% get drunk weekly; 11% report alcohol use at work, 13% report alcohol-related problems; 13% report lifetime marijuana use, 7% other illicit drug use; 4% report last-year marijuana use, 3% other illicit drug use |
Rosenbaum et al. (1992) | Municipal employees | Self-report substance use on and off the job | 25% report weekly use of alcohol in last year, 8% get drunk weekly; 19% report alcohol-related problems, 6% drink at work; 27% report lifetime marijuana use, 10% lifetime cocaine use; 5% report last year marijuana use, 2% cocaine use |
Blank and Fenton (1989) | Navy recruits | Preemployment urine test | Recruits testing positive for THC less likely to be high school graduates, more likely to be black, and test lower on intelligence tests |
McDaniel (1988) | Navy recruits | Self-report drug use | 40% report lifetime marijuana use, 13% more than 10 times, 5% 50 or more times; 13% report stimulant use, 3% 10 or more times; 5% report cocaine use, 5% report depressant use |
Taggart (1989) | Railroad applicants and employees | Preemployment, scheduled, for cause, and postaccident urine testing | Overall positive rates from 22% in 1984 falling to 5.8% in 1987; 12.3% positive for marijuana in 1984, 2.5% in 1987; 4.6% for cocaine in 1984, less than 1% in 1987 |
Sheridan and Winkler (1989) | Power company employees | Preemployment, scheduled, and for cause urine testing | In 1986, 13.4% positive, 4.8% for THC, 2.2% for cocaine, 6.5% for other drugs; in 1987, 14.8% positive, 5.2% for THC, 1.6% for cocaine, 7.9% for other drugs |
Study | Sample | Measures | Results |
Osborn and Sokolov (1989) | Nuclear plant employees | Employee urine tests | 3% drug test failure in November, 1988, less than 2% per month thereafter; higher for contract than for permanent employees; 40% of positives for marijuana, 31% for amphetamines, 29% for cocaine |
Crouch et al. (1989) | Power company applicants | Preemployment, for cause, and for promotion urine tests | 2.8% positive, all but 1 for marijuana; positives more likely to be skilled/technical and male |
Cook and Bernstein (1991) | Manufacturing plant employees | Self-report and voluntary urine test | 10.3% reported illicit drug use last 6 months, 12.1% when interviewed at work, 6.4% in group administration, 11% for telephone interview, 11% for offsite interview; 8.1% for drug tests; 4.2% who denied drug use tested positive, 14.5% overall prevalence rate; 9.5% prevalence rate for marijuana, 1.6% for cocaine, 1.9% for amphetamines |
were conducted strictly for research purposes and the results were known only to research staff.
Overall, 10 percent of applicants tested positive for at least one illicit drug; 7 percent were positive for marijuana, 3 percent for cocaine, and 1 percent for one of the other drugs. The odds of being positive were higher for blacks, men, and applicants between the ages of 25 and 35. Blacks were more than twice as likely as whites (15 compared with 7 percent) to test positive: they were more than six times as likely to test positive for cocaine and almost twice as likely to test positive for marijuana. Men were about 1.5 times as likely to test positive for marijuana than were women, but there were no gender differences for cocaine.
Zwerling et al. (1990) also report on a prospective study of Postal Service applicants, although their study was limited to applicants in the Boston, Massachusetts, area. As in the Normand et al. (1990) study, applicants submitted a urine specimen that was tested for drugs, the results of which, with the exception of opiates, were confined to the research team and not used in making hiring decisions. Of 4,764 applicants, 7 percent tested positive for marijuana, 2 percent for cocaine, and 3 percent for other drugs. Men were more likely than women to test positive for marijuana but less likely than women to test positive for cocaine and other drugs. Blacks were more likely than whites to test positive for marijuana and cocaine.
Hospital Employees
A study of research-oriented preemployment urine testing is reported by Parish (1989). All employees (N = 180) hired at a large teaching hospital over a 6-month period were included in the study: 12 percent tested positive for drug use. Because of the small number of employees testing positive, no breakdown by drug type was provided. Employees in clerical/aide positions were more likely than others to test positive. Drug-positive employees were also more likely to be young and male.
Municipal and Housing Authority Workers
In a study of 1,795 municipal employees in a large city in the southwest United States, Lehman et al. (1990a) administered a paper-and-pencil questionnaire to obtain self-reports of alcohol and other drug use. In addition, 500 urine specimens were collected from randomly chosen work groups. The urinalysis data indicated that 13 percent of participants tested positive for at least one drug. This included 10 percent for marijuana, 3 percent for cocaine, and 3 percent for other drugs such as opiates, amphetamines, and benzodiazepines. Two or more drugs were detected in specimens of 3 percent of the sample. Some 77 percent reported using alcohol during the
past year, 38 percent admitted to drinking at least weekly, 49 percent reported getting drunk in the last year, and 14 percent reported getting drunk at least weekly.
A study of 343 employees of a housing authority from the same southwest U.S. city as the municipal worker study, using the same methods and questionnaire, showed similar results (Lehman et al., 1990b). Overall, 75 percent of the housing authority employees reported using alcohol in the last year, 38 percent reported weekly use or more, and half reported getting drunk in the last year, with 15 percent getting drunk at least weekly.
Reports of illicit drug use were generally lower than they were for municipal employees: 13 percent reported any marijuana use in their lifetime, and 7 percent reported lifetime use of other illicit drugs. Only 4 percent reported marijuana use in the past year, with 3 percent reporting other illicit drug use; 4 percent of the sample reported illicit drug use in the past month.
A survey of 1,081 municipal workers from a second large city in the Southwest showed similar patterns of drug use (Rosenbaum et al., 1992). Overall, 74 percent reported alcohol use in the past year, with 25 percent using it at least weekly; 32 percent reported getting drunk in the last year, with 8 percent getting drunk at least once per week.
Naval Recruits
Blank and Fenton (1989) examined urinalysis results for 1,052 Navy recruits who were tested at the Great Lakes Recruit Training Center between January 2 and March 4, 1985. There were significant differences between the groups testing positive and negative for marijuana on education, race, and scores on the Armed Forces Qualification Test (AFQT). The group testing positive for marijuana included 13 percent who did not graduate from high school, compared with 6 percent of the group testing negative. The positive-testing group included 23 percent blacks; the negative-testing group was 13 percent blacks. On AFQT scores, positive-testing recruits scored significantly lower than the negative-testing groups. There were no differences on age (due perhaps to a limited age range), marital status, or geographic region.
McDaniel (1988) examined self-reported drug use among 10,188 applicants who completed the Educational and Biographical Information Survey within a year of entering the Navy. A series of questions on the survey asked about previous use of marijuana and other illicit drugs and frequency of use. Overall, about 40 percent of the recruits admitted to having used marijuana before entering the Navy, 13 percent having used it at least 10 times and 5 percent admitting to marijuana use on at least 50 different occasions. Use of stimulants was reported by 13 percent, with 3 percent
having used them at least 10 times. Finally, both cocaine and depressant use was revealed by 5 percent of the respondents with less than 1 percent in each case admitting to use at least 10 times.
Utility Employees
Taggart (1989) described the results of a drug-testing program at the Southern Pacific Railroad. Testing was conducted for all applicants for employment in conjunction with regularly scheduled physical exams, for reasonable suspicion, and for personnel involvement in accidents regardless of obvious cause. Of those tested, 23 percent were positive in 1984, 12 percent in 1985, 5 percent in 1986, and 6 percent in 1987. No breakdown by demographic characteristics were provided.
Sheridan and Winkler (1989) examined data from the drug-testing program at the Georgia Power Company, which included preemployment testing, testing for cause, and regular testing of nuclear plant and security personnel, both as part of the security clearance process and as part of annual physical examinations. In 1986, in a work force of about 15,000, 463 drug tests were conducted. Of these, 13 percent were positive, with 5 percent positive for marijuana, 2 percent for cocaine, and 6 percent for other drugs. In 1987, 366 tests were conducted, resulting in 15 percent positives (5 percent for marijuana, 2 percent for cocaine, and 8 percent for other drugs). Those in skilled and technical job classes were more likely than others to test positive, as were younger employees and employees hired after 1983.
Results from the drug-testing program at Southern California Edison's San Onofre Nuclear Generating Station (SONGS) are provided by Osborn and Sokolov (1989, 1990) for the period November 1988 to November 1989. During the first months, positive drug tests initially occurred at a rate of 3 percent, but the rate quickly fell to less than 2 percent per month for the remainder of the study. Rates of positive test results were considerably higher for contract workers than for SONGS employees. Positive rates for SONGS employees remained under 2 percent for the entire study period but were more variable among the contract workers, reaching a high of 5 percent. Osborn and Sokolov suggest that the difference exists because contract workers generally have less to lose from positive tests, as they can often find work at another site, but SONGS employees face a 14-day suspension and 1-year mandatory treatment program.
Crouch et al. (1989) examined the drug-testing and employee assistance programs at the Utah Power and Light Company in order to evaluate the cost-benefit ratios of the programs. Data from 1986 and 1987 were examined. A total of 1,036 drug tests were conducted during the period that included preemployment, for-cause, and promotion tests. There were 28
positive tests, for a prevalence rate of 3 percent. All but one of the positive tests involved marijuana. Demographically, those testing positive were likely to be male (75 percent), to have a mean age between 32 and 37, and to have worked as a laborer, operator, or craftsman.
Manufacturing
Cook and Bernstein (1991) reported on a study of a large manufacturing facility in the western United States with a work force of 2,400 primarily male blue-collar employees. Their study's goal was to assess the validity of different self-report methods for measuring employee illicit drug use. Four different self-report conditions were studied, and 200 employees were randomly selected and assigned to each of the four conditions: (1) individual interview in the workplace, (2) questionnaire administration in small groups, (3) telephone interviews away from work, and (4) individual interviews off the work site. Urine samples were also collected from all subjects at the time of the self-report data collection.
By condition, the prevalence rates were 12 percent for individual interviews at work, 6 percent for group administration, 11 percent for telephone interviews, and 12 percent for off-site interviews. These results indicate little difference between the three individual interview conditions, but lower reporting of illicit drug use in the group administration condition. Urinalysis indicated an 8 percent positive rate across all four conditions. The combination of self-report and urinalysis produced the most complete picture of the overall level of illicit drug use among the work force.
Summary
The reported literature on organization-specific studies of alcohol and other drug use prevalence provides a very sketchy picture of use within organizations. Few studies were designed specifically to examine prevalence or include both self-report and urinalysis data. Most of the other studies were designed for some other purpose, such as assessing the validity of preemployment selection or assessing the effectiveness of drug-testing programs. However, reports from these programs often did not differentiate between preemployment, random, and for-cause testing, so it is virtually impossible to compare results from organization to organization or to assess drug use prevalence. Programs that include a higher proportion of for-cause testing will have higher rates of positives, but they do provide some information about the types of drugs most likely to be detected. Data from random testing programs are also suspect because selection for testing is typically confined to certain job categories, it is often not done truly at
random, and in practice employees are often aware of impending tests before they are officially informed they must take them.
OTHER PREVALENCE STUDIES OF ALCOHOL AND OTHER DRUG USE IN THE WORKPLACE
Few businesses have systematically studied the problem of on-the-job alcohol and other drug use. As was mentioned in Chapter 2, it is often assumed rather than proven that those who use alcohol and other drugs away from work will also do so on the job or in close enough proximity to affect workplace performance. Studies showing the prevalence of alcohol and other drug use by workers and job applicants are thought to shed light on alcohol and other drug use in the workplace, although they do not specifically or necessarily relate to this problem. Thus, the actual extent of alcohol and other drug use at work remains debatable.
Some articles in the popular press suggest that ''everyone's doing it," but there are personnel experts who believe that the furor about alcohol and other drug use on the job reflects exaggerations by the media and other sources (e.g., Gordon, 1987). But it is not just the media estimates that may be excessive. For instance, Backer (1987) reports that "experts estimate that between 10 and 23 percent of all U.S. workers use dangerous drugs on the job." Such estimates are, however, based on best guesses rather than reliable assessment of alcohol and other drug use on the job. Furthermore, such estimates are typically based on two types of data, which, if not adequately discounted, overstate the problem (Alden, 1986): (1) information from addicted individuals seeking treatment who admit to having used alcohol or other drugs on the job and (2) estimates of the prevalence of alcohol or other drug problems among individuals in various occupations.
Washton and Gold (1987), for example, found that 75 percent of the callers to the national cocaine hotline (800-COCAINE) had used some drugs on the job. Not surprisingly, cocaine was the most prevalent drug used in the workplace by the callers, and 92 percent had done their job while under the influence of some drug. Similarly, Levy (1973) found that all but 2 of a group of 95 former addicts had used some drugs on the job. In both cases, the figures tell us only what a small group of severe abusers have done, and there is no simple way to generalize findings from such respondents to workers in general.
We were able to find only 15 studies that report rates of on-the-job alcohol and other drug use among specialized, general, and community samples. These studies cannot be readily compared because they vary greatly with respect to samples, job types, periods of assessment, definitions of at work, and type of substance. At best, these studies provide only preliminary estimates of the extent of alcohol and other drug use on the job or being
high at work. Table 3.9 summarizes their results. We describe each briefly below.
Canadian Facts (1991) reported that 22 percent of 13,234 Canadian employees reported using alcohol on the job or having their job affected by alcohol use in the past month prior to the survey. Decima (1990) examined self-reports of on-the-job alcohol and illicit substance use during the past month for four types of Canadian mariners (private and public shore workers and private and public fleet workers). Findings showed that: (1) 12 percent of private shore workers reported using alcohol and 1 percent acknowledged using an illicit drug; (2) 5 percent of private fleet workers reported using alcohol and 1 percent reported using an illicit drug; (3) 8 percent of public shore workers admitted using alcohol and less than 0.5 percent reported using an illicit drug; and (4) 7 percent of public fleet employees reported using alcohol and 2 percent admitted using an illicit drug.
Gleason et al. (1991) analyzed data from 12,069 individuals from the National Longitudinal Survey of Youth regarding drug use on the job during the past year. Their findings indicate that in 1984, 7 percent of the U.S. work force aged 19-27 had used illicit drugs on the job. Men were more likely to report a higher use (10 percent) than women (4 percent), and white respondents were substantially more likely to report using drugs in the workplace than blacks or Hispanics. Moreover, this study reports that illicit drug use among young workers varies considerably by occupational group, with blue-collar workers reporting a much higher rate of on-the-job illicit drug use than white-collar workers. Specifically, craftworkers, operatives, and laborers all had rates of more than 9 percent compared to 5 percent for professional workers. By industry type their analyses show that the entertainment/recreational (14 percent) and construction industries (13 percent) had the highest rates of illicit drug use on the job, whereas professional services and public administration industries had the lowest, 3 percent and 2 percent, respectively. With regard to alcohol use at work, these researchers asked respondents whether they ever got drunk on the job. The difference between the percentage of men who reported having got drunk was significantly larger that the percentage of women who reported doing so (4 compared to 2 percent). Unfortunately most of the alcohol questions contained in this survey dealt with subjective judgments concerning the effects of alcohol use rather than actual on-the-job alcohol use.
Guinn (1983) studied self-reports from 112 long-distance truckers and found that over 80 percent had used some drug (excluding over-the-counter medications) to stay awake and alert while trucking during the past year. Holcom et al. (1991) found that 13 percent of 367 workers in safety-sensitive jobs reported using a psychoactive drug on the job compared with 8 percent of 687 workers in low-risk positions. Hollinger (1988) examined the use of any drug on the job during the past year for large samples
TABLE 3.9 Prevalence of Drug Use on the Work Site
Study | Type of Sample | N | Reporting Period | Any Drug | Alcohol | Any Illicit Drug | Marijuana | Cocaine |
Canadian Facts (1991) | Canadian employees | 13,234 | Past month | — | 22.0 | — | — | — |
Decima (1990) | Canadian mariners | Private | Past month |
|
|
|
|
|
|
| 243 (share) |
| — | 12.0 | 1.0 | — | — |
|
| 1,645 (fleet) |
| — | 5.0 | 1.0 | — | — |
|
| Public | Past month |
|
|
|
|
|
|
| 550 (share) |
| — | 8.0 | 0.0 | — | — |
|
| 828 (fleet) |
| — | 7.0 | 2.0 | — | — |
Gleason et al., | National youth | 12,069 | Past year |
|
|
|
|
|
(1991) |
| men |
| 9.5 | — | — | — | — |
|
| white |
| 10.1 | — | — | — | — |
|
| black |
| 6.7 | — | — | — | — |
|
| Hispanic |
| 6.5 | — | — | — | — |
|
| women |
| 4.2 | — | — | — | — |
|
| white |
| 4.5 | — | — | — | — |
|
| black |
| 2.8 | — | — | — | — |
|
| Hispanic |
| 2.9 | — | — | — | — |
Guinn (1983) | Long-distance truckers | 112 | Past year | 80.4 | — | — | — | — |
Study | Type of Sample | N | Reporting Period | Any Drug | Alcohol | Any Illicit Drug | Marijuana | Cocaine |
Holcomb et al. (1991) | Municipal employees | 367 (high risk) | Past year | 13.0 | — | — | — | — |
|
| 687 (low risk) | Past year | 8.0 | — | — | — | — |
Hollinger (1988) | Retail employees | 3,512 | Past year | 7.6 | — | — | — | — |
| Manufacturing employees | 1.484 | Past year | 12.8 | — | — | — | — |
| Hospital employees | 4,040 | Past year | 3.2 | — | — | — | — |
O'Malley (1992) | High school seniors | c.8,000 men | Past year | — | 8 | — | 5 | — |
| Women | c.8,000 | Past year | — | 5 | — | 1 | — |
Lehman and Simpson (1992) | Municipal workers | 1,325 | Past year | 10 | — | — | — | — |
Lehman et al. (1990) | Municipal employees | 1,239 (men) | Past year | — | 8.0 | 3.0 | — | — |
|
| 556 (women) | Past year | — | 3.0 | 1.0 | — | — |
Martin et al. (in press) | National youth | not given | Not given |
|
|
|
|
|
|
| mena |
| — | 4.2 | — | 7.1 | 1.4 |
|
| womena |
| — | 1.6 | — | 2.3 | 0.8 |
Mensch and Kandel (1988) | Young adult men | 5,299 | Past month | — | 5.0 | — | 8.0 | 2.0 |
Newcomb (1988) | Young adults (M age = 22) | 221 men | Past 6 months | 39.4 | 28.5 | — | 22.5 | 9.5 |
|
| 518 (women) | Past 6 months | 27.2 | 13.9 | — | 14.3 | 9.3 |
Newcomb (1989) | Adults (M age = 26) | 154 men | Past 6 months | 27 | 24 | — | 13 | 8 |
|
| 391 (women) | Past 6 months | 13 | 9 | — | 6 | 3 |
Schneck et al. (1991) | Transportation employees | 120,000 | Not specified | — | 6 | 3 | — | — |
White et al. (1988) | Commuting employees | <225b | Past year |
|
|
|
|
|
|
| men |
| — | 7.1b | — | 31.9b | — |
|
| women | Past year | — | 1.6b | — | 23.3b | — |
a These were reported separately for part-time and full-time employees. Although Ns were not reported for these breakdowns, the percentages cited are equal-weighted averages of these two groups. b Precise Ns for men and women workers were not provided. Prevalence rates were based on past year users of each drug. | ||||||||
representing three occupational groups and found that: (1) 8 percent of retail employees reported some drug use on the job; (2) 13 percent of manufacturing employees reported such behavior; as did (3) 3 percent of hospital employees. Lehman and Simpson (1992) found that 10 percent of 1,325 municipal workers admitted using some illicit drug on the job.
Results showed that 8 percent of 1,239 men and 3 percent of 556 women reported using alcohol on the job, while 3 percent of the men and 1 percent of the women reported some illicit drug use in the workplace.
Mensch and Kandel (1988) studied data from large samples of young adults. Among the 5,299 men, 5 percent admitted using alcohol in the workplace, 8 percent had used marijuana, and 2 percent had used cocaine. Of the 4,860 women, 1 percent reported being high on alcohol on the job, 3 percent on marijuana, and 1 percent on cocaine. Martin et al. (in press) also examined national samples of youth, looking separately at part-time and full-time employees. Those who were employed full time reported higher rates of using alcohol, cocaine, and marijuana on the job than those who worked part time. Unfortunately, sample sizes were not provided in this report, although based on the data set used, the numbers should be in the thousands. Estimates of drug use on the job for men (4 percent for alcohol, 7 percent for marijuana, and 1 percent for cocaine) were consistently and substantially higher than those for women (2 percent for alcohol, 3 percent for marijuana, and 1 percent for cocaine). Schneck et al. (1991) examined responses from about 120,000 transportation employees and found that 6 percent had used alcohol at times that would interfere with their job, and 3 percent reported a similar use of illicit drugs.
Newcomb (1988) studied a community sample of 739 young adults and found that among the 221 men, 39 percent reported being "high, drunk, or stoned" on the job at least once during the past 6 months: 29 percent had used alcohol, 23 percent marijuana, 10 percent cocaine, and 6 percent other stimulants. Among the 518 women in the sample, 27 percent reported having been high, drunk, or stoned on the job: 14 percent had used alcohol, 14 percent marijuana, 9 percent cocaine, and 5 percent other stimulants. This same sample was assessed 4 years later with substantially reduced rates of being high, drunk, or stoned on the job (Newcomb, 1989). Of the 154 men whom Newcomb was able to follow, 27 percent had been high on a psychoactive drug in the workplace, with 24 percent reporting alcohol use, 13 percent marijuana use, 8 percent cocaine use, and 3 percent other stimulants. Among the 391 women in the follow-up survey, 13 percent reported using any psychoactive substance on the job, with 5 percent reporting use of alcohol, 6 percent marijuana, 3 percent cocaine, and 1 percent other stimulants.
The different prevalence rates reported by different studies are probably due to the variations in questions asked, samples used, and occupations
represented. For instance, long-distance truckers who are paid for the miles they drive may be particularly susceptible to using drugs that will keep them awake, help them drive farther, and earn them more money. Similarly, some of the samples surveyed may consist of people who hold nontraditional attitudes and engage in more atypical behavior than other adults. Newcomb's particularly high prevalence rates may not only reflect the nature of his sample but may also have been due in part to asking participants whether they have been "drunk, high, or stoned," on the job rather than whether they "had used drugs" on the job. This question captures people who while on the job felt the effects of drugs taken before work, during breaks, at lunch, as well as those affected by drugs taken during work hours. If so, this question more adequately assesses the proportion of the work force whose performance might be affected by drugs than does the more commonly asked inquiry into on-the-job drug use.
This is one reason that may explain why White et al. (1988) obtained such high rates of workplace drug use, since their items asked respondents whether they had gone to work "high" on alcohol or marijuana during the past year. Of employed men who used marijuana during the past year, 32 percent reported going to work high on marijuana at least once in the past year, whereas only 7 percent of men who reported drinking reported going to work high on alcohol in the past year. Rates for women were substantially smaller, with 23 percent of current marijuana users admitting to having gone to work high on marijuana and 2 percent of current drinkers reporting showing up at work high on alcohol. Since these figures are based only on users of the particular drug, they do not mean that a large proportion of workers in general show up for work high.
Often data from the HHS and the MWS (discussed earlier in this chapter) also report drug use on the job. Since those studies have been discussed earlier, they are not repeated here. They showed, however, that alcohol use was the most commonly used drug at work and that illicit drug use at work is relatively low. The HSS survey assessed alcohol and other drug use at work by asking respondents in the follow-up surveys if they had used a given drug at work during the past year. Unfortunately, the meaning of the term at work was not further specified. Table 3.10 reports data on substance use at work from the 1987 through 1991 follow-up surveys. As depicted in Table 3.10, alcohol is the substance most often used at work. More specifically, in 1991 alcohol had the highest on-the-job prevalence rate, with 8 percent of the men and 5 percent of the women reporting having used alcohol at work in the past 12 months. Illicit drugs have never been used at work by a large proportion of the work force, and the proportion has decreased substantially in recent years. Marijuana was the second most prevalent drug, with use at work reported by 5 percent of the men and 1 percent of the women in 1991. Less than 1 percent of this sample used any
TABLE 3.10 Trends in Alcohol and Other Drug Use at Work, Past 12 Months, Young Adults Aged 19-28 (in percent)
| Year of Survey | ||||
Substance/Sex | 1987 | 1988 | 1989 | 1990 | 1991 |
Alcohol |
|
|
|
|
|
Male | 12.2 | 7.0 | 9.0 | 8.8 | 7.6 |
Female | 7.7 | 6.3 | 5.4 | 6.0 | 4.6 |
Marijuana |
|
|
|
|
|
Male | 8.0 | 5.6 | 5.1 | 4.6 | 4.5 |
Female | 1.5 | 1.6 | 1.5 | 1.2 | 0.9 |
Cocaine |
|
|
|
|
|
Male | 2.9 | 2.7 | 1.5 | 1.6 | 0.5 |
Female | 1.0 | 2.3 | 0.5 | 1.1 | 0.3 |
Amphetamines |
|
|
|
|
|
Male | 2.9 | 2.8 | 1.5 | 1.6 | 0.4 |
Female | 3.0 | 2.0 | 2.0 | 1.3 | 0.8 |
Tranquilizers |
|
|
|
|
|
Male | 0.8 | 0.3 | 0.5 | 0.3 | 0.2 |
Female | 1.0 | 0.5 | 0.1 | 0.4 | 0.3 |
SOURCE: Unpublished data from the High School Senior Surveys (1992). | |||||
other illicit drug on the job. Cocaine use at work was reported by 0.5 percent of the men and by 0.3 percent of the women. Corresponding figures for amphetamines were 0.4 and 0.8 percent and for tranquilizers, 0.2 and 0.3 percent. The figures from the HSS follow-ups are likely to underestimate true prevalence of drug use in the work force, since high school dropouts are not in the sample and, like all longitudinal studies, the HSS suffers from attrition; however, the trends nevertheless seem clear: drug use is declining among the broad spectrum of youth, both in general and at work.
The HHS follow-ups show that alcohol and other drug use at work also varies with occupation. In general, protective services workers (police, fire fighters) show very low rates of use at work, and skilled workers show relatively high rates, with little variation across the other categories (Table 3.11). Alcohol use at work (at least once in the previous 12 months) is highest for men in the skilled and managerial categories; professionals and semiskilled workers are also high in their use rates. Controlling for occupation, women are only slightly less likely than men to have used alcohol at work, and among clericals female use rates are slightly higher.
The findings in several studies that more respondents admit to using
TABLE 3.11 Use of Alcohol and Other Drugs at Work in Past 12 Months, Young Adults Aged 19-28 by Occupational Category (in percent)
Sex/Occupation | Alcohol | Marijuana | Cocaine | Amphetamines | Tranquilizer |
Males | |||||
Semiskilleda | 9.6 | 9.5 | 2.6 | 3.4 | 0.8 |
Clerical, salesb | 4.2 | 3.4 | 1.8 | 1.4 | 0.5 |
Police, firec | 3.6 | 1.3 | 0.0 | 0.9 | 0.0 |
Militaryd | 5.8 | 1.1 | 0.7 | 1.4 | 0.0 |
Skillede | 11.3 | 9.2 | 3.6 | 2.4 | 0.5 |
Manager, sales repf | 10.1 | 2.8 | 0.8 | 1.4 | 0.4 |
Professionalg | 8.5 | 2.8 | 1.4 | 0.5 | 0.3 |
Females |
|
|
|
|
|
Semiskilleda | 6.8 | 2.7 | 1.2 | 3.0 | 0.5 |
Clerical, salesb | 6.0 | 1.6 | 1.6 | 1.9 | 0.2 |
Police, firec | 0.0 | 0.0 | 0.0 | 3.2 | 0.0 |
Militaryd | 5.4 | 0.0 | 0.0 | 3.2 | 0.0 |
Skillede | 7.0 | 4.8 | 1.0 | 4.0 | 2.9 |
Manager, sales repf | 7.9 | 0.5 | 1.1 | 0.0 | 0.9 |
Professionalg | 5.0 | 0.2 | 0.1 | 0.6 | 0.4 |
a Semiskilled: laborer (car washer, sanitary worker, farm laborer); service worker (cook, waiter, barber, janitor, gas station attendant, practical nurse, beautician); operative or semi-skilled worker (garage worker, taxicab, bus or truck driver, assembly line worker, welder). b Clerical, sales clerk: sales clerk in a retail store (shoe salesperson, department store, drug store); clerical or office worker (bank teller, bookkeeper, secretary, typist, postal clerk or carrier, ticket agent). c Police, fire; protective service (police officer, fireman, detective). d Military; military service. e Skilled; craftsman or skilled worker (carpenter, electrician, brick layer, mechanic, machinist, tool and die maker, telephone installer) .f Manager, sales rep; farm owner, farm manager; owner of a small business (restaurant owner, shop owner); sales representative (insurance agent, real estate broker, bond salesman); manager or administrator (office manager, sales manager, school administrator, government official). g Professional: professional with doctoral degree or equivalent (lawyer, physician, dentist, scientist, college professor). SOURCE: Unpublished data from the High School Senior Surveys (1992). | |||||
marijuana than alcohol in the workplace is surprising, since alcohol is in general the most frequently used drug at the work site. This discrepancy is probably a sample artifact, as in the White et al. (1988) study in which respondents were limited to those who had used the illicit drug.
Summary
Prevalence estimates vary greatly across studies, although alcohol or marijuana are consistently the most prevalent drugs used in the workplace. Nevertheless, three conclusions can be drawn that are also consistent with findings from large-scale survey findings. First, according to employee reports, drug use in the workplace ranges from a modest to a moderate extent (although much of the reported use may be single incidents, perhaps even at events like office parties). Second, men are more likely than women to use drugs in the workplace. And third, the highest rates of workplace drug use seem to be among young adults, with use decreasing substantially with increasing age.
CONCLUSIONS AND RECOMMENDATIONS
Data sources ranging from self-report questionnaires to urinalysis testing to emergency room visits provide important insights about the use of alcohol and other drugs among members of the general population and the work force. Taken together, the data indicate that, since the late 1970s:
The prevalence of illicit drug use among members of the general population and the work force has been decreasing, but continues to affect a sizable proportion of the population, especially young adults.
Illicit drug use may be decreasing among occasional users, but it may be stable or even increasing among hard-core users who are generally not well represented in surveys.
Heavy alcohol use has been relatively stable over the past several years; rates of heavy drinking have been notably high among young adult men, especially those in the military and among workers in such industries as construction, transportation, and wholesale goods.
Cigarette smoking has been declining during the past decade for those 18 and older, but has been relatively stable for youths ages 12 to 17.
Illicit drug use is more common among unemployed than employed persons, and weekly alcohol use is highest among young employed workers.
Illicit drug use is relatively high among male workers in certain industries, such as construction, but relatively low among professionals.
Given these long-term trends, we must be cautious in attributing short-term changes in alcohol and other drug use in either society or the work force to specific national efforts to stem the use of drugs.
Few epidemiological studies are targeted directly at the work force, leaving researchers to rely on data sources designed for other uses.
Recommendation: More focused epidemiological studies, including longitudinal studies, are needed to assess the magnitude and severity of alcohol and other drug use among the work force. As a first step, the National Household Surveys on Drug Abuse should be modified to provide specific information about job characteristics, job-related behaviors, and alcohol and other drug use at work. Ultimately a national panel survey devoted to this topic should be instituted. In addition, other studies are needed that provide better information about: (1) employment patterns among persons who use alcohol and other drugs; (2) patterns of alcohol and other drug use among workers; (3) patterns of use in heavily using populations to better understand the employment history and work experience of these individuals; and (4) the impact of illicit drug use and heavy alcohol use on work activity.
Although the workplace offers a unique opportunity to obtain leverage on the alcohol and other drug problems of some users, there are many serious alcohol and other drug abusers who are not regularly employed, if they are employed at all. In 1990 approximately 7 percent of workers reported having used an illicit drug and approximately 6 percent reported having drunk heavily in the past month, compared with 14 percent and 6 percent, respectively, for the unemployed.
Given the relative low base rate of alcohol and other drug abusers in the employed segment of the work force compared with other selected populations, postemployment workplace alcohol and other drug interventions may help a limited number of abusers, but workplace-oriented interventions cannot solve society's problems with alcohol and other drugs.
Alcohol and tobacco are the drugs most widely abused by members of the U.S. work force. The adverse health consequences of these drugs are well known. In terms of prevalence rates of work force use and perceived effects of use on performance, alcohol is more likely to have adverse consequences.
Recommendation: Any program that addresses drug use by the work force should include alcohol, the drug most associated with perceived detrimental job performance, as a priority.
Rates of self-reported alcohol and other drug use on the job vary according to occupation, age, gender, and ethnicity. Excluding tobacco and caffeine, most surveys find that fewer than 10 percent of workers report having used alcohol or other drugs while on the job during the prior year. Some studies, however, report significantly higher usage rates. Much of the
difference in the rates reported appears attributable to differences in the samples surveyed and the questions asked.
Recommendation: It is important to investigate alcohol and other drug use in different well-specified samples and to develop benchmark measures to allow findings that are comparable across studies.
REFERENCES
Alden, W.F. 1986 The scope of the drug problem: a national strategy. Vital Speeches of the Day 751-756.
Backer, T.E. 1987 Strategic Planning for Workplace Drug Abuse Problems. Rockville, Md.: National Institute on Drug Abuse.
Blank, D.L., and J.W. Fenton 1989 Early employment testing for marijuana: demographic and employee retention patterns. In S.W. Gust and J.M. Walsh, eds., Drugs in the Workplace: Research and Evaluation Data. NIDA Research Monograph 91. Rockville, Md.: National Institute on Drug Abuse.
Bray, R.M., M.E. Marsden, and M.R. Peterson 1991 Standardized comparisons of the use of alcohol, drugs, and cigarettes among military personnel and civilians. American Journal of Public Health 81:865-869.
Bray, R.M., L.A. Kroutil, J.W. Luckey, S.C. Wheeless, V.G. Iannacchione, D.W. Anderson, M.E. Marsden, and G.H. Dunteman 1992 1992 Worldwide Survey of Substance Abuse and Health Behaviors Among Military Personnel. Research Triangle Park, N.C.: Research Triangle Institute.
Canadian Facts 1991 Substance Use and the Work Place Survey of Employees. Ottawa, Canada: Canadian Facts.
Cook, R.F., and A.D. Bernstein 1991 Assessing Drug Abuse in the Workplace: A Comparison of Major Methods. Paper presented at the Drug-Free Workplace Conference, Washington, D.C.
Crouch, D.J., D.O. Webb, L.V. Peterson, P.F. Buller, and D.E. Rollins 1989 A critical evaluation of the Utah Power and Light Company's substance abuse management program: absenteeism, accidents, and costs. In S.W. Gust and J.M. Walsh, eds., Drugs in the Workplace: Research and Evaluation Data. NIDA Research Monograph 91. Rockville, Md.: National Institute on Drug Abuse.
Decima 1990 Final Report to Transport Canada on the Results for the Substance Use and Transportation Safety Study. Toronto, Canada: Decima Research.
Gerstein, D.R., andL.W. Green, eds. 1993 Preventing Drug Abuse: What Do We Know? Committee on Drug Abuse Prevention Research, Commission on Behavioral and Social Sciences and Education, National Research Council. Washington, D.C.: National Academy Press.
Gleason, P.M., J.R. Veu, and M.R. Pergamit 1991 Drug and alcohol use at work: a survey of young workers. Monthly Labor Review August:3-7.
Gordon, J. 1987 Drug testing as a productivity booster? Training 24:22-34
Guinn, B. 1983 Job satisfaction, counterproductive behavior and circumstantial drug use among long-distance truckers. Journal of Psychoactive Drugs 15:185-188.
Gust, S.W., and J.M. Walsh, eds. 1989 Drugs in the Workplace: Research and Evaluation Data. NIDA Research Monograph 91. Rockville, Md.: National Institute on Drug Abuse.
Gust, S.W., J.M. Walsh, L.B. Thomas, and D.J. Crouch, eds. 1990 Drugs in the Workplace: Research and Evaluation Data, Vol. II. NIDA Research Monograph 100. Rockville, Md.: National Institute on Drug Abuse.
Holcom, M.L., W.E.K. Lehman, and D.D. Simpson 1991 Employee Accidents: Influences of Personal Characteristics, Job Characteristics, and Substance Use. Unpublished manuscript, Institute of Behavioral Research, Texas Christian University, Fort Worth.
Hollinger, R.C. 1988 Working under the influence (WUI): correlates of employees use of alcohol and other drugs. Journal of Applied Behavioral Science 24:439-454.
Johnson, L.D., P.M. O'Malley, and J.G. Bachman 1992 Smoking, Drinking, and Illicit Drug Use Among American Secondary School Students, College Students, and Young Adults, 1975-1991, Vol. I and II. Rockville, Md.: National Institute on Drug Abuse.
Kopstein, A., and J. Gfroerer 1990 Drug use patterns and demographics of employed drug users: data from the 1988 Household Survey. Pp. 25-44 in S.W. Gust, J.M. Walsh, L.B. Thomas, and D.J. Crouch, eds., Drugs in the Workplace: Research and Evaluation Data, Vol. 2. NIDA Research Monograph 100. Rockville, Md.: National Institute on Drug Abuse.
Lehman, W.E.K., and D.D. Simpson 1992 Employee substance use and on-the-job behaviors. Journal of Applied Psychology 77:309-321.
Lehman, W.E.K., M.L. Holcom, and D.D. Simpson 1990a Employee Health and Performance in the Workplace: A Survey of Municipal Employees of a Large Southwest City. Institute of Behavioral Research, Texas Christian University, Fort Worth. 1990b Employee Health and Performance in the Workplace: A Survey of Employees of the Housing Authority in a Large Southwest City. Institute of Behavioral Research, Texas Christian University, Fort Worth.
Levy, S.I. 1973 A case study of drug-related criminal behavior in business and industry. In J.M. Sher, ed., Drug Abuse in Industry. Springfield, Ill.: Thomas.
Martin, J.K., J.M. Kraft, and P.M. Roman in press The extent and impact of alcohol and drug problems in the workplace. In S. McDonald and P. Roman, eds., Drug Screening in the Workplace: Research Perspectives . Washington, D.C.: Hemisphere.
McDaniel, M.A. 1988 Does pre-employment drug use predict on-the-job suitability? Personnel Psychology 41:717-729.
Mensch, B.S., and D.B. Kandel 1988 Do job conditions influence the use of drugs? Journal of Health and Social Behavior 29:169-184.
National Institute on Drug Abuse 1991 National Household Survey on Drug Abuse: Main Findings 1990. Rockville, Md.: National Institute on Drug Abuse.
Newcomb, M.D. 1988 Drug Use in the Workplace: Risk Factors for Disruptive Substance Use Among Young Adults. Dover, Mass.: Auburn House. 1989 Drug Use and Sensation Seeking: Latent-Variable Comparisons Among Adolescents. Paper presented at the Western Psychological Association meeting, Reno, Nevada.
Normand, J., and S.D. Salyards 1989 An empirical evaluation of preemployment drug testing in the United States Postal Service: interim report of findings. In S.W. Gust and J.M. Walsh, eds., Drugs in the Workplace: Research and Evaluation Data. NIDA Research Monograph 91. Rockville, Md.: National Institute on Drug Abuse.
Normand, J., S.D. Salyards, and J.J. Mahoney 1990 An evaluation of preemployment drug testing. Journal of Applied Psychology 75:629-639.
Osborn, C.E., and J.J. Sokolov 1989 Drug use trends in a nuclear power company: cumulative data from an ongoing testing program. In S.W. Gust and J.M. Walsh, eds., Drugs in the Workplace: Research and Evaluation Data. NIDA Research Monograph 91. Rockville, Md.: National Institute on Drug Abuse. 1990 Drug use trends in a nuclear power facility: data from a random screening program. In S.W. Gust, J.M. Walsh, L.B. Thomas, and D.J. Crouch, eds., Drugs in the Workplace: Research and Evaluation Data, Vol. II. NIDA Research Monograph 100. Rockville, Md.: National Institute on Drug Abuse.
Parish, D.C. 1989 Relation of the pre-employment drug testing result to employment status: a one-year follow-up. Journal of General Internal Medicine 4:44-47.
Parker, D.A., and T.C. Harford 1992 The epidemiology of alcohol consumption and dependence across occupations in the United States. Alcohol Health & Research World 16(2):97-105.
Rosenbaum, A.L., W.E.K. Lehman, E.K., Olsen, and M.L. Holcom 1992 Prevalence of Substance Use and its Association with Employee Performance Among Municipal Workers in a Southwestern City. Institute of Behavioral Research, Texas Christian University, Fort Worth.
Schneck, D., R. Amodei, and R. Kernish 1991 Substance Abuse in the Transit Industry. Washington, D.C.: Office of Technical Assistance and Safety.
Sheridan, J.R., and H. Winkler 1989 An evaluation of drug testing in the workplace. In S.W. Gust and J.M. Walsh, eds., Drugs in the Workplace: Research and Evaluation Data. NIDA Research Monograph 91. Rockville, Md.: National Institute on Drug Abuse.
Substance Abuse and Mental Health Services Administration 1993 National Household Survey on Drug Abuse: Main Findings 1991. Rockville, Md.: Substance Abuse and Mental Health Services Administration.
Taggart, R.W. 1989 Results of the drug testing program at Southern Pacific Railroad. In S.W. Gust and J.M. Walsh, eds., Drugs in the Workplace: Research and Evaluation Data. NIDA Research Monograph 91. Rockville, Md.: National Institute on Drug Abuse.
Washton, A.M., and M.S. Gold 1987 Recent trends in cocaine abuse as seen in the cocaine hotline. Pp. 10-22 in A.M. Washton and M.S. Gold, eds., Cocaine: Clinicians Handbook. New York: Guilford Press.
White, H.R., A. Aidala, and B. Zablocki 1988 A longitudinal investigation of drug use and work patterns among middle-class, white adults. The Journal of Applied Behavioral Science 4:466-469.
Wish, E. 1990U.S. drug policy in the 1990s: insights from new data from arrestees. 1992 International Journal of the Addictions 25:377-409.
Zwerling, C., J. Ryan, and E.J. Orav 1990 The efficacy of preemployment drug screening for marijuana and cocaine in predicting employment outcome. Journal of the American Medical Association 264:2639-2643.


