Applications of an Analytic Framework on Using Public Opinion Data for Solving Intelligence Problems: Proceedings of a Workshop (2022)
Chapter: 2 Hypothetical Applications of the Analytic Framework
2
Hypothetical Applications of the Analytic Framework
Charles Lau (co-lead expert contributor for the Analytic Framework and director of the International Survey Research Program at RTI International) invited expert contributors, paper authors, and members of the intelligence community (IC) to consider the following four hypothetical scenarios that an intelligence analyst might encounter as an exercise in applying the guidance from the foundational layer of the Analytic Framework (NASEM, 2022).
SCENARIO 1: EVALUATION OF POLITICAL SUPPORT IN A MULTI-ETHNIC COUNTRY
Lau provided an overview of the first scenario, which was developed by the workshop planning committee and is presented in Table 2-1.
Evaluation of Data Sources
Elizabeth Zechmeister (co-lead expert contributor for the Analytic Framework, and Cornelius Vanderbilt Professor of Political Science and director of the Latin American Public Opinion Project at Vanderbilt University) observed that because the research question was assigned to the analyst and data are available, the first step is to narrow the scope, with consideration for the quality and potential use of the data. To evaluate the credibility and soundness of each of the three datasets, she suggested that Rachel consult the first paper in the foundational layer of the Analytic Framework, “Drawing Inferences from Public Opinion Surveys: Insights
TABLE 2-1 Scenario 1
| Scenario | Description |
|---|---|
| IC analyst | Rachel is an early career IC analyst with limited background in survey research. |
| Country | Multi-ethnic, low-income country. |
| IC analyst task | Rachel is tasked with summarizing the public’s attitudes about the prime minister within 5 business days, with a focus on variation by ethnic groups. |
| Data sources available |
Rachel has access to the following:
Individual-level (micro) data are available for (1) and (2) but not (3). |
for Intelligence Reports,” by René Bautista (associate director of the Methodology and Quantitative Social Sciences department at NORC, University of Chicago).
Online Poll
Zechmeister posited that Rachel’s first inclination might be to eliminate the online poll owing to its low credibility (i.e., it is not conducted by an objective organization, the goal of study could likely have been to present a positive attitude toward the dominant political party, and no documentation exists of the data collection process or who conducted the poll) and low soundness (i.e., the sampling approach is nonprobability with limited coverage of those with low socioeconomic status, offering only a glimpse into the opinions of a fraction of the population of interest). Using Bautista’s rating system, Rachel would likely categorize the poll as “not credible, not sound” and notice that it is impossible to disaggregate the data to assess variation across ethnic groups.
William “Chip” Eveland (expert contributor for the Analytic Framework, and professor of communication and professor of political science [by courtesy] at The Ohio State University) noted that, depending on the nature of the country and the extent to which the results of the poll drift from the dominant party’s Website into public understanding, representations of public opinion often influence public opinion. While the online poll has many disadvantages and might not reliably portray actual public
opinion, it could still have value in showing Rachel what the population perceives as public opinion, which could shape future public opinion.
Scott Page (expert contributor for the Analytic Framework and John Seely Brown Distinguished University Professor of Complexity, Social Science, and Management at the University of Michigan) suggested that Rachel visit the Website and attempt to determine who ran the poll to see whether they had also run previous polls. As noted in the discussion of poll averaging in the Analytic Framework, a time series of bad polls can reveal a lot of information; even if the mean is wrong, the direction might be meaningful (NASEM, 2022).
He also noted that this poll will have both sampling and nonsampling errors; nevertheless, Rachel might still estimate the upper bound of the prime minister’s support, which could prove useful. He also advised that Rachel consider how proportions of ethnic groups have changed in the past 2 years. If they have been stable, the face-to-face survey conducted by the U.S. Department of State 2 years prior could be valuable; if the proportions have changed, the online poll could be beneficial in revealing a worst- or best-case scenario for the prime minister.
Zechmeister summarized that although the dataset is ranked low on both credibility and soundness, Rachel should not immediately dismiss it because it illuminates the information environment surrounding the population. Page remarked that in some cases, perception is reality. For example, in 2017 Delphi Analytica claimed that Kid Rock had more support for a Senate seat than the sitting senator Debbie Stabenow, an assertion that was widely spread through the media and took Stabenow’s team much time to counteract. Thus, it is important for Rachel to know that she could test quickly to determine whether the poll is gaining traction in the social media sphere and whether the perception matters.
Face-to-Face Survey
Eveland posited that to evaluate the data from the face-to-face survey, Rachel would consult “Drawing Inferences from Public Opinion Surveys: Insights for Intelligence Reports” as well as “Ascertaining True Attitudes in Survey Research,” by Kanisha Bond (assistant professor of political science at Binghamton University, State University of New York). The survey is of good quality, and face-to-face is a “gold standard” for representation, especially in a low-income country. The credibility of these data seems high, but the soundness could be questionable given the assigned task. He suggested that Rachel think carefully about three issues when evaluating the usefulness of this dataset:
- Considering that the goal is to describe public attitudes toward the prime minister and how they vary by a country’s ethnic groups, and
- Owing to the nature of the interviews, the interviewer effects could be amplified, especially when the ethnicities of the interviewer and interviewee are mismatched. Would consulting the available microlevel data, with the assistance of a colleague with more experience, help reveal any biases?
- Since the data were collected 2 years ago, is public opinion stable?
sample size is the central determinant of margin of error, which ethic subgroup can be described with what degree of accuracy?
Zechmeister added that Rachel could look at the documentation accompanying the data to understand how the questions were asked as well as the political climate (e.g., how openly people could express their opinions). This face-to-face survey could also provide a point of comparison for the approval rating with newer datasets.
Page explained that because the relative size of the ethnic groups is known and data on how much they support the prime minister are available, Rachel could calculate what the expected vote total should have been—resulting in a “budget balance” between support and electoral results. If Rachel has access to the questions asked, Page continued, she should ensure that the survey questions were not phrased to meet preconceived objectives. Perhaps more important, since Rachel is a novice, he suggested that she write down what she thinks the data will reveal before looking at them to prevent being biased; if the results do not align with her hypotheses, it might be worthwhile for her to consult with a senior analyst to understand whether the flaw is in the hypothesis or the data.
Mobile Phone Survey
Page commented that if the mobile phone survey is divided by ethnic group, it is likely both credible and sound; however, considering the commentary on survey language selection from Michele Gelfand (expert contributor for the Analytic Framework; John H. Scully Professor in Cross-Cultural Management and professor of organizational behavior, Stanford Graduate School of Business; and professor of psychology [by courtesy], School of Humanities and Sciences, Stanford University), a question arises about how to account for nonresponse that could have been caused by a language barrier. These cultural considerations could be intensified in the mobile phone survey.
Emphasizing the value of comparing datasets to deepen understanding, Page directed Rachel to review the Analytic Framework’s “Integrating Data Across Sources,” by Josh Pasek (associate professor of communication and media and political science, faculty associate in the Center for Political Studies, and core faculty for the Michigan Institute for Data Science at the
University of Michigan) and Sunghee Lee (research associate professor at the Institute for Social Research at the University of Michigan). It is also important for Rachel to consider any events of the past 3 months that could indicate that the mobile phone survey data are outdated, although Page noted that the mobile phone survey is still likely more useful than the face-to-face survey given its comparative timeliness.
Referencing both “Drawing Inferences from Public Opinion Surveys: Insights for Intelligence Reports” and “Ascertaining True Attitudes in Survey Research,” Eveland pointed out that mobile phone surveys allow people to avoid answering certain questions more easily than face-to-face surveys. He encouraged Rachel to pay close attention to the “do not know” or “refuse” answers in both the face-to-face and mobile phone surveys as a point of comparison to understand whether the survey mode influenced the results. However, he agreed with Page that the mobile phone survey is still likely to be more useful than the face-to-face survey given that it was conducted more recently.
Zechmeister anticipated that Rachel would spend the most time assessing this dataset, especially to gauge its soundness in relation to her specific goal. She also urged Rachel to think about the sample and mode effects. For example, was this a high-quality random-digit-dial survey, which is uncommon in this context, or did the survey firm draw from a list, which is more common, and what was the coverage? Zechmeister’s research indicates that samples can skew toward higher socioeconomic status groups with phone-based approaches; therefore, Rachel would consider whether the survey contains sufficient information on the sample and the available weights. “Drawing Inferences from Public Opinion Surveys: Insights for Intelligence Reports” provides evidence that suggests that people might be more honest over the phone than in-person. Zechmeister asserted that this might not hold when the person lives in an autocratic country that is believed to tap phones. In that case, the mobile phone survey could be more biased than the face-to-face survey owing to self-censoring. Page added that local uprisings should also be a point of concern—ongoing research explores the extent to which mobile phones make uprisings easier owing to increased connectivity. However, in some countries, 20–40 percent of the people do not have mobile phones, so the socioeconomic status bias within an ethnic group could be high.
Discussion
A representative from the IC pointed out that because she would not have time to analyze the sources as deeply within the 5-day window, prioritization would be necessary. She thought that the 2-year-old survey was outdated, especially since the question at hand relates to attitudes toward a
politician, and noted that she would most likely focus on the mobile phone survey. One strategy could be to review previous mobile phone surveys and compare them to face-to-face surveys conducted at the same time to determine whether historic response differences between the modes exist. Knowing whether the prime minister has made policy changes in the past 2 years that could be relevant for the ethnic groups of interest would also be useful; if not, the ethnic breakdown from the face-to-face survey could be used to better understand trends in attitudes. She asked the expert contributors about best practices to recognize interviewer effects, especially with only 5 days to conduct the analysis. Eveland replied that the microlevel data available for the face-to-face and mobile phone surveys could be used to gauge the presence of interviewer effect. He said that when a random code is assigned to each interviewer and characteristics such as gender and ethnic group are documented, it is possible to understand whether interviewers of the same ethnic group as the respondents received a different average response than the interviewers who are of a different ethnic group than the respondents.
The analyst inquired about comparing the achieved demographics in all three datasets with the known demographics of the country. Zechmeister described that as an essential first step and noted that information from census data could help to understand representation. Page pointed out that the group of interest is the proportion of the ethnic group over age 18 (i.e., voters). Ashley Amaya (senior survey methodologist at Pew Research Center) remarked that depending on the size of each ethnic group in the sample, the variance can change as can the stability of the estimates being created. The size would also affect Rachel’s ability to do interviewer analysis. It is important to understand the way in which the sample was drawn (e.g., random sample versus cluster design), something for which an early career analyst like Rachel might not be prepared. Pasek observed that the face-to-face and mobile phone surveys might be very different in the context of varied ethnic groups. For example, if the mobile phone survey is done well and mobile phone coverage is good, a clear picture of the ethnic groups could emerge. He suggested that Rachel compare the weighted face-to-face survey with the unweighted mobile phone survey to confirm that all populations were appropriately covered and thereby determine whether the design achieved its goals. Page mentioned that not everyone within a particular ethnic group has a mobile phone, which could lead to a nonrepresentative sample. Members of an ethnic group could also reside in multiple locations, only some of which might support mobile phone use. Therefore, it could be useful for Rachel to separate urban and rural, north and south, and east and west to better understand the potential for an uprising—the interaction between region and ethnic group is key in this analysis. Building on Amaya’s and Pasek’s comments, Eveland highlighted the value of having
access to detailed, technical information about how the face-to-face and mobile phone surveys were conducted. Courtney Kennedy (expert contributor for the Analytic Framework and director of survey research at Pew Research Center) noted that it is expensive to interview in multiple languages and usually not all of the languages will be covered. Thus, it would be valuable for Rachel to analyze the language distribution for each subgroup of interest and determine how well the survey covered those languages.
The analyst wondered how to determine the shelf-life of the face-to-face survey. Eveland suggested using a country-specific estimate of over-time variability. Pasek advocated for analysis within subgroups in the face-to-face survey and the mobile phone survey: even if the mobile phone data are lacking entire populations, if the populations that are well represented in both surveys have similar estimates, they could be used as a basis for asserting relative similarity. Page added that because some parties have ethnic affiliations, it is important for Rachel first to determine whether the prime minister is from a party that has historic ethnic affiliations.
The analyst posed a question about how polls of performance compare to polls of favorability. Eveland responded with an example from U.S. history: Bill Clinton’s personal favorability plummeted during his presidency although his performance rating remained high. Such a situation would be challenging to evaluate across different datasets. Zechmeister said that Rachel could use other questions in the database to understand opinions of the prime minister with respect to either performance rating or favorability.
Another intelligence analyst asked what resources could be used to assess bias in the datasets if the face-to-face survey was not available as a point of comparison. Bautista observed that the producer of the face-to-face and mobile phone surveys is a “reliable data producer,” owing to its connection to the U.S. Department of State. This producer likely has other work that could be consulted, which would include more systematic indicators that could provide a better sense of the modes and changes within them. Pasek suggested that Rachel first think about the mobile phone coverage, broadband access, and linguistic distribution in the country. The next step is to determine whether anything else that is happening in the country might be of interest, in that it could have introduced differences between surveys that might be significant. Comparing datasets on attributes that should not have changed can be an important indicator of confidence in the data and increase the likelihood that differences between the datasets are indicative of substantive changes. Page wondered about possible error—for example, whether the survey being relied upon incorrectly suggests that something significant has happened, or the survey incorrectly suggests that nothing has happened. Amaya pointed out that even people with extensive statistics experience deliberate when to use weights and which weights to use—an issue that could be discussed, in this case, with Rachel’s supervisor. It is also important to
account for complex samples when analyzing the data, which affect variance estimation—a feature on which only an expert in survey research would be focused. Another analyst commented that all of these types of questions will arise again in the future; this accumulating knowledge will be useful the next time an early career analyst like Rachel finds herself in “go-mode.”
SCENARIO 2: REACTION TO A MILITARY COUP
Kennedy provided an overview of the second scenario, which was developed by the workshop planning committee and is presented in Table 2-2.
Approaches to the Research Question and the Data Collection
Kennedy remarked that a coup presents particular challenges, especially in terms of posing a research question. Lisa Mueller (expert contributor for the Analytic Framework and associate professor of political science at Macalester College) explained that in the aftermath of a coup, Tanya would likely be most interested in the stability of the society. For example, will there be a counter-coup? If that research question is selected, the population of interest would be the members of the military. Another important question could relate to the safety of the society; for example, will there be a popular uprising in response to the coup? If this research question is chosen, the population of interest would include members of the society as a whole rather than the military. It is also important for Tanya to monitor lines of communication among members of the new government and the citizens. For instance, did the government promise to hold free and fair elections within a specific time period, and has it followed through? Has public opinion changed? What information do the government and the citizens have about each other?
TABLE 2-2 Scenario 2
| Scenario | Description |
|---|---|
| IC analyst | Tanya is a mid-level analyst with 5 years of experience working with surveys. |
| Country | Middle-income country. This country is an important security partner of the United States in a strategic region. The country recently experienced a military coup, and there are significant security challenges in the northern part of the country. The government has declared a state of emergency, so face-to-face surveys are not feasible. |
| IC analyst task | Tanya is tasked with developing a plan for how the State Department can understand public opinion within 1 month. |
| Data sources available | Tanya has access to no existing data sources. |
Mueller emphasized that an intelligence analyst’s inferences about the military and the broader society are only part of the task; inferences about what these groups know about each other would also be useful.
D. Sunshine Hillygus (expert contributor for the Analytic Framework, and professor of political science and professor of public policy [by courtesy] at Duke University) agreed that Tanya should first identify which measures of public opinion are most important: is the goal of the research to evaluate the coup, the overthrown government, or the United States? Tanya would then want to determine what kinds of new data collection are possible given the time frame and the feasibility of reaching individuals, since face-to-face surveys are not an option in this scenario.
Mueller added that Tanya might also be interested in understanding how people view the new leader after the coup has concluded. Because this new leader has gained power through force, he or she likely will rely more heavily on charisma to remain in office than an elected official would, and people might use unreliable cues to make decisions about the leader’s competence (e.g., physical attractiveness). Mueller indicated that both the members of the society and the intelligence analyst are in a low-information environment in this scenario; therefore, it is important for Tanya to determine what information people in the society actually have. The question guiding the research might then be the following: what do people think of the new leader based on the limited information they have after the coup? Hillygus suspected that measurement problems could arise with this question because people might be afraid or unwilling to share their real opinions—surveys might not provide valuable information for this reason. Instead, Tanya’s next step could be to scrape social media data to understand the extent of existing biases in the population.
Reflecting on other possible strategies to gather new data, Kennedy explained that if Tanya decides to conduct a survey, a phone poll or online data collection might be the best approaches. If phone services are still available after the coup, a phone poll could provide good representation. However, as Hillygus observed, the measurement properties might be flawed, especially if the coup was violent. If online data collection is deemed the more appropriate approach, Kennedy suggested that Tanya focus on a nonprobability, convenience-type collection. Although a self-administered online survey would increase the likelihood of honest responses, the representation would not be as strong as that of a phone poll. Hillygus highlighted the emergence of subpopulations that might be of interest in providing benchmarks even if their opinions do not represent the population as a whole.
Discussion
A representative from the IC inquired about how a survey question in this scenario could be phrased in a safe way to encourage truthful responses. Kennedy proposed focusing on respondents’ levels of optimism for the future of their country as one approach. Keeping practical measurement instruments in mind, Mueller pointed out that this is a middle-income country, likely with reliable access to the Internet. Therefore, Internet polling might be the preferred approach—and one that offers advantages over Short Message Service (SMS)- or voice-based polls because it could employ an endorsement or list experiment. Mueller acknowledged that although these types of experiments have drawbacks, they could help Tanya to understand aggregate attitudes toward the new leadership. Bond suggested that Tanya try to understand implicit attitudes by probing the emotional underpinnings of those attitudes with the following types of survey questions: How do you feel right now? Are you afraid? Are you hopeful? Are you confused? What is your primary concern at the moment? She added that it would be useful for Tanya to compare responses by location within the country to gain context and to better understand any connections between the stability in attitudes and physical circumstances. Hillygus supported this focus on implicit direct measures of mass attitudes as well as the value of understanding geographic variation in these attitudes. She described several tradeoffs for Tanya to consider when thinking about the allocation of research resources: high response rate, maximum coverage, or deep opinions. She cautioned against posing open-ended research questions given the time frame allotted for this task and suggested that Tanya prioritize the understanding of geographic differences.
Zechmeister posed a question about how to evaluate the validity of responses to online surveys. Hillygus replied that people’s willingness to tell the truth is the most pressing issue with an online survey. If a survey infrastructure already exists in the country of interest, including panels of people familiar with answering online survey questions, a separate set of concerns arises about the likelihood of fraudulent responses in order to receive incentives. Hillygus advocated that a measure allowing for a data quality check (e.g., paradata on start and end times) be included in all surveys.
An analyst asked how to assess whether the results of an experiment are reliable in an environment where no previous data are available for comparison. Mueller explained that in a list experiment, for example, people would not be asked direct questions about their attitudes toward the new government. Instead, several attitudes (~5) would be included in a list, including a “sensitive” attitude, and participants would be asked which apply to them. Not all of the participants receive the same list; usually only half receive a list that includes the sensitive item. She asserted that the success
of this approach does not rely on the availability of previous high-quality data; rather, it relies on the quality of the design of the experiment. The value of experimental data is related more to how well an experiment is designed—ensuring randomization and prioritizing sample size—than to how it is executed. She emphasized that, in this scenario, a list experiment could be rolled out within a few weeks of the coup. Hillygus responded that if SMS is selected as the best method for data collection, a list experiment could be too difficult to implement. Early in the planning stage, she continued, Tanya could seek existing data (e.g., a census) to determine benchmarks, as it is unrealistic that no previous data are available. Tanya could then consider the infrastructure that could constrain new data collection and narrow the scope of what would be feasible. Kennedy added that a list experiment might be worth testing; however, she cautioned that although list experiments seem excellent in theory, they often do not perform as well in practice (i.e., list experiment data do not always make sense). She reiterated Mueller’s assertion that list experiments have to be designed flawlessly to be successful. Hillygus shared Kennedy’s concerns about list experiments and noted that interpretability (especially with automated or SMS surveys) as well as the level of confidence Tanya would have in the results could be problematic, especially if no previous data are available. Pasek underscored that it is possible to test the validity of list experiments by correlating their microdata with other measures. Mueller emphasized that every method is susceptible to imperfect design and/or implementation. She expressed her support for endorsement and list experiments because they are relatively low cost and well suited for the context of this scenario; it could also be valuable for Tanya to triangulate the evidence from such experiments with other evidence.
Hillygus agreed that all methods have both advantages and disadvantages, and Tanya should weigh those in the planning stages. In a context where no previous survey data exist, it is important to evaluate social media environments and their data as well as how value could be extracted from those data. Even though no data source is perfect, she continued, Tanya should still ensure that the methods she selects will extract worthwhile information. She encouraged Tanya to consider the sources of administrative data, the reach of social media, and any analysis that could be performed on those data to understand changes that occurred in the population pre- and post-coup. Amaya added that social media data could be useful in this scenario if the platforms are still active. She agreed with Hillygus that change in attitude over time is an important feature that could be gathered from an analysis of social media data—and people on social media might be those most likely to react to the coup. Such an analysis should focus not only on the text but also on the emoticons and links, she continued, which requires training and computer power that Tanya might not have. Bautista
commented that a middle-income country would be home to researchers who have collected data in the region using innovative approaches; thus, Tanya could identify these researchers in the northern part of the country and gather their insights.
Another analyst remarked that a situation in which no previous data exist is highly uncommon, and he suggested that Tanya ask local implementers for assistance in identifying data sources. Even with well-developed dictionaries, he cautioned Tanya against drawing samples from social media data in this particular scenario, as many of the platforms are more niche in middle-income countries than in the United States. If previous relationships with research firms exist in this country, Tanya could invite panels back from a previous probability-based face-to-face survey, if it could be done safely. He also advised Tanya to avoid conducting a list experiment over the phone in this scenario, owing in part to its substantial cognitive burden. Although it might be difficult to measure attitudes directly (e.g., it would be unethical to ask questions that could trigger trauma for or endanger respondents), he emphasized the value of understanding how people are feeling in this scenario. To begin to understand these feelings, it would be useful for Tanya to know whether the country is democratic and if it recently held elections. Furthermore, because coups are not usually a surprise, studying relevant pre-coup conversation could help Tanya to make inferences about people’s current feelings.
An analyst asked the experts to elaborate on the concept of rolling data collection. Lau explained that for SMS approaches with random-digit dialing, people receive text message surveys with 10–15 questions each. This method is best suited for brief, simple survey questions. However, he has observed significant heterogeneity in the quality of panels and the information they provide to produce high-quality data. For example, some panels are probability based, drawn from regularly updated mobile network operator databases, are high quality and accurate, and provide good coverage. The auxiliary data from the frame are suitable for nonresponse adjustments, for example, because response rates to SMS-based surveys are typically low and these types of panels have often skewed more male, urban, and educated. Other panels are more suspicious, with different standards for quality, and are often targeted for market research. Lau encouraged analysts to ask many questions of a panel provider: how was the sample drawn? What is the coverage? Are data from the frame available? He directed analysts to the American Association for Public Opinion Research’s (AAPOR’s) Transparency Initiative,1 which includes guidance on expectations for providers. Even when biases arise with these
___________________
1 For information about this initiative, see https://www.aapor.org/transparency_initiative.htm.
SMS surveys, having data over time can illustrate trends—that is, even if the data are not particularly valid, they can be useful when combined with other sources of data. Pasek cautioned about ensuring that the samples under comparison are consistent, particularly with the more marketing-oriented firms.
Contemplating other design options, Hillygus suggested that Tanya conduct a recontact study of an existing probability survey, using SMS (which is low burden and can reveal geographic movement) to increase responses from those in the northern part of the country. She also proposed the use of refreshment samples (i.e., a fresh panel recruit), which provide the opportunity to assess attrition or other types of panel effects. Kennedy agreed with Hillygus that a recontact study of a pre-coup probability panel could be the best option, and a new phone or SMS survey could also be conducted. A less established, opt-in panel might be possible, depending on the country and the vendor. She also cautioned that much of the literature on data quality from opt-in online panels is U.S.-centric, creating many knowledge gaps related to the international space. To try to circumvent positivity bias in nonprobability panels, she encouraged analysts to avoid posing yes/no and agree/disagree questions; instead, an ordinal scale or forced choice option would be more effective in this type of scenario.
Gelfand observed that because the experts are approaching this scenario from different disciplines, they approach problems in unique ways and use different language to refer to similar concepts. She discussed non-Western-based dictionary development to assess cultural constructs (see, e.g., Choi et al., 2022; Gelfand et al., 2015), which can help overcome any language differences and enhance the research process.
An analyst said that it might not be worthwhile for Tanya to try to implement anything within 1 month—if the coup has not ended, opinions might not be stable and the U.S. government does not have unlimited resources to field multiple data collection efforts. He expressed disbelief that Tanya would not have access to any historical data. He suggested that Tanya use the month to track those data down, study them, and consult with experts who are located in the United States and could provide insight to develop a plan for understanding public opinion in the country of interest. Although this scenario’s discussion introduced several best practices for data collection, he continued, it did not consider the constraints for what analysts have to produce afterward. Analysts have to communicate to a generalist audience that might not be familiar with or convinced by new techniques; because it is not feasible to introduce advanced techniques to policy makers during a time of crisis, these conversations are most effective during times of peace.
SCENARIO 3: ANTICIPATION OF POLITICAL INSTABILITY
James Druckman (expert contributor for the Analytic Framework and Payson S. Wild Professor of Political Science at Northwestern University) provided an overview of the third scenario, which was developed by the workshop planning committee and is presented in Table 2-3.
Ethical Considerations
Druckman advised Luis to begin his analysis by dividing the surveys by country to determine which countries have more than one survey. Luis would then begin conducting an “ethics check” of each survey, with consideration both for moral issues and for potential long-term consequences related to the use of certain data. First, it is critical to ensure that the human research subjects were treated appropriately—protection from danger, verification of confidentiality, and confirmation of consent. This part of the ethical evaluation requires an understanding of the cultural context (e.g., inaccurate language translations would affect the understanding of consent) and a recognition that using unethical surveys could undermine future research efforts in the region.
Second, Druckman continued, it is important for Luis to verify that the data themselves are ethically sound. Guidelines from AAPOR, for example, would be especially useful in evaluating the ethics of data from an unstable region. Based on the information that accompanies the data, Luis could determine whether these data are appropriate for inference by ensuring transparency in how the data were collected, who paid for the data, who collected the data, how the data were analyzed, and where the data can be found.
TABLE 2-3 Scenario 3
| Scenario | Description |
|---|---|
| IC analyst | Luis is an early career IC analyst with no background in survey research. |
| Region | Politically unstable region (~15 countries) with significant security challenges. |
| IC analyst task | Luis is tasked with describing public opinion in the region, with a focus on recommending countries where popular discontent with the regime might emerge in the next year. |
| Data sources available | 20 surveys (5 mobile phone, 5 social media nonprobability Web surveys, 10 face-to-face) from the past 5 years. The surveys vary in quality: some follow highest quality standards (microdata available), some are low-cost/lower-quality surveys (microdata available), and some are poor quality (no microdata available). |
Druckman explained that it is particularly important to understand how the sample was generated and how many people participated in the survey. For example, is information provided about the mobile phone coverage in a particular country? Are response rates for the mobile phone surveys provided? Is social media censored in a way that only some people would have access to a social media survey? Druckman cautioned that a lack of information about sample generation could lead Luis to use a problematic sample (e.g., the unethical use of data for something other than their intended purpose) and thus make a poor inference. Additional key ethical questions for Luis to consider include the following: does each survey include the date that it was given, and were the data collected recently enough to be worthwhile? Does each survey provide information about what measures were included? What techniques were used? Was there anonymity for participants? Was normalization performed? If all of the surveys are deemed unethical, Druckman indicated that Luis should look for new data; if some (or all) of the surveys are deemed ethical, their quality should be evaluated before making any inferences.
Quality Considerations
Lau discussed the “quality checks” that should be performed with each survey that has passed the ethics check. If these quality checks fail, an intelligence analyst would either have to collect new data or correct for the known errors; given that Luis is likely constrained by time in this scenario, Lau suggested that he focus on the latter.
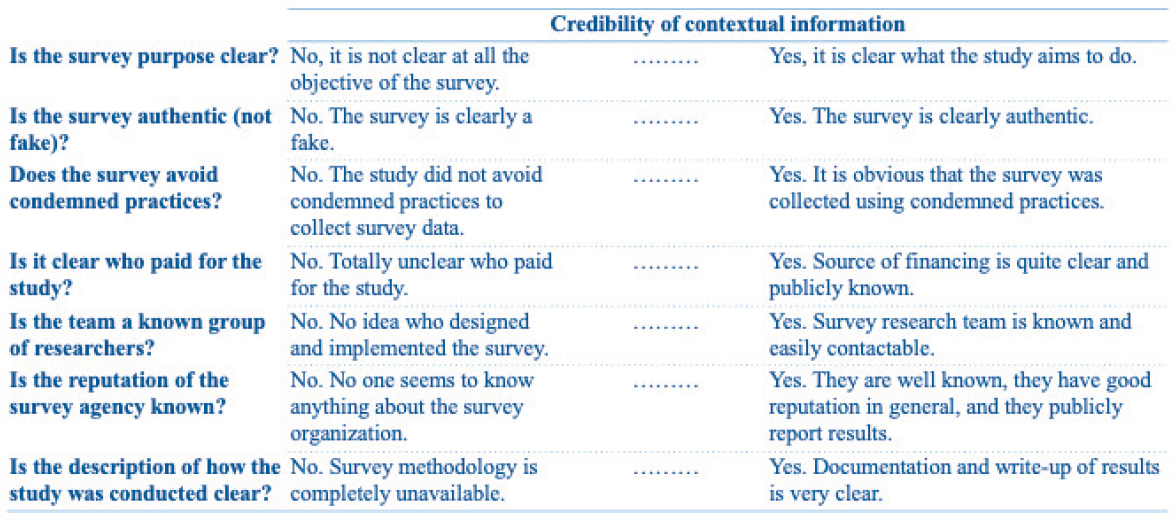
Lau pointed out that Luis should have several concerns about the quality of the social media nonprobability Web surveys. Using the Analytic Framework, especially Bautista’s Rating Tool for Survey Quality (see Figure 2-1), Luis would note that the stated purpose of the surveys might be different from the real purpose, and although the surveys are authentic, they might not be of high quality. It is clear who paid for the study, but because a few of the sponsors are political parties, the motivation for conducting the research is suspicious. Furthermore, the survey research team is unknown, the surveys have sampling and coverage problems, and the response rates are likely low. Given that these surveys have both low credibility and soundness, Luis would question whether these sources could be used. However, because these Web surveys could represent an upper bound of support for a particular leader, Lau urged Luis to consult with colleagues as well as to contemplate under what conditions he could use these Web surveys—what levels of credibility or soundness have to be achieved to trust this source, especially since other data are available?
Lau explained that although the mobile phone surveys might be more credible than the social media surveys, a lack of documentation about weighting suggests that the mobile phone surveys might not be nationally
SOURCE: NASEM (2022).
representative. If the coverage of mobile phones in the countries of interest is only 40 to 80 percent, this method cannot reach a significant portion of the target population—the part of the population that is most likely unhappy with the regime. Therefore, Luis would have to assign bias to these surveys.
Lau reiterated that the Analytic Framework is not meant to be directive but rather to spark discussion: how does such a rating system work on a day-to-day basis for intelligence analysts? What challenges emerge? How can the guidance of the Analytic Framework be bridged with the practices of analysts?
Prediction Challenges
Druckman noted that the next step is to make an inference from each survey that has passed the ethics and quality checks. Luis could begin with measurement considerations such as whether a direct question was asked and if it was normalized. Privacy is a key concern; for example, did respondents feel protected while answering questions via phone or social media, or did they feel surveilled? It is also important for Luis to assess changes over time, as all of these surveys were conducted 5 years ago; if conditions have changed significantly or are changing quickly, these sources might not be useful in making predictions about the future. Druckman recalled that even though Luis does not have much experience with survey research, he knows the country context and thus can determine whether the predictions resonate as he makes comparisons across countries (e.g., whether the low-quality surveys are leading to unexpected predictions).
Druckman explained that with multiple sources of data from one country, Luis could consider integration using some of the basic techniques discussed in “Integrating Data Across Sources” (e.g., comparing surveys with different sampling frames to determine whether distinct populations had different levels of discontent and how they complement one another). Pasek suggested that Luis examine the following for meaningful comparisons: what do the high-quality data reveal? Are the methods of collecting data across countries similar? Are the surveys in the same language? Do the measures have similar meaning across cultures? If discontent is a low-probability outcome, he continued, then the relative question would be more about the variability than the mean. Thus, Luis might consider which metric would be predictive of future discontent, how that metric could be modeled, and whether similar sets of data from other regions could be included in the model. At this point, Luis could determine whether and where the high-quality data match the low-quality data and begin making inferences about volatility. Pasek urged Luis to add measures early in this process that would enable the interpretation of the lower-quality data. For
example, information about mobile phone and social media use collected during a face-to-face survey would be helpful for calibration when the lower-quality surveys emerge. He highlighted more sophisticated models that could be employed to reveal trends over time, which could be built with the 20 available data sources if the differences between them are calibrated well and microdata are available. He stressed that much of this depends on the eventual metric—the predictor of discontent—which is more likely to emerge between samples rather than in one sample.
Lau added that because this scenario raises questions about cross-cultural differences, measurement equivalence and cultural norms that influence response styles are key considerations. He contemplated how these considerations would influence the IC’s practice, and he encouraged workshop participants to identify related gaps in the Analytic Framework and to discuss how they could be addressed.
Discussion
A representative from the IC observed that an early career intelligence analyst could be challenged and overwhelmed by an assignment to conduct regional analysis and would likely take several months to complete it. She encouraged Luis to consult with experts as well as to take advantage of the ethics and quality checklists in the Analytic Framework. In order for Luis to make any valid conclusions, it is important to note that even if the sources are reliable, much information will be missing from 20 surveys over 5 years and 15 countries. Before assessing the surveys country by country to perform the ethics and quality checks, she suggested that Luis list information available over time by country. Given the task’s focus on discontent with the regime, it is also important to ensure that the survey respondents were able to speak freely and that the purpose of the study was transparent. The analyst posited that the checklists could make it possible for Luis to develop either low or high levels of confidence in the information from each country; additional conversation within the IC about developing confidence when information is limited or outdated could be beneficial. After determining the level of confidence and identifying key gaps, Luis could explore social or traditional media analysis, event data indicative of instability, or any other data related to consumer sentiment to better understand the level of discontent. Lastly, the analyst emphasized the cross-cultural component of this scenario; even though the question focuses on a region, she urged Luis first to look at the data country-by-country and then to reaggregate those data to a region. Page noted that although process can reduce human decision-making bias, it can breed overconfidence: despite having access to 20 surveys, Luis’s prediction task in this scenario is very difficult. Page
proposed that Luis take the union of the confidence intervals to reveal the level of uncertainty.
Another analyst said that she would be inclined to eliminate the social media nonprobability Web surveys in this scenario but wondered whether something useful could be gleaned from them. Druckman replied that it depends on what other sources are available; it would be difficult to eliminate any data that would pass a basic ethics test if limited data were available. He suggested thinking about the coverage, the nature of social media, and the sample that is gathered (in terms of different benchmarks) to determine whether the surveys have any value before eliminating them. Pasek added that a few recent social media data points might reveal significant information about the level of volatility in a region, which could aid in making a prediction about future discontent. Druckman commented that any measures that help to understand people’s emotions toward the regime could reveal precursors to discontent. Amaya suggested searching social media for the number of new pages and groups that have emerged, as well as how their membership is increasing. Since Luis is tasked with making a prediction, she continued, those paradata might be more useful than the posts themselves. Bautista mentioned that if the social media posts are studied, they could be viewed as sources of qualitative data on a particular sentiment.
When comparing the mobile phone surveys to the face-to-face surveys, the analyst wondered how to determine what is closer to true attitude if a systematic difference in attitude emerges. Lau highlighted sample coverage as one key factor (i.e., mobile phone surveys exclude people without mobile phones) and suggested subsetting the face-to-face survey data to make a fair comparison. Another approach is to distinguish sampling and representation issues from measurement; for example, people might be more comfortable disclosing the truth on a sensitive issue over the phone than in person. Although that might suggest that the mobile phone surveys are producing the “truer” attitudes, that notion has to be balanced against issues of representation. In this instance, it would be worthwhile to consider which groups are systematically excluded from mobile phone surveys due to coverage and nonresponse and the extent to which these groups vary across the outcome being measured (e.g., discontent). Because this type of qualitative analysis relies on interpretation and inferences made by the analyst and communicated to the policy maker, Lau encouraged more discussion within the IC on this issue. Kennedy indicated that Luis could stack the mobile phone dataset and the face-to-face dataset to create one dataset and predict the attitude (the predictor variables would be the commonalities between the two datasets, such as demographics, and the variable for the mode). When controlling for the compositional differences between these two datasets (e.g., region, age, sex, and ethnic group), sometimes no mode effect
exists because differences in the data stemmed from sample composition not mode effects. Pasek added that if one assumes that the differences are a result of a mean shift within an individual country, sophisticated models (e.g., Bayesian or Bayesian-adjacent) could be employed to help estimate the reasons for those differences. For example, he described a combination of generalized additive models, which generate a smooth plot over time, and multilevel models that account for differences between modes and between countries. Individual plots can be generated for each country assuming that the differences between the countries are relatively stable, with the exception of any added discontinuities—the effects of those discontinuities then become visible. Pasek mentioned that although an early career intelligence analyst like Luis would not be doing this type of work, the toolkit to do so exists.
Bautista stated that it would be helpful for Luis to understand the logic behind the measure. Reflecting on differences in modes, he explained that more “authentic” responses are typically gathered in the absence of an interviewer. However, it can be difficult to gauge how a data collection process occurred; for example, meanings are sometimes “negotiated” and questions discussed by both the interviewer and the respondent in a face-to-face survey, which is not possible in a Web survey. Understanding how the experience occurred helps to understand the limitations around the data. Bond championed the notion of thinking more deeply about the data collection process. For example, are there more opportunities to “skirt the question” in one mode over another? When aggregate trends are unexpected, she continued, it is worthwhile to think about the context in which the data were produced, which does not require any technical expertise.
Druckman underscored the difficulty of prediction, which requires an analyst to measure a latent future feeling. He encouraged Luis to think carefully about measurement in this scenario: what is the construct to be captured? Should discontent or something that precedes discontent be measured? He reiterated Page’s warning about overconfidence in a given prediction, and Page added that relative rank ordering might be useful to achieve odds ratios and that a good prediction is a result of both strong survey methodology and strong theory underlying the survey. Lau pointed out that, in this scenario, the subgroups of the population that are most likely to have discontent that could lead to protest are of greatest interest. Therefore, a general population-based survey might not be the best approach to predict areas of future discontent, as is discussed in the Analytic Framework’s “Alternatives to Probability-based Surveys Representative of the General Population for Measuring Attitudes,” written by Amaya.
SCENARIO 4: REGIONAL PUBLIC REACTIONS TO A GEOPOLITICAL CRISIS AND SUSCEPTIBILITY TO FALSE NARRATIVES
Lau described the final scenario, which was generated by the workshop participants and is presented in Table 2-4.
This scenario was examined alongside a recent Washington Post article (Parker, 2022) on public opinion about the Russian invasion of Ukraine. The article references survey data from Gary Langer, a well-known U.S.-based researcher. A phone poll was conducted across Russia by “strong, independent survey research firms” 1 week into the invasion, over the course of 3 days, with 1,640 respondents. The poll asked whether respondents support the Russian “military operation” on Ukrainian territory, and the reported results were as follows: ~58 percent supported the action and ~23 percent opposed it, with ~6 percent undecided and a ~13 percent nonresponse rate. The article also references a Russian government-affiliated survey with a similar demographic breakdown but different results.
Evaluation of Data Credibility and Soundness
An analyst emphasized that because the respondents are living in dangerous conditions, an intelligence analyst should determine whether the poll questions were worded to elicit truthful responses. Zechmeister shared that because she was unable to download the data files that are linked in the Washington Post article, she would request them from the firm that conducted the poll and begin to assess credibility and soundness (with guidance from “Drawing Inferences from Public Opinion Surveys: Insights for Intelligence Reports”) as well as address the analyst’s inquiry
TABLE 2-4 Scenario 4
| Scenario | Description |
|---|---|
| IC analyst | An experienced intelligence analyst. |
| Region | 10 nations. |
| IC analyst task | The analyst is tasked with understanding the regional public reactions to a geopolitical crisis as well as the susceptibility to false narratives after a small, friendly, strategic partner is invaded by a nuclear power. The analyst is expected to present the first deliverable in 2 weeks, but the project will likely continue for 1 year. |
| Data sources available | ~5 years of biannual mobile phone surveys in 5 of the 10 nations in the region and some yearly aggregate international polls, but no data exist for the remaining nations. |
about whether the questions were worded to provoke strategic responses or censored responses (with guidance from “Ascertaining True Attitudes in Survey Research”). Zechmeister noted that this poll likely provides an upper-bound estimate, given that respondents might have been concerned about phone surveillance. Another analyst observed that a translator might be needed to conduct these assessments because the files contain the original questionnaire in Russian. Pasek mentioned that although most in the public opinion community know Langer’s reputation well, if that was not the case, it would be important for the intelligence analyst to conduct research into his credibility.
An analyst wondered what information is available to the Russian public and media—the susceptibility to false narratives is particularly salient in this scenario—and explained that an intelligence analyst could benchmark questions in this poll against prior research conducted in the country to determine whether this poll is a credible data source. Eveland added that the Washington Post article offers value in terms of benchmarking against previous Russian invasions of neighboring countries. Pasek suggested evaluating specific subgroups within the data source based on previous knowledge of Russia, and another analyst asked how to handle the raw data and how additional information about subgroups could be useful. Pasek replied that an analyst could explore the following questions: do we expect differences in this context between age groups or between locations? If the belief is that public opinion was better in previous times of conflict, are the same types of groups who supported those conflicts supportive of the current conflict? He stressed that understanding whether these types of means align could help an analyst to determine the credibility of the current data source.
Analysts explained that policy makers are likely to read sources like this Washington Post article and would expect an intelligence analyst to have an opinion about its credibility immediately, without being given the time to wade through the accompanying documentation. Even if the instrument is partially biased, an analyst wondered whether the results of the poll would reveal demographic divisions that would be of interest. Another analyst noted that intelligence analysts would also have to be prepared to explain quickly and clearly to policy makers how the data from this Washington Post article interact with other available data and whether their overall assessment is affected.
Ethical Challenges
A representative from the IC wondered about the accuracy of the statistic provided in the Washington Post article that 23 percent of the Russian respondents “oppose the military operation.” Given that criticizing the
Kremlin is a criminal offense, she expressed her surprise that this number is not lower. However, if the opposition toward this “military operation” is this high under such conditions, that could suggest that the actual percentage of opposition is even higher. Furthermore, she contemplated the ethics of asking people whether they support something if voicing opposition to it is illegal. Zechmeister noted that the percentage being reported as “approving of the military operation” (58 percent) might be an upper bound, and participants might be censoring their true attitudes. If phones are being tapped in this context, it is unethical for people to risk their safety to participate in a poll.
In her review of a translated version of the original questionnaire, Amaya observed that analyzing responses to the question “Do you think the rest of the country supports the military operation?” could have helped to better understand true attitudes (as opposed to analyzing the responses to the question that asked participants whether they support the “military operation”). Conducting a variety of analyses on the provided data points would help confirm whether the correlation is as high as presented in the Washington Post article. For example, instead of analyzing by age, the attitudes of people who spoke to friends or family in Ukraine in the past 2 weeks could have been compared to those of people who had not. Additionally, to gauge the effectiveness of Russian messaging, which might be a better indicator than the rates of approval for the “military operation,” she said that responses to the question asking participants to identify the goals of the Russian military could have been analyzed.
Bautista referenced another document accompanying the poll data, which reported that 90 percent of the respondents were apprehensive about participating in the poll. An intelligence analyst’s awareness of this type of context is essential to evaluate the quality of the data. An analyst observed that even if the phones are not being tapped in Russia, the perception that they could cause undue stress on poll respondents, which explains why 90 percent were apprehensive. He said that an analyst’s expertise is key in a scenario like this one because, as Eveland and Pasek also mentioned, it would be useful to know whether Russia’s 2008 or 2014 invasions (of Georgia and Crimea, respectively) provide context about the stability of public opinion—that is, how does the 58 percent approval rating cited in the Washington Post article compare to the approval ratings in those instances?
Following the guidance of the Analytic Framework, Eveland reiterated the importance of understanding the nature of the survey provider and how the public views that provider, which could also affect the results of the poll. Furthermore, it is important for the intelligence analyst to consider how opinion is shifting geographically—for example, people in urban areas
might have greater access to uncensored media coverage and thus might be less likely to support the invasion. Reflecting on other potential data sources to gauge population sentiment or the surrounding information environment, Zechmeister wondered to what degree social media is accessible in Russia.
Kennedy acknowledged that much of the Russian public is provided with a specific narrative that is different from the truth, so people that claim to “support the military operation” might not realize what they are actually supporting. She wondered how the questionnaire and the measurement address those differences. Lau pointed out that the concept of “support” is ambiguous and interpretable among respondents, and Amaya suspected significant nonresponse biases in the poll results. Kennedy posited that additional opposition could be “hiding,” perhaps in the nonresponses to the poll, and it would be helpful for an intelligence analyst to better understand the cooperation rate of the public. Bautista remarked that a journalist’s perspective of survey results and how they should be reported would be different from that of a survey methodologist. For example, a disclaimer is included in the data files—but not reported in the article—about how the sensitivity of the questions should be taken into account in interpreting the results.
An analyst summarized the results of another survey conducted around the same time as that referenced in the Washington Post article, which had a higher approval rating but a similar opposition rating owing to the use of a different scale (i.e., the response options from which participants could choose were fewer). Kennedy commented that although the poll described in the Washington Post article seems to be credible, the measurement is arguably unethical, as participants are essentially being asked to self-report an active crime; thus, it would be difficult for the intelligence analyst to interpret or trust the data. She wondered if the published poll results could have a positive impact on global views of the Russian public since the opposition rating is higher than what is portrayed in the information environment. Pasek suggested taking a Bayesian approach to analyzing the poll results. For example, if previous assumptions were that the approval rating would be even higher than what is presented in the Washington Post article, he said that this should shift our views (because we assume that the observed value is a likely maximum). He also pondered the potential implications if the approval rating were lower than 50 percent. Amaya reiterated that while the phone poll might be useful, it includes a significant amount of measurement error, nonresponse bias, and ethical problems. She added that it would be beneficial for the analyst to study the reasons that respondents provided for “supporting the special military operation.”
Discussion
Eveland asked whether “rally around the flag” is a common way to understand data. An analyst replied that “rally around the flag” is a common way to understand data. In the case of an attack within a particular country or a natural disaster, it relates to a temporary change in public opinion in response to the significant event that deviates from the normal narrative and recedes within weeks or months. Pasek remarked that while “rally around the flag” is useful in some cases, intelligence analysts likely rely on other phenomena to explain public opinion that do not appear in the academic literature. He wondered whether it would be helpful for academia and the IC to collaborate to discuss, describe, locate, and/or document those phenomena. An analyst supported Pasek’s idea of collaborating to broaden the understanding and communication of other relevant theories. Another analyst agreed that it would be worthwhile to develop some of the phenomena that the IC recognizes that have not yet been articulated by academia. She added that when policy makers automatically assume “rally around the flag” as the justification for a particular public opinion, it is incumbent upon the IC to explain whether and how the phenomenon is more complicated. A third analyst observed that most stakeholders have enough knowledge to suggest “rally around the flag” as an explanation and to ask about margin of error; with this common vocabulary as a starting point, the IC can then refine the conversation with deeper analysis. Bautista asserted that additional guidance would be beneficial to understand the theories behind how the data were created (i.e., the survey science), not just how they were interpreted. The analyst added that talking to experts in the field is valuable because policy makers rely on the IC for advice; the Analytic Framework helps intelligence analysts to better understand the latest methodologies and thus better serve this policy-making community.
This page intentionally left blank.


