Progress Toward Restoring the Everglades: The Ninth Biennial Review - 2022 (2023)
Chapter: Appendix B: STA Performance Summary
Appendix B
STA Performance Summary
In this section, the committee provides a brief evaluation of the performance of each stormwater treatment area (STA), organized by flow path. Primary emphasis is placed on performance during more recent water years (WY 2017-2021) as related to meeting the goals of the water quality−based effluent limit (WQBEL). Summaries of the comparative performance of the STAs are shown in Table 4-2 and Figure B-1.
CENTRAL FLOW PATH (STA-2 AND STA-3/4)
Inflows and Land Use
STA-2 and STA-3/4 largely receive drainage from the Everglades Agricultural Area (EAA) basin, which is dominated by sugarcane along with turfgrass and vegetables. Soils in EAA are organic soils underlain by limestone. The limestone contributes to higher calcium content in the inflows compared to the Western Flow Path. Lake Okeechobee can be discharged to the STAs if there is capacity to process these waters, and during the dry season, if water is available to send south, Lake Okeechobee water is used to maintain hydration of STA cells. Long-term average total phosphorus (TP) concentrations of inflow water between WY 2004 and WY 2022 are approximately 50 percent lower for STA-2 and STA-3/4 than inflow water of the other STAs (Figure 4-12), which has supported their performance.
The Central Flow Path benefits from the 60,000-acre-foot (AF) A-1 Flow Equalization Basin (FEB) constructed in WY 2016 as a storage feature to moderate inflows to STA-3/4. The A-1 FEB is a large shallow reservoir filled with naturally seeded submerged aquatic vegetation (SAV) and emergent aquatic vegetation (EAV) located upstream of STA-2 and STA-3/4. Stored water can help avoid dry downs during the dry season, and the storage provided can help attenuate peak

SOURCES: Data from Chimney, 2014, 2015a, 2017, 2018, 2019, 2020, 2021, 2022a,b; Germain and Pietro, 2011; Goforth et al., 2005; Ivanoff et al., 2012, 2013; Pietro, 2016; Pietro et al., 2006, 2007, 2008, 2009, 2010.
inflows. Considerable removal of TP also occurs in the A-1 FEB because the operational depth range promotes the growth of wetland vegetation. The A-1 FEB in many ways acts as a supplemental STA, providing a pre-treatment system by removing approximately 75 percent of inflow TP within the FEB and discharging water with TP concentrations ranging from about 13 to 15 µg/L (calculated as an arithmetic mean; Laham-Pass, 2022; Wakefield, 2021).
STA-3/4 Performance
STA-3/4 is the largest treatment wetland as part of the Everglades STA network (Table 4-2). It is divided into three flow-ways, each with two cells—an upstream EAV cell and a downstream mixed SAV/EAV cell (Figure B-2).

SOURCE: Modified from Chimney, 2022a.
STA-3/4 has been in operation for the past 18 years (since WY 2004) and has performed well over this period by reducing inflow flow-weighted mean TP concentrations from 101 to 15 µg/L in the outflow when averaged over the period of record (WY 2004-2021) (Chimney, 2022a). Since WY 2017, STA-3/4 has consistently met the WQBEL requirements based on the previous 5 years of data with outflow TP concentrations of 11 to 15 µg/L (Figure 4-8; Table B-1).
During the period of record, STA-3/4 retained approximately 844 tons of phosphorus or approximately 128 kg P/ha on an area basis (Chimney, 2022a). As indicated in Figure 4-26, a majority of this phosphorus is retained in the upstream treatment cells resulting in distinct phosphorus gradients in water, biotic communities, and soils along the flow-ways of STA-3/4. Spatial patterns of phosphorus enrichment in litter, floc, and recently accreted soil have been observed in Cell 3A of STA-3/4 (see Figure 4-26; Osborne et al., 2019b).
STA-2 Performance
STA-2 is the second largest treatment wetland of the Everglades STA network (Figure B-3). Since it began operation in WY 2000, STA-2 has been expanded twice. Flow-way 4 was added in WY 2007, and Flow-way 5 was added in WY 2013. Approximately 22 percent of the treatment area is managed as EAV and 78 percent is managed as EAV/SAV (mixed marsh).
Over the period of record, STA-2 has reduced inflow flow-weighted mean TP concentrations from 101 to 22 µg/L in the outflow (Chimney, 2022a). Over the past 10 years (WY 2013-2022), STA-2 produced outflow TP concentra-
TABLE B-1 Summary of Select Hydrologic and Phosphorus Loading Characteristics of STA-3/4 During Recent 6 Water Years (WY 2017-2022)
| STA-3/4 | Treatment Area (acres) | Adjusted Effective Treatment Area (acres) | Inflow TP (conc’n) (μg/L) | Outflow TP (conc’n) (μg/L) | Phosphorus Loading Rate (g/m2-yr) | Hydraulic Loading Rate (cm/day) | Inflow Water Volume (MAF) |
|---|---|---|---|---|---|---|---|
| WY 2017 | 16,327 | 16,327 | 61 | 11 | 0.4 | 1.9 | 0.377 |
| WY 2018 | 16,327 | 16,327 | 128 | 12 | 1.3 | 2.8 | 0.543 |
| WY 2019 | 16,327 | 16,327 | 80 | 12 | 0.9 | 3.2 | 0.631 |
| WY 2020 | 16,327 | 16,327 | 65 | 13 | 0.4 | 1.6 | 0.311 |
| WY 2021 | 16,327 | 15,245 | 80 | 12 | 0.8 | 2.9 | 0.521 |
| WY 2022 | 16,327 | 15,245 | 91 | 15 | 0.6 | 1.8 | 0.330 |
NOTE: MAF = million acre-feet.
SOURCES: Data from Chimney, 2018, 2019, 2020, 2021, 2022a.

SOURCE: Modified from Chimney, 2022a.
tions of 14 to 38 µg/L and in 6 out of 10 years met the upper annual limit of WQBEL (19 µg/L) but has never reached the lower limit (13 µg/L, required in at least 2 of every 5 years; see Figure 4-8). Although average annual TP concentrations were generally declining from WY 2013 to WY 2017, STA-2 performance deteriorated in the past 6 years (Table B-2), including a spike in TP concentrations in outflows in WY 2018 due to disruption to vegetation in Cell 3 including damage by Hurricane Irma. The South Florida Water Management District (SFWMD) is currently working to refurbish STA-2 by filling the deeper areas in the northwest corner of Cell 2 to enhance vegetation growth and by remediating Cell 3 to reduce hydrologic short-circuiting. Between March 2021
and March 2022, flow-weighted mean outflow concentrations from Cells 1, 4, and 5 averaged 13 µg/L TP or below, suggesting promise for STA-2 to meet the WQBEL if the issues in Cells 2 and 3 are successfully addressed (J. King, SFWMD, personal communication, 2022). WY 2022 data suggest that the system is recovering (Table B-2).
Vegetation management including herbicide spraying to kill floating aquatic vegetation and other undesirable vegetation probably contributed pulses of phosphorus release into the water column, resulting in an increase of outflow TP concentrations (Reddy and Sacco, 1981). Large portions of STA-2 are heavily dependent on SAV, which can be a concern for the overall stability of the system during intense storm events. The SFWMD’s recent introduction of some EAV as buffer strips (similar to STA-3/4) in SAV treatment cells will likely help to improve overall stability and reduce sediment resuspension.
During the period of record, STA-2 retained approximately 600 tons of phosphorus, or approximately 96 kg P/ha (Chimney, 2022a). A majority of this phosphorus is retained in the upstream areas of cells resulting in distinct phosphorus gradients in water, biotic communities, and soils along the flow-ways of STA-2 (Figures 4-25 and 4-26; Osborne et al., 2019a).
Key Operational Factors Affecting Performance in the Central Flow Path
The following operational factors contribute to the strong performance of STA-2 and STA-3/4 (see also Table 4-2):
TABLE B-2 Summary of Select Hydrologic and Phosphorus Loading Characteristics of STA-2 During Recent 6 Water Years (WY 2017-2022)
| STA-2 | Treatment Area (acres) | Adjusted Effective Treatment Area (acres) | Inflow TP (conc’n) (μg/L) | Outflow TP (conc’n) (μg/L) | Phosphorus Loading Rate (g/m2-yr) | Hydraulic Loading Rate (cm/day) | Inflow Water Volume (MAF) |
|---|---|---|---|---|---|---|---|
| WY 2017 | 15,495 | 15,495 | 82 | 14 | 0.5 | 1.8 | 0.324 |
| WY 2018 | 15,495 | 15,495 | 158 | 38 | 1.4 | 2.4 | 0.445 |
| WY 2019 | 15,495 | 15,495 | 104 | 23 | 0.7 | 2.0 | 0.362 |
| WY 2020 | 15,495 | 15,495 | 81 | 18 | 0.4 | 1.3 | 0.247 |
| WY 2021 | 15,495 | 14,910 | 100 | 21 | 0.9 | 2.5 | 0.440 |
| WY 2022 | 15,495 | 13,947 | 90 | 15 | 0.6 | 1.7 | 0.289 |
NOTE: MAF = million acre-feet.
SOURCES: Data from Chimney, 2018, 2019, 2020, 2021, 2022a.
- Low phosphorus loading rate (average = 0.8 g/m2-yr and 0.7 g/m2-yr for STA-2 and STA-3/4, respectively, during the recent 6-year period of record);
- Low inflow TP concentrations;
- Large treatment areas;
- High nitrogen-to-phosphorus (N/P) ratios of inflow water; and
- The 60,000 AF A-1 FEB, which attenuates peak inflows and also reduces TP concentrations and loads.
In addition, both STA-2 and STA-3/4 have benefited from active vegetation management including the use of EAV buffer strips in SAV-based flow-ways to control mobility of floc and improve the stability of the system during intense storm events (Figure 4-19; Chimney, 2021, 2022a; Reddy et al., 2019a).
EASTERN FLOW PATH (STA-1E AND STA-1W)
Inflows and Land Use
STA-1E and STA-1W in the Eastern Flow Path receive inflow water from the C-51 West, S-5A, and L-8 with some small regulatory releases from Lake Okeechobee. During the dry season, if water is available, Lake Okeechobee water is used to maintain hydrated conditions. Flow-weighted mean inflow concentrations averaged 166 µg/L and 181 µg/L, respectively, over the period of record, which is 65-80 percent higher than inflows in the Central Flow Path.
The L-8 FEB was established in 2017 as a 45,000 AF below-ground reservoir (58 feet deep) located on a former rock mining site in Palm Beach County (Figure 4-2). The FEB is designed to moderate inflows to STA-1E and STA-1W. In contrast to the A-1 FEB, which significantly removes phosphorus, phosphorus removal in L-8 FEB is much more modest. After large inflow events, TP concentrations in L-8 FEB spike for weeks, resulting in outflow TP concentrations exceeding inflows. This is likely due to the resuspension of accrued phosphorus-enriched organic sediments, which increase particulate phosphorus in the water column (Powers, 2022). However, except for WY 2018, the annual flow-weighted mean of outflow TP concentration was less than the inflow for WY 2019-2021 (Powers, 2022).
STA-1E Performance
STA-1E is the smallest treatment wetland of the Everglades STA network (Table 4-2; Figure B-4). Approximately 60 percent of the treatment area is managed as EAV/SAV (mixed marsh) and 40 percent is managed with exclusively EAV.

NOTES: EDC = east distribution cell, WDC = west distribution cell.
SOURCE: Modified from Chimney, 2022a.
STA-1E has been in operation for the past 17 years (since WY 2005) and over the period of record has reduced flow-weighted mean inflow TP concentrations from 166 µg/L to 38 µ/gL in the outflow (Chimney, 2022a). Over the most recent 10 years (WY 2013-2022), outflow concentrations met the upper annual average limit of the WQBEL (19 µg/L) in only 1 year (Figure 4-9). High annual average outflow TP concentrations were observed during WY 2018 due to the effects of Hurricane Irma and in WY 2021, when construction activities were ongoing in Cells 5 and 7 and a portion of the inflow water normally delivered to STA-1W was directed to STA-1E due to construction activities in STA-1W.
This resulted in substantial increase in hydraulic and phosphorus loading rates (Table B-3; Chimney, 2022a).
STA-1E has historically suffered from poor performance. During WY 2005-2012 the average flow-weighted mean outflow TP concentration was 56 µg/L, even though the average phosphorus loading rate was 1.2 g/m2-yr. During the most recent 6 years (WY 2017-2022), average phosphorus loading rates increased to 2.3 g/m2-yr, with a very high phosphorus loading rate recorded during WY 2021.
The addition of the L-8 FEB can store water so that it can be steadily delivered to the STAs, attenuating peak flows and preventing dry downs. In addition to the construction of the L-8 FEB, the Restoration Strategies program has included earthwork in Cells 5 and 7 to level the ground elevation to improve water depths for the targeted EAV and improve hydraulics in the cells. This regrading was completed in 2022. Currently STA-1E is in transition with recovery from earthwork, vegetation establishment and management, and high phosphorus accumulation rates in upstream treatment areas due to excessive hydraulic and phosphorus loading rates. Recent refurbishment projects should help the performance of STA-1E, but there may be a lag time to achieve these benefits, because the STA cells will require time to revegetate and reach steady state following the completion of regrading activities.
Overall, STA-1E has received much higher phosphorus loading rates than STA-2 and STA-3/4. It is critical that phosphorus loading rates to STA-1E be reduced to approximately the same level as STA-2 and STA-3/4 to improve phosphorus reduction in outflow waters. Current management projects as described above coupled with a reduction in phosphorus and hydraulic loading rates could
TABLE B-3 Summary of Select Hydrologic and Phosphorus Loading Characteristics of STA-1E During Recent 6 Water Years (WY 2017-2022)
| STA-1E | Treatment Area (acres) | Adjusted Effective Treatment Area (acres) | Inflow TP (conc’n) (μg/L) | Outflow TP (conc’n) (μg/L) | Phosphorus Loading Rate (g/m2-yr) | Hydraulic Loading Rate (cm/day) | Inflow Water Volume (MAF) |
|---|---|---|---|---|---|---|---|
| WY 2017 | 4,994 | 4,994 | 126 | 20 | 1.2 | 2.7 | 0.162 |
| WY 2018 | 4,994 | 4,994 | 265 | 47 | 2.6 | 2.7 | 0.161 |
| WY 2019 | 4,994 | 4,187 | 203 | 29 | 2.0 | 2.7 | 0.138 |
| WY 2020 | 4,994 | 3,533 | 94 | 21 | 1.4 | 4.1 | 0.174 |
| WY 2021 | 4,994 | 3,021 | 138 | 37 | 4.5 | 8.9 | 0.323 |
| WY 2022 | 4,994 | 2,733 | 119 | 22 | 2.3 | 5.3 | 0.173 |
NOTE: MAF = million acre-feet.
SOURCES: Data from Chimney, 2018, 2019, 2020, 2021, 2022a.
help improve performance and place STA-1E on a positive trajectory to reduce outflow TP concentrations.
STA-1W Performance
STA-1W was started in WY 1994 as the first STA of the Everglades Nutrient Removal Project with Cells 1A-4 (Figure B-5), expanding in 1999 with Cells 5A and B to a total of 6,554 acres (2,647 ha). In 2018, as part of Restoration Strategies an additional 4,266 acres of treatment area (Cells 6-8) were added as part of Expansion Area #1. This area was flooded in WY 2020 and became fully operational in WY 2021. At present, STA-1W has a total treatment area of 10,810 acres (4,378 ha). Targeted vegetation coverage by area includes 19 percent EAV and 81 percent EAV/SAV treatment cells. The EAV/SAV combination in each treatment cell may be an effective approach to maintain the stability of sediments.
A second expansion area (~1,600 acres) located south of STA-1W (see Figure 4-2) is under construction, with a goal of being operational by December 2024. This STA will be integrated with STA-1W, and both facilities will be utilized in series to optimize the performance to reduce outflow TP concentrations (Shuford et al., 2022).
Over the period of record (27 years) STA-1W has reduced flow-weighted mean inflow TP concentrations from 181 µg/L to 45 µg/L in the outflow (Chimney, 2022a). Over the recent 10 years (WY 2013-2022) in STA-1W, outflow concentrations met the upper annual average limit of the WQBEL (19 µg/L) in only 1 year (Figure 4-9; Table B-4), and average outflow TP concentrations over the 6 most recent years have remained high at 33 µg/L. Recent TP inflow loads (1.3 g/m2-yr over WY 2017-2022) remain higher than those in the Central Flow Path, although these loads have been reduced from prior average loading rates of 2.1 g/m2-yr during WY 2004-2012.
Recent and ongoing expansions will help reduce the phosphorus loading rate and improve STA-1W performance, and the L-8 FEB will attenuate peak flows and temporarily store water to facilitate steady delivery to the STA. Current concern of higher outflow TP concentrations of L-8 FEB during storm events needs to be addressed to reduce the load to the STA. In addition, refurbishment projects to improve hydraulics and topographic issues in the three flow-ways were completed in early WY 2023. Reestablishment of vegetation is under way and scheduled to be completed later in WY 2023 (Chimney, 2022a).
Currently STA-1W is in a state of transition with active management and vegetation establishment. STA 1-W is also experiencing high phosphorus accumulation rates in the soils of upstream treatment areas and excessive hydraulic and phosphorus loading rates. The expanded treatment areas will help reduce

SOURCE: Modified from Chimney, 2022a.
TABLE B-4 Summary of Select Hydrologic and Phosphorus Loading Characteristics of STA-1W During Recent 6 Water Years (WY 2017-2022)
| STA-1W | Treatment Area (acres) | Adjusted Effective Treatment Area (acres) | Inflow TP (conc’n) (μg/L) | Outflow TP (conc’n) (μg/L) | Phosphorus Loading Rate (g/m2-yr) | Hydraulic Loading Rate (cm/day) | Inflow Water Volume (MAF) |
|---|---|---|---|---|---|---|---|
| WY 2017 | 6,544 | 6,544 | 136 | 23 | 0.7 | 1.4 | 0.108 |
| WY 2018 | 6,544 | 6,544 | 228 | 39 | 2.1 | 2.5 | 0.195 |
| WY 2019 | 6,544 | 5,120 | 241 | 39 | 2.4 | 2.8 | 0.170 |
| WY 2020 | 6,544 | 5,551 | 146 | 35 | 1.0 | 2.0 | 0.130 |
| WY 2021 | 10,810 | 10,810 | 254 | 38 | 1.4 | 1.5 | 0.192 |
| WY 2022 | 10,810 | 10,810 | 158 | 24 | 0.3 | 0.4 | 0.057 |
NOTE: MAF = million acre-feet.
SOURCES: Data from Chimney, 2018, 2019, 2020, 2021, 2022a.
loading rates and improve overall performance and place STA-1W on a positive trajectory to reduce outflow TP concentrations. For example, the addition of Expansion #1 (4,260 acres added to STA-1W) and Expansion #2 (1,600 acres STA located south of STA-1W) will increase the total treatment area by 5,860 acres, which can potentially treat an additional 160,000 AF of water. This will help to reduce both hydraulic and phosphorus loading rates of both STA-1W and STA-1E. However, a lag time following these improvements will be required for the STA to stabilize and reach steady-state conditions.
Key Operational Factors Affecting Performance in the Eastern Flow Path
The following operational parameters of STA-1E and STA-1W are inconsistent with the conditions observed in the best-performing STAs (see also Table 4-2):
- High phosphorus loading rates (average = 1.7 g/m2-yr for STA-1E and STA-1W, respectively, during the period of record [WY 2006-2022 for STA-1E and WY 2005-2022 for STA-1W] and 2.3 and 1.3 g/m2-yr, respectively, during the recent 6 years);
- High inflow TP concentrations;
- Low N/P ratios of the inflow water; and
- Relatively small treatment areas.
WESTERN FLOW PATH
Inflows and Land Use
Runoff from the C-139 Basin is the primary source of water for STA-5/6. The C-139 Basin is located west of the EAA, and historically, land in this basin was used for cattle operations, sugarcane, and winter vegetables. For the past three decades, sugarcane and winter vegetables dominated agricultural activities in the basin. Soils in this watershed are predominantly occupied by sandy Flatwood soils, and crops grown on these soils are generally fertilized at a higher rate than crops grown on EAA organic soils. A significant portion of the phosphorus added to these crops is stored in soils and subject to gradual discharge into runoff. Together, these factors result in higher phosphorus concentrations in the C-139 Basin compared to the Central Flow Path (STA-2 and STA-3/4; Figure 4-12) and implemented best management practices have been less successful in reducing phosphorus. The regulatory source control program established under the 1994 Everglades Forever Act (Fla. Sta. §373.4592) for the C-139 Basin mandates that TP loads not exceed the average annual baseline (1978-1988) conditions when adjusted for rainfall. The C-139 basin is currently judged to be in compliance (Wang et al., 2022), even though in WY 2021 STA inflows were 281 µg/L. Because most of the inorganic nitrogen added to these soils is taken by crops, runoff discharged into STA-5/6 has low N/P ratios.
STA-5/6 Performance
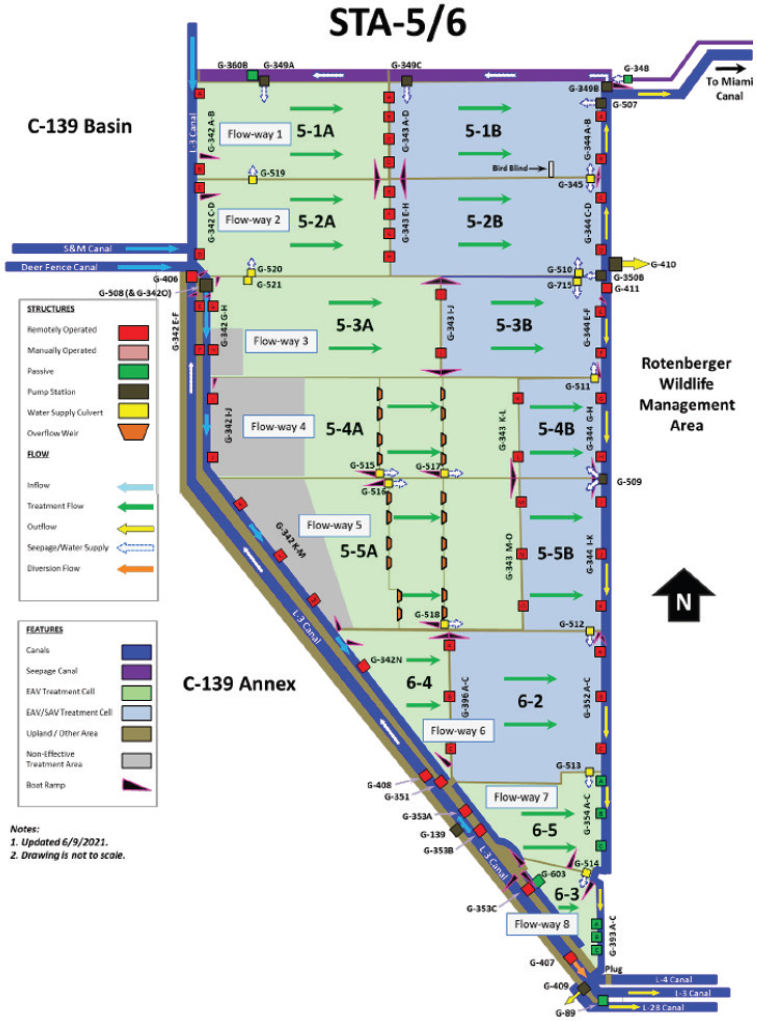
STA-51 and STA-62 were started in WY 2000 and WY 1998, respectively, as two separate STAs created to address the nutrient loads from the C-139 Basin and a portion of the EAA. In 2006, the STAs were expanded with the addition of Cell 5-3A/B and Cell 6-2, and in WY 2012 additional improvements were made by combining STA-5 and STA-6 and adding Compartment C (Cells 5-4A/B, 5-5A/B, and 6-4) to create STA-5/6 (Figure B-6). The optimization period for the expanded STA-5/6 was completed in 2014. Approximately 59 percent of the treatment area is managed as EAV, and the remaining 41 percent of the area is managed as EAV/SAV (Chimney, 2022a). In this report, performance data collected for STA-5 and STA-6 prior to WY 2012 were combined into one data set for ease of comparison; from WY 2013 onward, performance data for the newly created combined STA-5/6 are reported.
___________________
1 Originally consisting of Cells 5-1A, 5-1B, 5-2A, and 5-2B.
2 Originally consisting of Cell 6-3 and Cell 6-5.
SOURCE: Modified from Chimney, 2022a.
Over the period of record (24 years), flow-weighted mean inflow TP concentrations to STA-5/6 were reduced from 193 µg/L to 64 µg/L in the outflow, the worst performing of the five STAs (Chimney, 2022a). Over the most recent 10 years (WY 2013-2022), STA-5/6 produced outflow TP concentrations of 17 to 80 µg/L, with 2 out of 10 years meeting the upper annual average limit of the WQBEL (19 µg/L) (Figure 4-10). Average outflow TP values during the 6 most recent years (WY 2017-2022) have remained high (56 µg/L). High phosphorus loading rates associated with Hurricane Irma and management interventions contributed to high annual average outflow TP concentration observed during this period (Table B-5).
STA-5/6 has historically shown poor performance (Figure B-1), and early (WY 2004-2012) phosphorus loading rates to STA-5/6 were high (1.6 g/m2-yr). However, even though loading rates have declined sharply in the past 6 years (0.9 g/m2-yr during WY 2017-2022), STA-5/6 average flow-weighted mean outflow TP concentrations have not declined as expected, averaging 56 µg/L. During the past 9 years (WY 2014-2022), STA-5/6 functioned at an average 65 percent efficiency in reducing the phosphorus loads. Approximately 84 percent of the phosphorus retained over the period of record was retained separately in STA-5 and STA-6 up to WY 2012.
Restoration Strategies is providing internal improvements to STA-5/6, including earthwork and regrading on more than 1,100 acres, and the construction of the new C-139 FEB, which when completed and operational in 2024, is expected to hold 11,000 AF to provide additional water to help keep the STA hydrated during dry periods, although the C-139 is substantially smaller in volume than the A-1 and L-8 FEBs.
TABLE B-5 Summary of Select Hydrologic and Phosphorus Loading Characteristics of STA-5/6 During Recent 6 Water Years (WY 2017-2022)
| STA-5/6 | Treatment Area (acres) | Adjusted Effective Treatment Area (acres) | Inflow TP (conc’n) (μg/L) | Outflow TP (conc’n) (μg/L) | Phosphorus Loading Rate (g/m2-yr) | Hydraulic Loading Rate (cm/day) | Inflow Water Volume (MAF) |
|---|---|---|---|---|---|---|---|
| WY 2017 | 13,685 | 13,685 | 164 | 18 | 0.7 | 0.7 | 0.118 |
| WY 2018 | 13,685 | 13,685 | 234 | 74 | 1.4 | 1.7 | 0.271 |
| WY 2019 | 13,685 | 10,383 | 161 | 55 | 0.7 | 1.1 | 0.138 |
| WY 2020 | 13,685 | 11,111 | 226 | 58 | 0.8 | 0.9 | 0.124 |
| WY 2021 | 14,338 | 14,338 | 281 | 80 | 0.8 | 0.8 | 0.130 |
| WY 2022 | 14,338 | 13,841 | 243 | 50 | 1.0 | 1.1 | 0.178 |
NOTE: MAF = million acre-feet.
SOURCES: Data from Chimney, 2018, 2019, 2020, 2021, 2022a.
Currently STA-5/6 is undergoing a transition with management activities including reestablishment of vegetation. The current expanded treatment area along with vegetation and soil management should help to improve overall performance and place STA-5/6 on a positive trajectory toward lower outflow TP concentrations, although there will be a lag in system performance following management activities for the STA to reach new steady-state conditions.
Key Operational Factors Affecting Performance in the Western Flow Path
An analysis of key operational parameters shows that STA-5/6 faces some similar challenges as STA-1E and STA-1W and some unique challenges:
- High inflow TP concentrations;
- High early phosphorus loading rates but low loading rates (0.9 g/m2-yr) during the recent 6 years (average = 1.2 g/m2-yr- during the period of record, WY 2004-2022);
- Frequent dryouts in the dry season and low average annual hydraulic loading rate (1.1 cm/day average for recent 6 years), which means that the STA is in dry-down conditions for significant portions of nearly every year; and
- Low N/P ratios of the inflow water.
High inflow concentrations create challenges for STA-5/6 to meet the outflow concentrations of 13 µg/L. High outflow TP concentrations are likely due to low hydraulic loading rates and high concentrations in STA inflows. STA-5/6 experiences recurrent dry-down conditions and subsequent release of phosphorus upon rewetting, which causes very high concentration in STA discharges at the beginning of the wet season. For example in WY 2021, the SFWMD stated that dryout conditions existed in Cells 6-3 and 6-5 (Flow-ways 7 and 8; see Figure B-6) from December 2019 through April 2020 and in Flow-way 6 in April 2020, and other flow-ways were dry for part of the year (Chimney, 2021). In WY 2022, the dryout period was shorter for Flow-ways 7 and 8 (April-June 2021) but “most of the other cells partially dried out” (Chimney, 2022a).


