Rise and Thrive with Science: Teaching PK-5 Science and Engineering (2023)
Chapter: 4 Letting Children Lead During Investigation and Design
4
Letting Children Lead During Investigation and Design
Once you’ve motivated children with an intriguing phenomenon or design problem, elicited their initial ideas and questions, and introduced an investigation, how do you move them from exploring to explaining? How do you help students decide what kinds of data to collect, develop explanations or solutions based on that data, and connect their work to core science ideas?
This chapter explores how you can deepen students’ learning and engagement in science and engineering practices by letting them take the lead in key aspects of investigation and design. When students have greater responsibility for working through ideas, making decisions about next steps, and arriving at their own explanations and solutions, they learn more about science and engineering than if you had set it all up for them. This doesn’t mean that you, as a teacher, should step away entirely. Instead, your role shifts to providing careful guidance and support and anticipating where students may need the most help. Below, you’ll find ideas for the kinds of supports you can use and the moves you can make to center instruction on students’ ideas and voices.
The chapter focuses on aspects of three-dimensional instruction and learning that may be less familiar to many teachers and students. These include planning investigations and collecting data, analyzing and interpreting data, developing and using models, constructing explanations, and arguing from evidence. Practical strategies for teaching in this way are given throughout this chapter.
How can I support children in planning investigations and collecting data?
The decisions students make up front about how to conduct investigations and design
tasks and collect data set the stage for all of the other science and engineering practices discussed in this chapter.
Planning investigations and design tasks
When students plan investigations and design tasks, they will need to be involved in making important decisions like these:
- What to test and how to test it;
- What kinds of data they need;
- How they will collect data and what kind of tools will they use; and
- What will they measure and how they will measure it.
Children learn from being involved in making these decisions, even before they have started the actual investigation. And the planning process doesn’t end once the
investigation or design task begins. When something doesn’t go as planned, you may need to help children reconsider their decisions and make another plan.
The following third-grade case shows how one teacher helped children plan an investigation of why plants grow in different places. As you read through the case, take note of how the teacher lets students make key decisions while providing them with some structure and gentle support. Note, too, how children become vested in their work and develop a sense of responsibility for both the outdoor plants they observe and draw and the indoor plants they grow and monitor.
Collecting and recording data
The data collected in preschool through elementary science investigations comes in many forms. Children can collect quantitative data such as size, time, or distance; or qualitative data such as observations, drawings, and descriptions; or both.
Although this chapter uses the term “data,” the evidence gathered for sensemaking in the classroom may also include information from other resources, such as texts, media, and digital resources. (Sensemaking is defined in Chapter 3.)
Informational texts, for example, can expand children’s identity as scientific researchers and support their developing explanations. Media, including computer simulations and games, allow children to manipulate variables and test hypotheses.

Source: Manz, 2019, p. 83.
Data can be collected in a variety of ways. Students can directly observe and record, make measurements, conduct experiments, and work through computer simulations, among other approaches. These activities can be done by groups or individuals, or both.
Methods for recording data can be relatively simple. If children are gathering observational data, such as tracking weather patterns over time, you could have them record the counts of cloudy and sunny days with hash marks on a tally sheet or colored dots on a calendar. Other methods including having children write, draw, take photos, or simply record children’s verbal observations yourself.
You can scaffold children’s data collection with handouts like evidence sheets. In the “wild plants” investigation described above, Ms. Jafri gave her third graders evidence sheets with blank lines for recording the sun condition and plant’s height and empty space for adding drawings of the plant’s key characteristics and written observations (see Figure 4-2).
Science notebooks are another productive way for children to record observations and predictions. Notebooks are a place where students can record formal data and observations as well as informal thoughts and their reflections about the investigation and the phenomena or problem with which they are engaging. Notebooks also offer teachers a window into children’s thinking and can be very useful as a tool for formative assessment (see Chapter 6).
Deciding what and how to measure
In planning for data collection, students must make decisions about what to measure, how to measure it, and what tools will be needed to measure it. Measurements are

often made in units of size, distance, volume, or speed, but they need not be limited to formal units, nor do students have to use formal measuring devices. You can use something close at hand, such as cutting pieces of yarn to compare heights or distances, or using blocks to measure area.
Areas where children need particular support for planning investigations and collecting data
As part of planning investigations, children often struggle to design a controlled test. They are unsure which variables to test, what to compare, and which data to collect. They may have difficulty excluding variables that don’t make a difference. In an investigation that tracks the growth of plants with various combinations of light, water, and dirt, children may not realize that to figure out the impact of different variables on growth, they need to compare one variable at a time, such as plants with light vs. plants with no light. In a related challenge, children often don’t know how to systematically keep track of their trials instead of doing everything at once.
The level of scaffolding children require will vary by age or grade level. Younger children need more structure, but even preschool children can ask questions and make predictions that will shape an investigation. They can also make observations and record results. For example, to involve preschoolers in planning an investigation of plant growth using beans planted in cups filled with dirt, you might ask the chil-
dren to predict what will happen. If some predict that plants will need water to grow, and others predict that water is not needed, you could propose that they put water in some of the cups and not others. To support the children in collecting data, you could ask them to observe their plants every day and record their observations with drawings or photos. The children would see that the plants that were not watered would shrivel, which could lead to further discussions of what plants need to grow.
You can scaffold these practices, but remember that it is important to scaffold in a way that supports children in learning from their own experiences!
How can I support children in analyzing and interpreting data?
The data students gather is the grist for sensemaking. Before students can use data to construct an explanation, they must analyze the data so they can interpret it. There are many ways for students to structure data so that they can make sense of it. Some productive approaches you could use to help them include these options:
- Comparing the data of different groups;
- Noting patterns and relationships in data;
- Using patterns to answer questions or support or refute explanations;
- Comparing predicted results to actual results; and
- Making models (discussed later in this chapter).
When students analyze data from their own investigations and design tasks, they are testing their ideas against reality. This is an opportunity for you to help them directly experience the full process of discovery and the results of their efforts. They see what works and what doesn’t and where they need to gather more or different kinds of data. They also learn from comparing their ideas and their observations with those of other children. Through these experiences you will help children to develop deeper, more connected, and more flexible understanding of the science ideas and concepts needed for sensemaking.
The following fourth-grade example shows how one teacher skillfully guides students through the processes of analyzing data. The opening phenomenon in the roller coaster video captivates the children and sparks their curiosity. Notice how the teacher then leverages that curiosity to engage students in discussion about what their investigations are revealing so far and what else they need to do to answer their questions.
___________________
2 The example comes from Zembal-Saul, C., & Hershberger, K. (2020). Positioning students at the center of sensemaking: Productive grappling with data. In E. A. Davis, C. Zembal-Saul, & S. M. Kademian (Eds.), Sensemaking in elementary science: Supporting teacher learning. Routledge.
The rolling marbles example illustrates strategies you might use to solicit students’ input and support them in analyzing the findings of their investigations—all with the goal of advancing their sensemaking:
- Provide scaffolding through data recording sheets, while actively encouraging students to determine how to generate, record, and analyze data
- Give them opportunities to decide which variables to record and what claims the data allow them to make
- Strive to not directly contradict or agree with students’ claims but instead call attention to contrasting ideas to spur discussion
Through these discussions, you can help students to see data patterns and relationships among variables. You can encourage them to investigate further, reconsider their claims, and start thinking about scientific explanations.
Strategies for helping students analyze and interpret data
Children often need support in interpreting and analyzing data. The formats for representing data can help students see patterns, make comparisons, and do other analyses. You’ll need to consider which kind of format works best to accomplish the purpose of an investigation.
Many teachers use basic tally charts to summarize data from the whole class and support students in interpreting their data. Figure 4-3 shows an example of such a chart from a second-grade investigation of how wind and water can change dunes. Using a model “dune” made by pouring sand into a deep pan and adding a cup of water, the children blew air through straws against the dune to simulate wind and tilted the pan to simulate waves. After the investigation, during a whole-class discussion, teacher Grace Hernandez summarized the results with hash marks on a tally chart. This helped the students see that the wind made the sand move up the model dune and
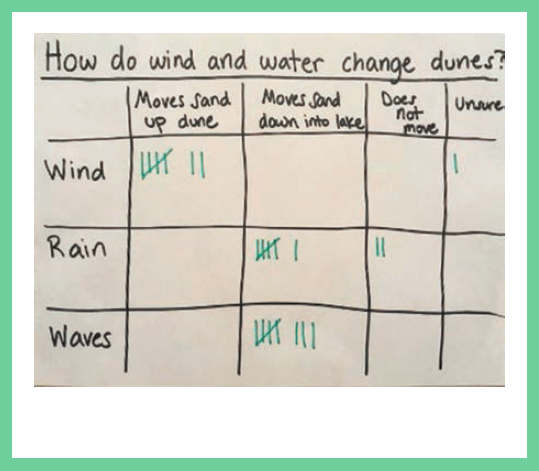
Source: Bismack et al., 2020, p. 39.
the water washed the sand into the model lake.3
While these kinds of data tables and charts are accessible to children and effective for finding patterns, organizing charts can pose a challenge for teachers and students. Without structure, the data can get “jumbled,” making it hard to analyze. With a little planning, you can help create a format that helps the patterns jump out at children.
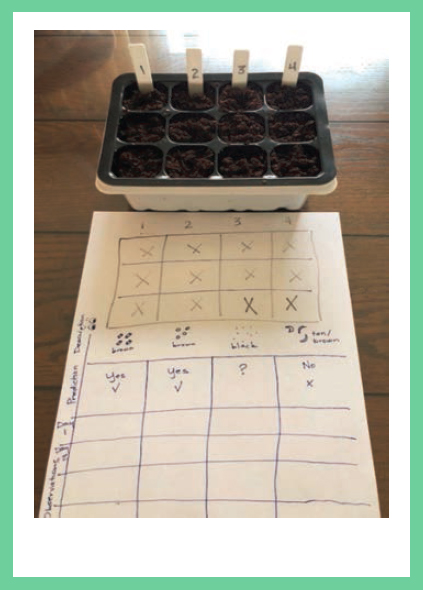
Imagine, for example, that your class is planning to plant flowers in the school garden but the seeds get mixed up. Students can begin sorting the seeds into piles by size, shape, and color. Once they have agreed on groupings, it is time to plant the seeds and see how they grow over the next few weeks. However, children may struggle with the complexity of the data—there are four different types of seeds with multiple samples of each. To help students identify patterns, you can plant each type of seed in a separate column of a planting tray with three samples of the same type in each cell. You can then create a large data table that mirrors the planting tray as in Figure 4-4.
Source: C. Zembal-Saul, personal communication.
Mathematics and scientific data analysis
Analyzing data offers opportunities for children to engage in another science and engineering practice—using mathematics and computational thinking. You can deepen children’s understanding of science or engineering and mathematics through various types of data analyses. In the wild backyard case described earlier in this chapter, students added up numbers of seedpods. In an engineering task to design a model windmill, students used multiplication to calculate the area of the blades in their windmill prototypes.4 When students are getting ready to analyze data, you could
___________________
3 Bismack, A. S., West, J., Wright, T. S., & Gotwals, A. W. (2020). Science and literacy team-up to support young children: SOLID Start science curriculum materials. MSTA Journal, 65(1), 33–42.
4 Manz, E. (2019). Getting a grip: A framework for designing and adapting elementary school science investigations. Science & Children, 56(8), 80-87.

Source: Dominguez et al., 2023.
include a mini-lesson to reinforce mathematics learning—a more immediate and relevant alternative to giving them a math worksheet.
Having students create graphs to record data during investigations and design work strengthens their scientific reasoning and mathematics skills. More importantly, as discussed in Chapter 7, graphs can support students’ sensemaking by helping them aggregate results across cases and identify patterns.
Preschool teacher Daniel Kim used a large graph to track children’s data from a plant growth unit and help them see patterns in their data (Figure 4-5). As a class, the children wrote the dates along the x-axis and the stages of plant growth along the y-axis. Mr. Kim described “data” as “information that you collect” from observing how “our” plants are growing. Children named their plants, and each plant was assigned a specific color. The children observed their plants periodically and documented the results by marking a star at the appropriate place on the graph.5
Areas where students need particular support with analyzing and interpreting data
Some aspects of analyzing and interpreting data are challenging for children. You can be on the lookout for these potential challenges and provide extra scaffolding when you see children struggling with them.
Often children downplay, or even overlook, the most important types of data from an investigation or design task. They may ignore parts of the data that don’t fit with their initial ideas, or they may become distracted by observations that aren’t relevant to the main question. For example, when a group of fourth graders used a computer simulation to investigate which characteristics of butterflies enabled them to
___________________
5 Dominguez, X., Vidiksis, R., Leones, T., Kamdar, D., Presser, A. L., Bueno, M., & Orr, J. (2023). Integrating science, mathematics, and engineering: Linking home and school learning for young learners. Digital Promise, Education Development Center, GBH. https://digitalpromise.dspacedirect.org/server/api/core/bitstreams/dd63fe27-fb4f4cdb-b40a-a2c9342de88c/content
survive bird predators, some children initially focused on the size of the butterfly or the number of butterflies clustered together on a flower.6 Over multiple iterations, the children came to recognize that the salient features were the colors of the butterfly and the colors of the flowers they landed on—the butterflies that were camouflaged were not eaten by birds and could reproduce.
In general, you can support children through any data analysis by reminding them of the phenomenon, the question they are investigating, their predictions, and what they already know about the phenomenon. This will help them reflect on how the data does or does not help to further explain a phenomenon.
How can I support children in developing and using models?
Even very young children recognize how one thing can be represented by another. During play, a rope becomes an imaginary firehose, bushes in a park become a fort, or a line of chairs serves as a train. Children also draw pictures to represent things and can interpret that pictures and photographs made by others are representations. This awareness can represent the initial stages of developing and using models and facilitate the refinement of this key practice for sensemaking.
In science and engineering education, models are more than concrete representations of, say, the solar system or a salt molecule. Models can help children understand things or processes that are too big, small, fast, or slow to experience first-hand, or too old or immense to conceptualize, such as geologic time or the vastness of space. The real power of models, however, lies in their ability to help students explain, predict, and make sense of phenomena. In the classroom, models not only reveal children’s thinking but also promote their sensemaking.
Modeling can be an effective way to help students gradually gain more knowledge of a concept like sound waves that they can’t see, as the following case illustrates. Notice how teacher Fredi King leads her third graders through multiple cycles of creating and refining models during a unit on the physics of sound.7 As the students conduct experiments, they add more explanatory features to their models with each iteration.
___________________
6 Dickes, A. C., & Sengupta, P. (2013). Learning natural selection in 4th grade with multi-agent-based computational models. Research in Science Education, 43, 921–953. https://doi.org/10.1007/s11165-012-9293-2
7 For teachers following the NGSS, this case is not aligned with the performance expectations for that grade level.
The power of models in sensemaking
You can best emphasize the learning power of modeling by having children develop their own models. This is far preferable to showing children models from a book, asking them to copy existing models, or having them build a model from a kit. Models often take the form of drawings, diagrams, or physical structures because these can be tested and revised over time. Many models also include text explanations. (The importance of writing in science is discussed later in this chapter and in Chapter 7.)
When children are asked to make a model, they will draw on their current understanding of a phenomenon or problem. They need to decide what to show and what to leave out, how to represent the main elements, and how to indicate relation-
ships between different parts of a system. The resulting model can be a record of a child’s thinking at a point in time, but it doesn’t end there. Models are effective tools throughout the sensemaking process. Children can create models to explore their initial ideas, organize and analyze data, and develop and communicate their explanations. They can refine their models as new evidence emerges and their understanding increases. You can also use models for formative assessment, as discussed in Chapter 6.
Models can address equity by offering multiple ways for children, including multilingual learners, to communicate their ideas. The sheer range of forms that models can take opens up new opportunities for all children to draw on their cultural ways of knowing to convey their thinking. For example, in an urban Midwestern district, children in grades 1–3, most of whom were Latinx and Black, used dramatic body movements to act out the interplay of animals, plants, and non-living entities in a forest “food web.”9 This modeling through dramatic play encouraged children to bring their everyday resources into the classroom and recruited their emotions as a resource in learning science.
Strategies for using models
Educators who incorporate modeling in their instruction emphasize several points about using models effectively.
- Young children need support to understand how models are intended to represent the real world. To support children in preschool through second grade in understanding and persevering in model making, teachers can first engage them in tasks that help them distinguish between models and real objects or events, and then provide them with different kinds of models to compare.
- Models are most powerful when children have opportunities to revisit and revise them. Students can use their experiences, along with disciplinary core ideas, to revise models of the same phenomenon or problem to reflect new evidence and knowledge. Comparisons of models by the same student over time show the progression of a student’s thinking. Working with models over multiple lessons can also give children the joy and sense of identity that comes from working as scientists and engineers do.
- Discussions about how to represent ideas can be constructive. After children have produced their initial models, it may be valuable for the class to discuss and
___________________
9 Varelas, M., Pappas, C. C., Tucker-Raymond, E., Kane, J., Hankes, J., Ortiz, I., & Keblawe-Shamah, N. (2010). Drama activities as ideational resources for primary-grade children in urban science classrooms. Journal of Research in Science Teaching, 47(3), 302–325.
- decide on whether and how to use certain conventions of representation, such as what arrows will represent, how to show time passing, or how they can “zoom in” to depict a key part of a process or object.
- A model can be a learning tool for others as well as its creator. Sharing and comparing student-produced models allows peers to interact with and learn from each other’s ideas. As children review each other’s models, they realize there are different ways of interpreting or explaining the same phenomenon or problem. The teacher can also monitor what individual children and the class as whole already know and where they need more instruction and support.
Areas where students need particular support with modeling
Findings from research and practice have identified aspects of modeling where children often need additional support. Here are some common challenges and strategies you can employ to address them:
- Connecting attributes of models with real phenomena. In science class, children may need support in choosing images or materials that correspond to the important attributes of a real-world phenomenon. For example, in a model of pollination, a pipe cleaner can represent a bee’s legs and ground chalk can represent pollen. Some lightweight particles of chalk dust can stick to the fuzzy pipe cleaner, somewhat like pollen sticks to a bee’s legs. By talking or working with children as they construct models, you can help them understand how different elements of a physical model or diagram correspond to the real-world phenomenon.
- Deciding what to put in and leave out. Models can’t show everything. What you want students to show in a model depends on which part of a phenomenon or problem is the focus of a particular lesson. For example, if you’re teaching how certain physical parts of a bee are structured to aid in pollination, you may look for a model that emphasizes the “fuzziness” of the bee’s legs. But that model may not represent well how a bee flies from flower to flower. You can support children in understanding the strengths and limitations of a model by having them compare different models and say what each one shows and hides. You can guide children to consider the most meaningful dimensions and sideline the potentially distracting elements.
- Considering parts of a process that can’t be seen or imagined. When children construct their initial models, they often focus on creating a literal likeness. They tend to omit processes, mechanisms, or components that are important to explaining how a phenomenon occurs but can’t be directly observed—things like
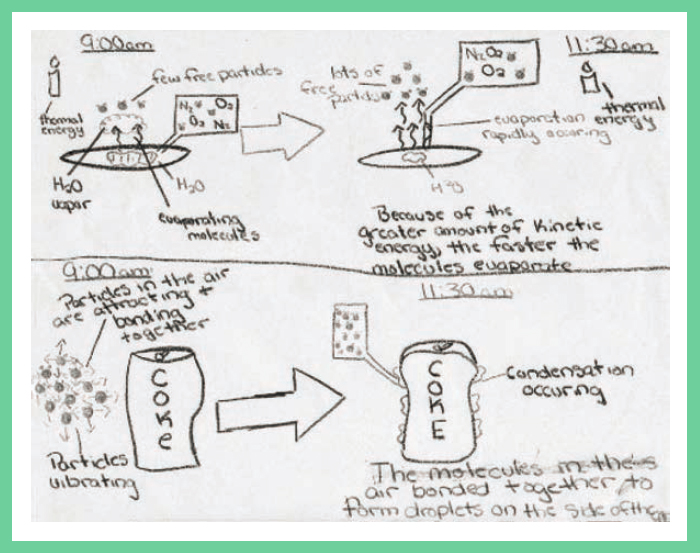
- particles, energy, or the passage of time. For example, when making a model of how condensation forms on a glass of ice water, a child may take pains to draw the glass, the ice, the water, and droplets of condensation on the outside on the glass. While it’s helpful for students’ models to visually resemble what they are representing, in this example key information is missing about how condensation occurs. Students often need support and reminders to think about the parts of a process they can’t observe or that occur over a period of time. You could ask a question like, “What do you know is happening that you can’t see?” You might futher ask, “How might you represent that?” Or you might ask them to draw three panels showing what happens before, during, and after a change. After additional investigation, instruction, and scaffolding, a fifth grader created a model of condensation that included representations of molecules, water vapor, energy, and the passage of time (Figure 4-9).10
Source: Schwarz et al., 2009.
___________________
10 Schwarz, C. V., Reiser, B. J., Davis, E. A., Kenyon, L., Achér, A., Fortus, D., Shwartz, Y., Hug, B., & Krajcik, J. (2009). Developing a learning progression for scientific modeling: Making scientific modeling accessible and meaningful for learners. Journal of Research in Science Teaching, 46(6), 632–654. For teachers following the NGSS, this example is not aligned with the performance expectations for that grade level.
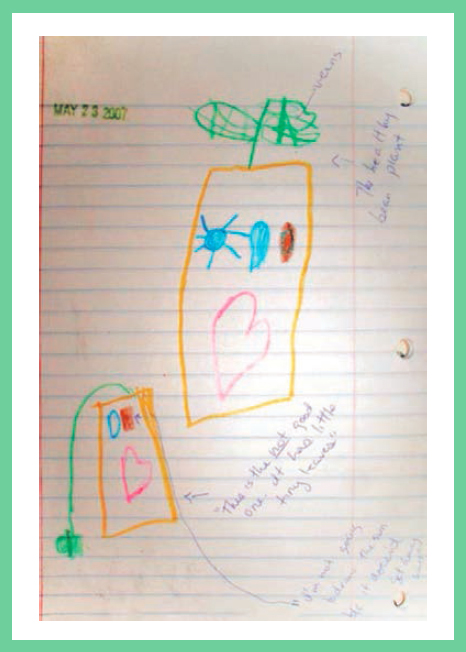
Children as young as preschool age can create informative models, with appropriate scaffolding. In a preschool investigation of plant growth, children observed both healthy and unhealthy bean plants. To give children an incentive to observe carefully, teacher Diane Dabrowski asked children to make drawings of what they saw. To further direct children’s attention to key features, Ms. Dabrowski asked the children to draw both a healthy and an unhealthy plant. Figure 4-10 shows a model drawn by a four-year-old child that compares two plants, one grown in sun and one without sun. The child accurately drew the ‘‘healthy’’ plant with a straight stem (top) and the “not good one” with a droopy stem and “tiny leaves” (bottom). The child also included the symbols introduced by Ms. Dabrowsky to designate whether the plant received sun, water, soil, and love. The child clearly understood the symbols, explaining that “I’m not going to draw the sun because [the unhealthy plant] doesn’t get any sun.”11
Source: Brenneman & Lauro, 2008.
What are the roles of explanation and argument in science and engineering instruction?
Explanation and argument are at the heart of scientific sensemaking. Yet, these practices are often overlooked in elementary science classrooms.
An explanation is a description of what caused a phenomenon or how a designed solution works. An argument is a description of how the evidence supports our explanations. That is, an argument is the logical chain of reasoning based on evidence that justifies a particular explanation or conclusion. During the flow of classroom activities, it can sometimes be difficult to distinguish between the two practices because they are so interrelated. Often, students move fluidly between constructing explanations and engaging in argument based on evidence. But it’s still important to distinguish between explanation and argumentation. Otherwise, this could put the emphasis on students’ arriving at the “correct” explanation rather than on mak-
___________________
11 Brenneman, K., & Louro, I. F. (2008). Science journals in the preschool classroom. Early Childhood Education Journal, 36(2), 113–119.
ing sense for themselves of the evidence they’ve gathered. It’s critical that you give students space to examine and reflect on the evidence, reason about what it reveals about the phenomenon or problem they are exploring, and discuss it with their peers.
Constructing and refining explanations
An explanation should make sense of a phenomenon using scientific facts. The answer to the question “why” or “how” drives an explanation. So, in learning about solar eclipses, a student may be able to explain how the sun, moon, and earth line up so that the sun appears to go black. In seeking a fuller scientific explanation, however, you might ask why solar eclipses appear so rarely in the same location on Earth.
To construct an explanation, children use evidence they have gathered from their investigations or design experiences together with information they may have learned from reading, videos, or other sources. An explanation may then be refined by examining how well any given explanation fits with all of the available evidence. This step often involves argumentation.
Arguing from evidence
Through argument, children can evaluate whether a proposed explanation accounts for all the known facts, and whether that explanation does this better than all other possible explanations. Often, the evidence that refutes an explanation is just as important as the evidence that supports it.
Students need opportunities to argue for the explanations they construct, defend their interpretations of the associated data, and advocate for the designs they propose. Learning to argue scientifically enables students to use their scientific knowledge to justify an explanation and identify weaknesses in others’ arguments, while also building their own knowledge and understanding.
What does it look like to support students with explanation and argument?
In the following example, Bree Jackson’s second graders are investigating how heating and cooling transform matter and which of the changes they observe are reversible. In one unit of their multi-unit study of heating and cooling, they seek to explain the effect of heat by baking a cake made of butter, egg, and chocolate chips, among other ingredients. Ms. Jackson uses an unexpected result involving the chocolate chips to begin moving children toward an explanation of the role of heat.
___________________
12 Manz, E., & Beckert, B. (2023). Quantification in empirical activity. Science & Education, 32, 447–480.
Ms. Jackson: So, what about the chocolate chips?
Sylvie: Chocolate chips, they don’t melt as easy as ice cream because ice cream is made out of milk, and milk is a liquid. But it’s really easy for chocolate to melt outside in the sunshine. If it’s in the fridge or freezer, it’s going to get colder.
Other students begin to debate whether the heated chocolate chips are solid, liquid, or both. They focus on the chips’ shiny texture and the observation that they kept their shape until stirred. Tony, another student, brings the conversation back to melting:
Tony: So, if there’s just a normal chocolate chip, then if you put it in something hot, it would melt, but if it was like a little shiny it won’t, but it will kind of.
Ms. Jackson: Oh, so do you think there are different stages of what happens with the chocolate when heat is added? I want to make sure I understand correctly. You’re bringing up that it got shiny. Are you thinking if it’s only a little, little bit shiny, it wouldn’t really have changed state? But if it’s really shiny that’s when you can stir it? So there’s a change that’s happening over time?
Source: Manz & Beckert, 2023.
Tony: Yeah.
Ms. Jackson: And do you think the amount of heat matters?
Tony: It doesn’t really matter because you won’t really know how much heat got on it . . . unless you set a timer, for like ten minutes.
Ms. Jackson: So, Tony, do you think it is fair if I write it changed level of shininess over time? . . . So you think the amount of heat does matter? (Writes question on a post-it note.)
(Portion of conversation deleted)
Amal: I know the amount of heat matters because I melted chocolate in a pot on the stove, and it cooked a little bit; it took a couple minutes, but it got really hot and melted into a liquid. I knew it was a liquid because it poured and it didn’t keep its shape, it
Notice how Ms. Jackson nudged students to think more about the processes of heating and cooling by asking questions like “Why is that happening?” and “Does the amount of heat matter?” She drew on their experiences at home, like eating ice cream or cooking on the stove, to help them develop explanations. Although some students expressed ideas that were not fully accurate, Ms. Jackson let them pass. Instead, she focused on parts of the children’s comments that could lead to more accurate explanations. And she asked them to support their thinking with evidence. The summary chart gave prominence to students’ claims and emphasized the importance of supporting these claims with evidence.

It really isn’t about you explaining to your students what the science idea is. It’s about you creating a learning environment in which they can construct the explanation.
—Carla Zembal-Saul, professor of science education, Penn State University13
How can I support children in constructing explanations?
Children bring strengths to the work of constructing and refining explanations and design solutions, but they require support to do this work. Providing scaffolding is often a large part of your role as children construct and refine explanations. This process often extends across multiple lessons, units, and grade levels.
Scaffolding strategies
As a starting point, students need explicit opportunities to construct and critique explanations. You can encourage them to develop explanations of what they observe when conducting their own investigations and to evaluate their own and others’ explanations for consistency with the evidence.
As students’ knowledge develops, you can help them begin to identify and isolate variables and incorporate the findings into their explanations of phenomena. They can try to explain the causes of what they observe. For example, in investigating the conditions affecting plant growth, children may notice that plants die when kept in the dark and may seek to explain this finding. Although their explanation may be as simple as “plants die in the dark because they need light to live and grow,”
___________________
13 Douglas, J. (2016, March 3). ‘What’s Your Evidence’ Book Study with Carla Zembal Saul 2 [Video]. YouTube. https://www.youtube.com/watch?v=Pgped5maXqQ&ab_channel=JanDouglas
it can serve as a basis for further questions and deeper understanding of photosynthesis in later grades. If you ask children to consider whether the notion that “plants need light to grow” explains all of their observations, they can appreciate that their simple explanation fails to account for why plants die when they get no water. If you encourage children to revisit their initial ideas, they can often produce more complete explanations that account for more of their observations.
Sensemaking depends on children continually refining their explanations and design solutions to incorporate new evidence, insights, and information. You can even use read-alouds to support students in this iterative process. For example, you could first review the progress of an investigation or design challenge and highlight remaining questions. Then you could read aloud a nonfiction text to connect concepts from the text to children’s developing ideas.
Areas where children might need extra support in constructing explanations
Developing viable explanations and design solutions is often challenging for children. They are particularly likely to need scaffolding with the following aspects of the process:
- Including key aspects in written explanations. A good explanation addresses both how and why something happens, is backed by evidence, and is connected to an understanding of core science or engineering ideas. While children may address one or more of these aspects when they are supported in discussions with you and/or their peers, they often struggle to put these together when they are developing an explanation on their own.
- Explaining things they can’t see or conceive of. Children often have trouble constructing explanations for things that are too tiny or immense, or too vastly far away or long ago, for them to conceive of or experience. They may struggle to connect what they observe during an investigation with the unseen processes and entities that underlie the phenomena they are exploring. How can you mitigate this? As noted previously, models help students articulate their explanations.
- Understanding the necessary role of failure in engineering. Children may be crestfallen or lose confidence when an engineering design doesn’t work as planned. They need support to help them recognize that failure is a necessary and productive part of the design process. You can reinforce this with stories of real engineers and actual situations in which an idea that seemingly flopped actually led to a breakthrough.
How can I support children in developing arguments?
Children can begin by constructing an argument for their own interpretation of the phenomena they observe and any data they collect. You may need to encourage students to go beyond just making claims. You can nudge them to include reasons or references to evidence in their arguments and can help them to distinguish evidence from opinion. Students may require support to discern which aspects of the evidence could support or refute a particular argument. You will find that as students gain competence in constructing scientific arguments, they can draw on a wider range of reasons or evidence, and their arguments will become more sophisticated.
Ask children to develop and share their claims
Arguments begin with claims, which are proposed answers to questions about how a phenomenon happens or how a human-made object or system functions. Arguments are built from evidence and bolstered by reasoning. Claims are linked through a chain of reasoning to create an argument.
Throughout your students’ explorations of phenomena or design problems, you can encourage them to develop and share their claims by posing questions or making suggestions like these:
- As children begin to engage with a phenomenon or problem: When have you seen this [phenomenon or problem] before in your life?
- As their investigation progresses: What do you think will happen when we test _______? What makes you think that?
- As they are finishing up an investigation: Do you think _______ is important? What’s your evidence for that?
- Toward the end of their explorations: Let’s develop a product (a field guide, signage for a local natural area, a letter to a local official, etc.) to say what we think now.
To reach all children, you should provide multiple means for them to formulate, share, and refine their claims and explanations. Models are a great tool for doing this; so is discussion, which is the focus of Chapter 5.
Although not required, writing is often integral to constructing claims, explanations, and arguments. Children (like adults) may believe they’ve come up with an explanation or argument, but when they try to write it out for others to understand, they may need to address the holes in their ideas. The act of writing helps them
to clarify their thinking. Figure 4-12 shows an argument written by a fifth grader in Lily Hamerstrom’s class after completing multiple observations to determine what happens over time to food and other garbage put into “landfill bottles.” The students investigated both closed and open bottles as part of the unit on garbage described in Chapter 3.14
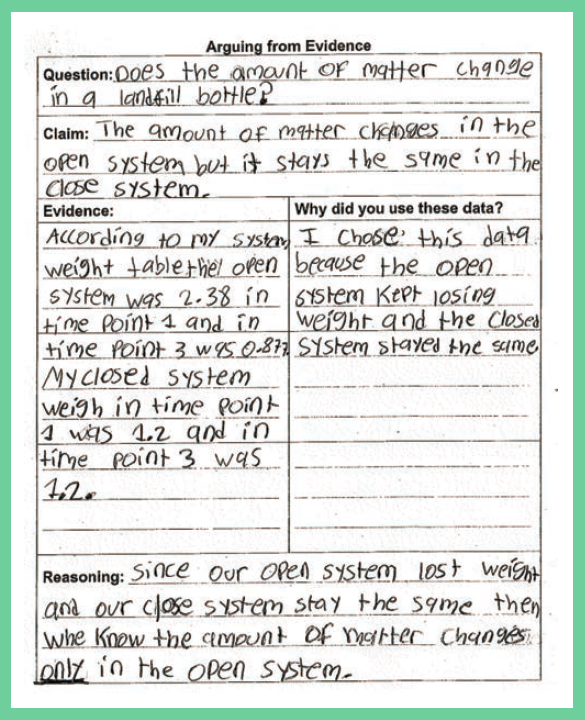
Source: Llosa et al., n.d.
Use a claim-evidence-reasoning framework
One common tool to support children in constructing arguments is the claim-evidence-reasoning (CER) framework. This framework often takes the form of sentence stems that invite children to make a claim and support it with evidence and reasoning. A basic CER framework includes sentence stems like these:
- I observed _______ when _______. (claim)
- I know that _______ is _______ because _______. (evidence)
- All of this proves that . . . because . . . OR The reason I believe _______ is _______. (reasoning or scientific idea)
___________________
14 Llosa, L., Grapin, S., & Haas., A. (n.d.). Integrating science and language for all students with a focus on English language learners: Formative assessment in the science classroom [Brief 7]. SAIL, New York University. https://www.nysed.gov/sites/default/files/programs/bilingual-ed/brief-7-formative-assessment-in-the-science-classroom-a.pdf
As you use the CER framework, keep in mind these tips:
- The sentence stems are phrased to help children reference both evidence from their investigations and their reasoning from developing science ideas. Sensemaking involves supporting a claim with both evidence and reasoning. In the second stem, the phrasing I know that because I have seen or done (response) is intended to bring out student’s evidence, while the third stem is intended to elicit their reasoning. That said, for preschool and elementary-aged children, the structure of using three separate stems is less important than getting at both their evidence and reasoning. If a student’s claim incorporates both evidence and reasoning, you may not need to use two separate prompts. But you may also need to use additional scaffolding for earlier grades. For example, instead of expecting first graders to write appropriate evidence, you might ask them to circle two of five pieces of given evidence that best support a claim that the class developed collaboratively.
- It’s more important to emphasize children’s ideas and sensemaking processes than to stick to the exact order of the three stems. The framework is intended to support children in learning how to construct arguments, but this isn’t likely to happen if you use the framework in a rote or formulaic way. It’s more productive to let the discussion evolve and incorporate the CER stems where they fit best. Feel free to vary the order; some discussions flow more naturally from evidence to claim to reasoning.
- Children often struggle the most with developing reasoning. This may be a place to provide extra support. As one strategy to support reasoning, you might start with the core idea or crosscutting concept that is a learning goal for a specific investigation. You might then anticipate how you can bring these ideas into focus as children reason about the investigation.
For example, if students are using a fan in the classroom to test a claim about whether seeds can travel by wind, you can support them in looking at how far their seed traveled as evidence. Their reasoning might focus on which features of the seed they think help it travel, such as the wings of a maple seed or the fluff on milkweed, or which prevent it from traveling far. In other words, you can guide them to develop an understanding of how the structure of something relates to its function. Their reasoning could also focus on what’s different when a seed travels outdoors. Children might propose that a maple seed would likely travel farther outdoors because it’s higher up on a maple tree than the seeds blown in a classroom.
- Developing and supporting claims can be more meaningful to children if you explicitly connect it to the work of scientists. For example, you might comment that “as scientists, we can’t just make a claim. We need to support it with evidence so that others we are communicating with understand our thinking!”
- You need to listen carefully to identify the science or engineering in children’s talk and support their efforts with follow-up questions and comments. Preschool and elementary children are generally not ready to explain their ideas using formal science and engineering terms or structures. (Chapter 5 includes detailed strategies for supporting children’s talk and introducing vocabulary.)
- The CER framework should be phased out over time, as students learn to support their claims with evidence and reasoning.
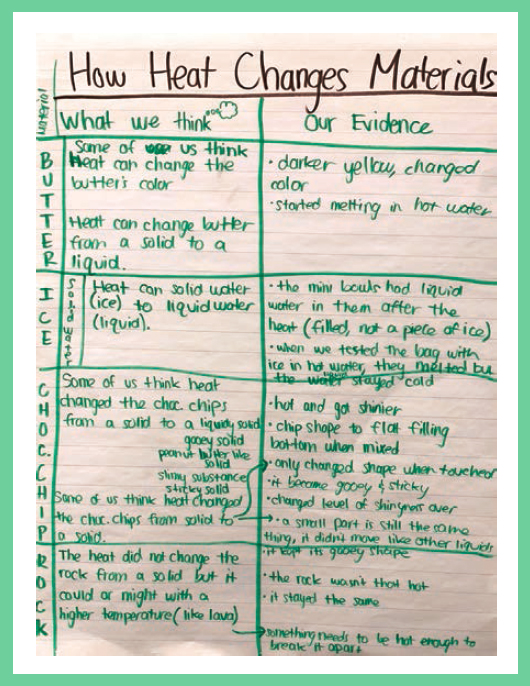
Introduce a KLEWS chart
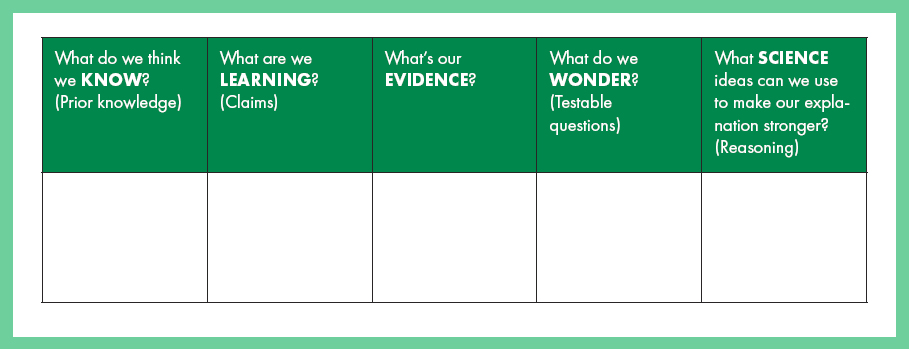
A KLEWS chart is a very child-friendly version of the CER that provides a structure for supporting a claim with evidence and reasoning (Figure 4-13). It includes five elements, typically organized as columns:
- K: What we think we know about the phenomenon
- L: What we are learning (our claims)
- E: Evidence from our data
- W: Our wonderings and questions
- S: Scientific ideas and words that help us understand (our reasoning)
When your class develops a KLEWS chart across a series of lessons, it can also fulfill another valuable function. It can provide a visible representation of how the class’s collective thinking evolves over time and how evidence helps students to support or refute their ideas. Some teachers make a row in the KLEWS chart for each investigation (or set of investigations) within a unit to help illustrate the growth in understanding and how new ideas can lead to new ideas.
The same advice discussed for the CER framework applies to the use of a KLEWS chart. Most notably, the focus should be on developing children’s ideas rather than on strictly adhering to the format of the chart. Like the CER framework, the KLEWS chart should also be phased out over time.
Source: Adapted from Hershberger, K. & Zembal-Saul, C. (2015). KLEWS to explanation building in science. Science and Children, 52(6), 66–71.
Going beyond CER and KLEWS
While the CER framework and the KLEWS chart are powerful scaffolds, they are starting points for increasing children’s competence at constructing explanations and arguments. Over time, students will become more familiar with developing arguments from evidence and ideally will not need the formal structure of the CER or KLEWS chart. Another way of going beyond the formal framework: if students are completing a CER individually, you will need to build in time for them to share their thinking through discussion. This can also improve their competence in understanding and critiquing other people’s arguments.
Areas where children might need extra support in constructing arguments
Children may ask productive questions and make promising claims well before they have developed an understanding of the disciplinary core ideas that underlie a phenomenon or problem. You can help them to advance their productive ideas by pressing for clarifications and evidence, frequently referring back to their observations from investigations, reminding them to use data to support their claims or refute someone else’s, and making time for them to revise their models and explanations.
Elevating equity and justice through sensemaking
Children’s sensemaking is shaped by their social and cultural contexts. Their prior knowledge and assets for learning science and engineering have been influenced by the norms and practices, implicit social goals, relationships, and resources present in these contexts.

The strategies you choose to support children in developing models, building arguments, constructing explanations, and designing solutions can also advance equity. For starters, these are central science and engineering practices. So, by emphasizing these aspects of sensemaking in instruction, you’re immersing children in the real work of scientists and engineers from an early age.
On a related note, when children construct models, explanations, and design solutions based on evidence, it strengthens their identities as knowledge builders, doers, and thinkers in science and engineering. By emphasizing the need to develop arguments, you also position them as participants who critically evaluate ideas and collaboratively advance knowledge.
As you work with children to design strategies for collecting data and constructing explanations and solutions, you can pay particular attention to these elements:
- Hearing and seeing the science and engineering in the varied ways that children communicate and the different ways of knowing that they bring with them
- Recognizing and expanding on practices embedded in your children’s communities
- Building on all children’s family, community, linguistic, and cultural practices in sensemaking
- Allowing for multiple types of models and other forms of representing children’s ideas
- Making all children’s contributions visible to the whole class and highlighting each child’s combination of strengths
- Seeking ways of connecting to authentic issues in your community that might help children recognize how science and engineering can help contribute to solutions to injustices
After reading this chapter you may be daunted by the prospect of supporting children as they take the lead in key aspects of sensemaking. Remember the advice from Chapter 1—you don’t have to do this at full speed all at once. But, as experienced researchers and practitioners emphasize, you do have to guide and support students all the way to the point of constructing explanations and arguments. Without that, they are missing vital practices of sensemaking. The good news is, as you become more adept at facilitating and scaffolding students’ work in one of these areas, it will carry over into other areas.