Nonhuman Primate Models in Biomedical Research: State of the Science and Future Needs (2023)
Chapter: Appendix B: Data on Nonhuman Primate Use in NIH-Supported Biomedical Research
B
Data on Nonhuman Primate Use in NIH-Supported Biomedical Research
This appendix serves as an accompanying resource to the major findings presented in the body of the report, specifically Chapter 3, on the current landscape of intramural and extramural research using nonhuman primates (NHPs) supported by the National Institutes of Health (NIH). It summarizes data from various stakeholders on NHP supply, investigator demand, impacts of NHP shortages, and future priorities for NHP models in NIH-supported biomedical research. The data presented below are grouped topically, where applicable. Appendix A provides an accounting of the committee’s data-collection methodology.
RESEARCH FACILITIES REPORTING NHP USE IN 2021
U.S. Department of Agriculture (USDA) data compiled from reports submitted annually by research facilities in the United States were the most complete data available to the committee on NHP use, although these data do not provide information on funding source (e.g., whether the research using NHPs was NIH supported), number of studies, species, research domain, or origin and ultimate destination of animals. Therefore, these data should be reviewed with the understanding that the numbers presented do not reflect NHP holding and use in the specific context of NIH-supported research. Despite these limitations, the USDA data provide a foundation for understanding the general distribution of NHP holdings and use in the United States over time, and these data can be categorized by stakeholders, some of which are largely or entirely supported by NIH (e.g., National Primate Research Centers [NPRCs]).
Table B-1 shows the distribution of NHPs across major stakeholders1 in fiscal year (FY) 2021 and is grouped by stakeholder type. The 34 facilities listed account for nearly 93 percent of the 113,502 NHPs reported as held or used to USDA in FY2021. This table shows the
___________________
1 For the purposes of this report, major research facilities include facilities reporting 400 or more NHPs held and used in FY2021. A similar cutoff was used in the 2018 report by the NIH Office of Research Infrastructure Programs (ORIP, 2018).
major commercial entities—including pharmaceutical and biotechnology companies, contract research organizations (CROs), and private-sector breeders/suppliers of animals for research—that account for over 43 percent of all NHPs reported to USDA in FY2021. As described in greater detail in Chapter 3, CROs and other facilities that breed and supply animals for research use can play a role in supplying NHPs for NIH-supported extramural and intramural research through direct sales to investigators or through awarded contracts or agreements with NIH.
Table B-1 also shows that intramural research facilities account for a much smaller proportion of NHPs held or used each year, although these figures do not include NHPs held or used off-site at CROs or in other stakeholder facilities using NIH funds (i.e., these off-site animals would be included in the counts of animals at the non-NIH research facility). Lastly, while the users listed in the table account for nearly 93 percent of NHPs reported to USDA in 2021, these facilities represent just under 23 percent of all research facilities holding or using NHPs. Table B-2 shows the numbers of NHPs held or used at major research facilities with 400 or more total NHPs on-site, ordered from highest to lowest total NHPs. This table breaks down the number of NHPs used for research purposes from those held but not yet used for research purposes. This latter category may include animals in breeding colonies.
| National Primate Research Centers (NPRCs)a 27,067 NHPs |
|---|
| California NPRC Emory NPRC Oregon NPRC Southwest NPRC Tulane NPRC Wisconsin NPRC Washington NPRC |
| National Resources Supported by the National Institutes of Health (NIH) Office of Research Infrastructure Programsb 8,112 NHPs |
| The Johns Hopkins University Michale E. Keeling Center for Comparative Medicine and Research at MD Anderson Cancer Center University of Puerto Rico (Caribbean NPRC) Wake Forest University |
| Other Academic Centers 11,815 NHPs |
| University of Louisiana at Lafayette (New Iberia Research Center) University of Pittsburgh University of Texas Medical Branch |
| Contract Research Organizations and Other Commercial NHP Suppliers 47,169 NHPs |
| Alpha Genesis, Inc. Altasciences Preclinical Battelle Memorial Institute Bioanalytical Systems, Inc. Biomere BIOQUAL, Inc. Charles River Laboratories Labcorp Early Development Laboratories Inc. Lovelace Biomedical Research Institute The Mannheimer Foundation, Inc. Northern Biomedical Research Inc. Primate Products, LLC. Valley Biosystems |
| Pharmaceutical and Biotechnology Companies 2,769 NHPs |
| AbbVie Bristol Myers Squibb Merck Pfizer |
| Federal Laboratories Intramural Research Programs 8,416 NHPs |
| National Institute of Allergy and Infectious Diseases – Morgan Island National Institutes of Health – Office of Animal Care and Use U.S. Army Medical Research Institute of Infectious Diseases |
NOTES: These facilities are listed in alphabetic order within their respective stakeholder categories and represent those research facilities that reported 400 or more NHPs held or used in fiscal year (FY) 2021. The Children’s Hospital of Philadelphia reported more than 400 NHPs onsite in FY2021 but is not included on this table as it does not fit into these major stakeholder categories. These 34 facilities account for nearly 93 percent of all NHPs held or used for research purposes in the United States in FY2021 (113,502 NHPs).
a These facilities hold NIH awards that involve the holding or use of NHPs for NIH intramural or extramural research purposes.
b These facilities host an NIH-supported breeding colony. In some cases, not all NHPs reported to USDA by the facility are supported by NIH funds, as these facilities also receive funding for domestic breeding and research from other sources.
SOURCE: USDA, 2021.
| Facility | Total NHPs Held Fiscal Year (FY) 2021a | Total NHPs Used FY2021b | Total NHPsc |
|---|---|---|---|
| Charles River Laboratories** | 2,258 | 17,105 | 19,363 |
| University of Louisiana at Lafayette* | 7,997 | 2,443 | 10,440 |
| Labcorp Early Development Laboratories Inc.** | 1,016 | 7,588 | 8,604 |
| Tulane University (Tulane National Primate Research Center [NPRC]) | 4,945 | 881 | 5,826 |
| Oregon Health & Sciences University (Oregon NPRC) | 4,278 | 1,382 | 5,660 |
| University of California, Davis (California NPRC) | 2,652 | 2,357 | 5,009 |
| The Mannheimer Foundation, Inc.** | 4,285 | 323 | 4,608 |
| Altasciences Preclinical** | 1,114 | 3,371 | 4,485 |
| University of Puerto Rico (National Resource) | 0 | 4,172 | 4,172 |
| Emory University (Emory NPRC) | 2,798 | 1,143 | 3,941 |
| National Institutes of Health | 692 | 3,127 | 3,819 |
| BIOQUAL, Inc.** | 0 | 3,657 | 3,657 |
| National Institute of Allergy and Infectious Diseases – Morgan Island | 3,509 | 0 | 3,509 |
| Facility | Total NHPs Held Fiscal Year (FY) 2021a | Total NHPs Used FY2021b | Total NHPsc |
|---|---|---|---|
| Texas Biomedical Research Institute (Southwest NPRC) | 1,841 | 1,119 | 2,960 |
| University of Texas, M.D. Anderson Cancer Center (National Resource) | 24 | 2,595 | 2,619 |
| University of Wisconsin (Wisconsin NPRC) | 896 | 1,511 | 2,407 |
| Biomere** | 0 | 1,284 | 1,284 |
| University of Washington (Washington NPRC) | 762 | 502 | 1,264 |
| U.S. Army Medical Research Institute of Infectious Diseases | 14 | 1,074 | 1,088 |
| Bioanalytical Systems, Inc.** | 271 | 750 | 1,021 |
| Merck | 106 | 878 | 984 |
| Lovelace Biomedical Research Institute** | 0 | 923 | 923 |
| Wake Forest University (National Resource) | 0 | 903 | 903 |
| Primate Products LLC** | 0 | 887 | 887 |
| Pfizer | 0 | 815 | 815 |
| University of Pittsburgh* | 9 | 804 | 813 |
| Northern Biomedical Research Inc.** | 0 | 661 | 661 |
| Battelle Memorial Institute** | 0 | 662 | 622 |
| Alpha Genesis, Inc.** | 0 | 572 | 572 |
| Bristol Myers Squibb | 25 | 544 | 569 |
| University of Texas Medical Branch* | 61 | 501 | 562 |
| Valley Biosystems** | 279 | 203 | 482 |
| Children’s Hospital of Philadelphia | 0 | 434 | 434 |
| The Johns Hopkins University (National Resource) | 191 | 227 | 418 |
| AbbVie | 85 | 316 | 401 |
| Total | 40,108 | 65,674 | 105,782 |
NOTE: This table includes the 35 facilities holding or using 400 or more NHPs per fiscal year; facilities are listed from most to least total NHPs reported to USDA.
a “Total NHPs held” describes the number of animals being bred, conditioned, or held for use in teaching, testing, experiments, research, or surgery but not yet used for such purposes (USDA, 2021).
b “Total NHPs used” describes the number of animals upon which teaching, research, experiments, or tests were conducted, regardless of whether or not pain was inflicted. This number does not include those animals held, bred, or conditioned for research but not yet used (USDA, 2021).
c “Total NHPs” describes the number of NHPs reported to be held, bred, or conditioned for research purposes but not yet used, and the number of NHPs used for research purposes in the identified fiscal year.
* Denotes an academic institution (excluding NPRCs and National Resources).
** Denotes a contract research organization or commercial NHP supplier.
SOURCE: USDA, 2021.
Table B-3 lists all facilities reporting fewer than 400 NHPs to USDA in 2021 and the number of animals held versus used for research purposes. Unlike Table B-2, which lists the major research facilities with 400 or more total NHPs reported to USDA and includes many CROs, suppliers of NHPs, and pharmaceutical and biotechnology companies, the research facilities listed in Table B-3 represent a higher proportion of academic institutions with most using a small number of NHPs. The 67 academic institutions in this table make up nearly 45 percent of all facilities reporting NHP use to USDA, but report just 3.7 percent of all NHPs held or used. Because of the limitations of available databases, the proportion of these academic institutions with investigators holding active NIH awards for NHP research is unknown.
| Facility or Organization | Total NHPs Held Fiscal Year (FY) 2021a | Total NHPs Used FY2021b | Total NHPsc |
|---|---|---|---|
| General Hospital Corporation | 0 | 370 | 370 |
| Massachusetts Institute of Technology* | 133 | 234 | 367 |
| Columbia University* | 13 | 210 | 223 |
| Southern Research Institute** | 37 | 180 | 217 |
| DuMond Conservancy for Primates & Tropical Forests | 13 | 198 | 211 |
| Frontage Laboratories** | 0 | 204 | 204 |
| IIT Research Institute** | 4 | 196 | 200 |
| University of Pennsylvania* | 0 | 192 | 192 |
| Duke University* | 3 | 182 | 185 |
| Centers for Disease Control and Prevention | 68 | 117 | 185 |
| University of Nebraska–Lincoln* | 0 | 185 | 185 |
| Boston University* | 3 | 165 | 168 |
| University of Texas at San Antonio* | 0 | 164 | 164 |
| Glaxo SmithKline | 31 | 128 | 159 |
| Envigo Global Services Inc.** | 105 | 51 | 156 |
| Center for Biologics Evaluation and Research | 0 | 155 | 155 |
| U.S. Army Medical Research Institute of Diseases Chemical Defense Commander | 22 | 126 | 148 |
| University of Illinois Chicago* | 29 | 119 | 148 |
| Broad Institute* | 55 | 92 | 147 |
| Yale University* | 77 | 66 | 143 |
| Salk Institute for Biological Studies* | 50 | 91 | 141 |
| McLean Hospital Corporation | 0 | 132 | 132 |
| Walter Reed Army Institute of Research | 34 | 98 | 132 |
| Vanderbilt University Medical Center* | 43 | 85 | 128 |
| University of Rochester* | 53 | 67 | 120 |
| Facility or Organization | Total NHPs Held Fiscal Year (FY) 2021a | Total NHPs Used FY2021b | Total NHPsc |
|---|---|---|---|
| University of Texas at Austin* | 44 | 57 | 101 |
| University of Nebraska–Omaha* | 2 | 99 | 101 |
| University of Maryland, Baltimore* | 0 | 100 | 100 |
| University of Mississippi Medical Center* | 0 | 98 | 98 |
| University of Alabama at Birmingham* | 0 | 93 | 93 |
| Food and Drug Administration/National Center for Toxicological Research | 38 | 52 | 90 |
| MRIGlobal | 0 | 87 | 87 |
| The Rockefeller University* | 0 | 82 | 82 |
| State University of New York, Brooklyn* | 2 | 79 | 81 |
| Sinclair Research Center, LLC** | 20 | 60 | 80 |
| Boehringer Ingelheim Pharmaceuticals Inc | 0 | 76 | 76 |
| BTS Research** | 30 | 43 | 73 |
| University of Houston* | 0 | 71 | 71 |
| AmplifyBio, LLC** | 0 | 68 | 68 |
| Washington University* | 0 | 65 | 65 |
| University of Kentucky* | 0 | 60 | 60 |
| University of Oklahoma* | 0 | 60 | 60 |
| University of California, San Diego* | 25 | 34 | 59 |
| BASi Gaithersburg** | 0 | 54 | 54 |
| Bucknell University* | 0 | 52 | 52 |
| Stanford University* | 24 | 27 | 51 |
| Lemur Conservation Foundation | 0 | 51 | 51 |
| State University of New York, Syracuse* | 44 | 5 | 49 |
| Harvard Medical School* | 0 | 48 | 48 |
| University of Nebraska Medical Center* | 0 | 47 | 47 |
| University of Utah* | 30 | 16 | 46 |
| Georgia State University* | 0 | 46 | 46 |
| Alcon Research | 45 | 0 | 45 |
| The University of Chicago* | 0 | 44 | 44 |
| Eastern Virginia Medical School* | 8 | 31 | 39 |
| Battelle National Biodefense Institute, LLC | 0 | 39 | 39 |
| Gibbon Conservation Center | 0 | 37 | 37 |
| Alamogordo Primate Facility | 37 | 0 | 37 |
| Weill Cornell Medicine* | 0 | 36 | 36 |
| Fort Worth Zoological Park | 35 | 0 | 35 |
| University of California, Berkeley* | 7 | 25 | 32 |
| Facility or Organization | Total NHPs Held Fiscal Year (FY) 2021a | Total NHPs Used FY2021b | Total NHPsc |
|---|---|---|---|
| Carnegie Mellon University* | 0 | 28 | 28 |
| Augusta University* | 0 | 28 | 28 |
| Brown University* | 0 | 26 | 26 |
| State University of New York College of Optometry* | 19 | 7 | 26 |
| Nathan S. Kline Institute for Psychiatric Research | 0 | 24 | 24 |
| California Institute of Technology* | 3 | 21 | 24 |
| Louisiana State University System* | 0 | 24 | 24 |
| SRI International** | 0 | 22 | 22 |
| University of Massachusetts Amherst* | 0 | 21 | 21 |
| East Carolina University* | 0 | 20 | 20 |
| The University of Arizona* | 0 | 20 | 20 |
| Air Force Research Laboratory | 11 | 9 | 20 |
| Barton’s West End Farms Inc.** | 1 | 18 | 19 |
| University of Massachusetts Medical School* | 0 | 17 | 17 |
| Princeton University* | 0 | 17 | 17 |
| Northwestern University* | 0 | 17 | 17 |
| Arizona State University* | 11 | 6 | 17 |
| Georgetown University* | 0 | 16 | 16 |
| University of Texas at Houston* | 0 | 16 | 16 |
| New York State Psychiatric Institute | 0 | 16 | 16 |
| Franklin & Marshall College* | 0 | 15 | 15 |
| Memorial Sloan Kettering Cancer Center | 8 | 7 | 15 |
| Albert Einstein College of Medicine* | 6 | 9 | 15 |
| Neuralink | 0 | 15 | 15 |
| The Ohio State University* | 0 | 14 | 14 |
| Calvert Laboratories, Inc.** | 0 | 14 | 14 |
| Loyola University Chicago* | 2 | 12 | 14 |
| Cleveland Clinic Foundation | 0 | 12 | 12 |
| University of Miami* | 0 | 12 | 12 |
| Legacy Health | 0 | 12 | 12 |
| The Methodist Hospital Research Institute | 0 | 12 | 12 |
| University of California, Los Angeles* | 0 | 11 | 11 |
| University of California, San Francisco* | 0 | 10 | 10 |
| Toxikon Corporation** | 2 | 6 | 8 |
| Florida Institute of Technology* | 0 | 8 | 8 |
| Smithsonian Institution | 0 | 7 | 7 |
| Ape Cognition and Conservation Initiative | 0 | 7 | 7 |
| Facility or Organization | Total NHPs Held Fiscal Year (FY) 2021a | Total NHPs Used FY2021b | Total NHPsc |
|---|---|---|---|
| State University of New York College of Technology* | 0 | 6 | 6 |
| Montana State University* | 3 | 3 | 6 |
| University of Kansas Medical Center* | 2 | 4 | 6 |
| Carleton College* | 0 | 6 | 6 |
| Experimur, LLC** | 5 | 1 | 6 |
| Rutgers Biomedical and Health Sciences New Jersey Medical School* | 0 | 6 | 6 |
| The Research Institute at Nationwide Children’s Hospital | 0 | 5 | 5 |
| University of North Carolina* | 0 | 4 | 4 |
| The Austin Savanna, LLC | 0 | 4 | 4 |
| Mount Sinai School of Medicine* | 3 | 0 | 3 |
| University of Southern California* | 0 | 2 | 0 |
| Kyle Taitt | 0 | 1 | 1 |
| 4 facility reports with no name listed | 0 | 233 | 233 |
| Total | 1,240 | 6,480 | 7,720 |
NOTE: This table includes the 114 research facilities reporting fewer than 400 NHPs in FY2021 and is ordered by facility from greatest to fewest total NHPs.
a “Total NHPs held” describes the number of animals being bred, conditioned, or held for use in teaching, testing, experiments, research, or surgery but not yet used for such purposes (USDA, 2021).
b “Total NHPs used” describes the number of animals upon which teaching, research, experiments, or tests were conducted, regardless of whether or not pain was inflicted. This number does not include those animals held, bred, or conditioned for research but not yet used (USDA, 2021).
c “Total NHPs” describes the number of NHPs reported to be held, bred, or conditioned for research purposes but not yet used and the number of NHPs used for research purposes in the identified fiscal year.
* Denotes an academic institution.
** Denotes a contract research organization or commercial NHP supplier.
SOURCE: USDA, 2021.
NHP RESOURCES FOR BIOMEDICAL RESEARCH
The following tables and figures support content in the section on NHP availability in Chapter 3. It should be noted that the supporting data presented do not focus exclusively on the supply of animals available and used only for NIH-supported research, as noted in the sections that follow.
NHP Importation
The Centers for Disease Control and Prevention (CDC) tracks all NHPs imported into the United States, regardless of whether they are being transported for use in research or for nonresearch use. Therefore, while the numbers presented below include all NHPs imported into the United States for research use, they may also include a minority of NHPs brought in for other purposes (e.g., for zoos or wildlife parks). The CDC does not maintain a database
tracking the purpose of each importation (CDC, 2022), so the exact proportion of imported NHPs intended for use in biomedical research could not be calculated.
Table B-4 shows the number of NHPs imported between FY2019 and FY2022, and illustrates the 21 percent decrease in total imported NHPs in FY2020 (following the start of the Chinese ban of NHP exportation) as compared with FY2019 levels. NHP imports in FY2021 were only 6 percent less than the FY2019 level.
Table B-5 reports NHP imports from FY2019 to FY2022 by species, showing that the importation of cynomolgus macaques in FY2020 was greatly impacted by the Chinese export ban, although the importation numbers for this species largely recovered the following year. In contrast, the importation of rhesus macaques has not returned to the FY2019 level. Importation of other species—African green monkeys, marmosets, squirrel monkeys, and capuchins—was higher in FY2021 as compared with FY2019 levels. These shifts in importation have secondary impacts on demand for domestically produced animals, as detailed in Chapter 3.
TABLE B-4 Total Nonhuman Primates Imported into the United States, by Fiscal Year (FY)
| FY (Dates) | Total Nonhuman Primates Imported (all species) | Percent Change from Previous Year |
|---|---|---|
| FY2019 (Oct 1, 2018–Sept 31, 2019) | 33,818 | N/A |
| FY2020 (Oct 1, 2019–Sept 31, 2020) | 26,728* | –21.0% |
| FY2021 (Oct 1, 2020–Sept 31, 2021) | 31,844 | 19.1% |
| FY2022 (Oct 1, 2021–Sept 31, 2022) | 32,811 | 3% |
*Includes one smuggled spider monkey.
NOTE: Due to data limitations, these numbers represent NHPs imported for a variety of purposes and do not represent animals imported exclusively for biomedical research use.
SOURCE: CDC, 2023.
TABLE B-5 Number of Nonhuman Primates Imported, by Species and Fiscal Year (FY)
| Nonhuman Primate Species | Number of Nonhuman Primates Imported | |||
|---|---|---|---|---|
| FY2019 | FY2020 | FY2021 | FY2022 | |
| Cynomolgus macaque | 32,273 | 24,879 | 30,649 | 31,617 |
| Rhesus macaque | 964 | 724 | 80 | 0 |
| African green monkey | 328 | 720 | 711 | 808 |
| Common marmoset | 195 | 326 | 284 | 172 |
| Squirrel monkey | 30 | 34 | 68 | 60 |
| Capuchin | 15 | 0 | 40 | 86 |
| Other* | 13 | 45 | 12 | 68 |
| Total | 33,818 | 26,728 | 31,844 | 32,811 |
*Other imported species varied by year but included colobus monkeys, siamangs, DeBrazza’s monkeys, geladas, saki monkeys, spider monkeys, emperor tamarins, bushbabies, and orangutans.
NOTE: Due to data limitations these numbers represent NHPs imported for a variety of purposes and do not represent animals imported exclusively for biomedical research use.
SOURCE: CDC, 2023.
Tables B-6 and B-7 detail importation trends by country of origin and species by country of origin, respectively, and illustrate the major shift in countries supplying NHPs to stakeholders in the United States. Table B-6 shows a sharp increase in animals imported from Cambodia and Mauritius, which corresponds with the sudden decrease in animals originating from China. Table B-7 details these trends at a species level. These data show that the countries of origin for imported cynomolgus macaques have shifted since FY2020. Although China was previously a major supplier of cynomolgus macaques to the United States, following the Chinese exportation ban in early 2020 the number of cynomolgus and rhesus macaques imported from China dropped to zero. In FY2021, imports of cynomolgus macaques originating from Cambodia, Vietnam, and Mauritius greatly increased. As compared to FY2020, FY2021 also saw increases in importation of capuchin and squirrel monkeys from Guyana. Chapter 3 describes the impacts of these changes in importation patterns and risks associated with the reliance of biomedical research on imported NHPs.
TABLE B-6 Number of Nonhuman Primates Imported, by Country and Fiscal Year (FY)
| Country of Origin | FY2019 | FY2020 | FY2021 | FY2022 | Net Change FY2019–2021 |
|---|---|---|---|---|---|
| Argentina | 1 | 0 | 0 | 0 | –1 |
| Barbados | 0 | 192 | 144 | 361 | +144 |
| Cambodia | 8,571 | 15,664 | 18,870 | 19,618 | +10,299 |
| Canada | 17 | 40 | 80 | 0 | +63 |
| China | 20,270 | 3,723 | 0 | 0 | –20,270 |
| Czech Republic | 0 | 4 | 0 | 0 | 0 |
| France | 0 | 0 | 0 | 12 | 0 |
| Germany | 39 | 4 | 0 | 0 | –39 |
| Guyana | 52 | 40 | 101 | 187 | +49 |
| Indonesia | 0 | 0 | 120 | 600 | +120 |
| Mauritius | 3,540 | 5,032 | 10,069 | 8,312 | +6,529 |
| Mexico* | 0 | 1 | 2 | 3 | +2 |
| Philippines | 0 | 700 | 350 | 355 | +350 |
| South Africa | 160 | 320 | 240 | 180 | +80 |
| St. Kitts | 328 | 528 | 567 | 447 | +239 |
| Suriname | 0 | 0 | 17 | 0 | +17 |
| United Kingdom | 0 | 0 | 44 | 4 | +44 |
| Vietnam | 840 | 480 | 1,240 | 2,732 | +400 |
| Total | 33,818 | 26,728 | 31,844 | 32,811 | –1,974 |
*Smuggled spider monkeys seized at the U.S.-Mexico border.
NOTE: Due to data limitations these numbers represent NHPs imported for a variety of purposes and do not represent animals imported exclusively for biomedical research use.
SOURCE: CDC, 2023.
TABLE B-7 Number of Nonhuman Primates Imported by Species, Country, and Fiscal Year (FY)
| Nonhuman Primate Species | Country of Origin | FY2019 | FY2020 | FY2021 | FY2022 |
|---|---|---|---|---|---|
| African green monkey | Barbados St. Kitts | 0 328 | 192 528 | 144 567 | 361 447 |
| Capuchin | Guyana Suriname | 15 0 | 0 0 | 38 2 | 86 0 |
| Cynomolgus macaque | Cambodia China Indonesia Mauritius Philippines Vietnam | 8,571 19,322 0 3,540 0 840 | 15,664 3,003 0 5,032 700 480 | 18,870 0 120 10,069 350 1,240 | 19,618 0 600 8,312 355 2,732 |
| Common marmoset | France South Africa United Kingdom Germany Guyana | 0 160 0 35 0 | 0 320 0 0 6 | 0 240 44 0 0 | 12 160 0 0 0 |
| Rhesus macaque | Canada China Germany | 16 948 0 | 0 720 4 | 80 0 0 | 0 0 0 |
| Squirrel monkey | Guyana Suriname | 30 0 | 34 0 | 63 5 | 60 0 |
| Other** |
Canada Argentina Czech Republic Mexico* Guyana Germany South Africa Suriname United Kingdom | 1 1 0 0 7 4 0 0 0 | 40 0 4 1 0 0 0 0 0 | 0 0 0 1 0 0 0 10 0 | 0 0 0 3 41 0 20 0 4 |
| Total | 33,818 | 26,728 | 31,844 | 32,811 | |
*Smuggled spider moneys seized at the U.S.–Mexico border.
**Other imported species varied by year but commonly included colobus monkeys, siamangs, DeBrzazz’s monkeys, geladas, saki monkeys, spider monkeys, emperor tamarins, bushbabies, and orangutans.
NOTE: Due to data limitations these numbers represent NHPs imported for a variety of purposes and do not represent animals imported exclusively for biomedical research use.
SOURCE: CDC, 2023.
NHP Resources at NPRCs and National Resources
As described in Chapter 3, NPRCs and National Resources receive funding from NIH’s Office of Research Infrastructure Programs (ORIP) to maintain NHP resources for NIH-supported biomedical research. These facilities house a range of NHP species, some of which are actively bred in domestic breeding colonies. The data presented in the tables that follow originate from information provided by the seven NPRCs and four National Resources following a committee request for information, as well as from USDA (see Appendix A).
Table B-8 shows the change in the number of NHPs reported held or used by the seven NPRCs to USDA between FY2015 and FY2021. When reviewing changes across all NPRCs, the total number of NHPs reported to USDA increased by just over 3 percent between FY2015 and FY2021, while the number of NHPs held but not used for research increased by
| Center | Total Nonhuman Primates (NHPs) Reported to USDA, FY2015 | Total NHPs Held in FY2015 | Total NHPs Used in FY2015 | Total NHPs Reported to USDA, FY2021 | Total NHPs Held in FY2021 | Total NHPs Used in FY2021 | Percent Change in Total NHPs Reported to USDA FY2015 vs. FY2021 | Percent Change in NHPs Held FY2015 vs. FY2021 | Percent Change in NHPs Used FY2015 vs. FY2021 |
|---|---|---|---|---|---|---|---|---|---|
| California NPRC | 6,078 | 3,359 | 2,719 | 5,009 | 2,652 | 2,357 | –17.6 | –21.0 | –13.3 |
| Tulane NPRC | 4,709 | 3,953 | 756 | 5,826 | 4,945 | 881 | 23.7 | 25.1 | 16.5 |
| Wisconsin NPRC | 2,513 | 1,124 | 1,389 | 2,407 | 896 | 1,511 | –4.2 | –20.3 | 8.8 |
| Washington NPRC | 1,316 | 554 | 762 | 1,264 | 762 | 502 | –4.0 | 37.5 | –34.1 |
| Emory NPRC | 3,604 | 1,598 | 2,006 | 3,941 | 2,798 | 1,143 | 9.4 | 75.1 | –43.0 |
| Southwest NPRC | 3,502 | 1,521 | 1,981 | 2,960 | 1,841 | 1,119 | –15.5 | 21.0 | –43.5 |
| Oregon NPRC | 4,459 | 2,111 | 2,348 | 5,660 | 4,278 | 1,382 | 26.9 | 102.7 | –41.1 |
| Total | 26,181 | 14,220 | 11,961 | 27,067 | 18,172 | 8,895 | 3.4 | 27.8 | –25.6 |
SOURCE: USDA, 2015, 2021.
nearly 28 percent, and the number of NHPs used for research purposes decreased by over 25 percent over the same time. However, when examining the data at the center level, there is no clear pattern of change. The data reported by the Wisconsin NPRC show a decline in the number of NHPs held and an increase in the number of NHPs used in research over this 6-year period. While the actual reasons for these shifts are not known, it is possible that NHPs originally included in breeding colonies had been shifted to research use. The reported values from the California NPRC showed a decrease in the number of NHPs held and in the number of NHPs used over these 6 years, although the reasons for these dual reductions are not clear, nor is it clear which change came first based on the data available. Lastly, the Tulane, Southwest, Oregon, Washington, and Emory NPRCs each showed an increase in the number of NHPs held; however, the Tulane and Oregon NPRCs reported an increase in the number of NHPs ultimately used in research, while the Southwest, Washington, and Emory NPRCs recorded a decrease in NHPs used over the same period. Again, because of limitations in the data available from USDA, the context underlying these changes is unknown.
Based on information provided by the NPRCs as summarized in Table B-9, 12 species of NHPs are currently held or used at NPRC facilities. Of these, rhesus and cynomolgus macaques are reported to be held or used at every center. Other species were reported by a smaller number of sites (1–3 NPRCs), suggesting that they are models used for fewer areas of research. Table B-10 shows the seven species reported as currently held or used by the four ORIP-supported National Resources. These tables do not report which species are being bred in colonies at NPRCs and National Resources.
| Nonhuman Primate Species | California NPRC | Oregon NPRC | Southwest NPRC | Tulane NPRC | Washington NPRC | Wisconsin NPRC | Emory NPRC |
|---|---|---|---|---|---|---|---|
| African green, vervet, grivet | X | X | |||||
| Baboon | X | X | |||||
| All capuchin species | X | ||||||
| Common marmoset | X | X | |||||
| Titi monkey | X | ||||||
| Cynomolgus macaque | X | X | X | X | X | X | X |
| Japanese macaque | X | ||||||
| Pig-tailed macaque | X | X | |||||
| Rhesus macaque | X | X | X | X | X | X | X |
| Sooty mangabey | X | X | |||||
| Squirrel monkey | X | X | X | ||||
| White-capped mangabey | X | ||||||
SOURCE: NPRC Information Request, 2022.
| Nonhuman Primate Species | MD Anderson Cancer Center | The Johns Hopkins University | Caribbean Primate Research Center | Wake Forest University |
|---|---|---|---|---|
| African green, vervet, grivet | X | |||
| Baboon | X | X | ||
| Common marmoset | X | X | ||
| Pig-tailed macaque | X | |||
| Rhesus macaque | X | X | X | |
| Squirrel monkey | X | |||
| All owl monkey species | X | |||
NOTES: These data may include NHPs not directly supported by Office of Research Infrastructure Programs funding. Additionally, these facilities may also hold or use other NHP species that were not reported in the facilities’ responses to the committee’s information request.
SOURCE: National Resources Information Request, 2022.
Annual Production from Breeding by Species
NPRCs and National Resources receive NIH support to maintain domestic colonies of NHPs for biomedical research use. Table B-11 shows the eight species with annual production from domestic breeding, as reported by the NPRCs to the committee. More than 3,500 NHPs were produced from breeding colonies at NPRCs in FY2021, and of these, nearly 85 percent were rhesus macaques. The corresponding data from National Resources can be found in Table B-12 and show that more than 1,300 NHPs were produced in FY2021 from breeding colonies managed by National Resources. As with the data reported by the NPRCs, most (76 percent) of the NHPs bred by National Resources were rhesus macaques.
| Nonhuman Primate Species | Annual Production from Breeding |
|---|---|
| African green, vervet, or grivet | 0 |
| Baboon | 100 |
| Squirrel monkey | 0 |
| Titi monkey | 7 |
| White-capped mangabey | 0 |
| All owl monkey species | 0 |
| All capuchin species | 0 |
| Nonhuman Primate Species | Annual Production from Breeding |
|---|---|
| Common marmoset | 158 |
| Macaque—crab eating, cynomolgus, or longtailed | 102 |
| Macaque—Japanese | 50 |
| Macaque—pig-tailed | 120 |
| Macaque—rhesus | 3,003 |
| Sooty mangabey | 6 |
| Other (chimpanzee) | 0 |
| Total | 3,546 |
SOURCE: NPRC Information Request, 2022.
| Nonhuman Primate Species | Annual Production from Breeding | ||
|---|---|---|---|
| African green, vervet, or grivet | 46 | ||
| Baboon | 98 | ||
| Squirrel monkey | 21 | ||
| Titi monkey | 0 | ||
| White-capped mangabey | 0 | ||
| All owl monkey species | 46 | ||
| All capuchin species | 0 | ||
| Common marmoset | 36 | ||
| Macaque—crab-eating, cynomolgus, or longtailed | 0 | ||
| Macaque—Japanese | 0 | ||
| Macaque—pig-tailed | 70 | ||
| Macaque—rhesus | 1,011 | ||
| Sooty mangabey | 0 | ||
| Total | 1,328 | ||
NOTE: These data may include NHPs produced in breeding colonies not directly supported by Office of Research Infrastructure Programs funding.
Annual Production from Breeding by Facility
Tables B-13 and B-14 list the number of NHPs produced at the NPRCs and National Resources in FY2021. These numbers do not include all NHPs produced for biomedical research use (they do not include numbers from NIH intramural facilities and breeding colonies outside the seven NPRCs and four ORIP-supported National Resources). As previously noted, NPRCs report an annual production of more than 3,500 NHPs annually, and National Resources report more than 1,300. Of the NPRCs, the Wisconsin NPRC produced the greatest number of NHPs, followed by the California NPRC. The Caribbean Primate Research Center accounts for more than half of NHPs produced by the National Resources in FY2021.
| NPRC | Annual Production from Breeding |
|---|---|
| California NPRC | 707 |
| Tulane NPRC | 606 |
| Wisconsin NPRC | 720 |
| Washington NPRC | 120 |
| Emory NPRC | 513 |
| Southwest NPRC | 240 |
| Oregon NPRC | 640 |
| Total | 3,546 |
SOURCE: NPRC Information Request, 2022.
| National Resource | Annual Production from Breeding |
|---|---|
| Wake Forest University | 46 |
| Caribbean Primate Research Center | 732 |
| MD Anderson Cancer Center | 365 |
| The Johns Hopkins University | 185 |
| Total | 1,328 |
NOTE: These data may include NHPs produced by breeding colonies not directly supported by Office of Research Infrastructure Programs funding.
INVESTIGATOR DEMAND FOR NHPs IN NIH-SUPPORTED RESEARCH
The tables and figures in this section support content in the Chapter 3 section on investigator demand for NHP resources. These data were collected from NIH-supported NHP researchers via a survey and from NPRCs, National Resources, and NIH via information requests (see Appendix A for data-collection methodology). The section begins with details on NHP researcher survey responses and subsequently provides data on NHP researcher sourcing practices and demand by research domain and NHP species. A copy of the survey sent to investigators and complete reporting of the frequency of responses by question are included in Appendix E.
NHP Researcher Survey Demographics
A total of 1,431 researchers were contacted with an invitation to complete the committee’s survey on NIH-supported investigator perspectives on and experiences with using NHPs in biomedical research. A total of 273 investigators responded (19.1 percent); three of these respondents reported incomplete data regarding their NIH awards (i.e., answered few questions). A total of 535 awards were reported by respondents2 with an average of two NIH research project grants per investigator (min = 1, max = 9). Institutions in which responding investigators carry out their research can be found in Table B-15. More than half (56 percent) of respondents included in the data analysis reported their affiliation as an “other academic center,” which represents facilities that are not an NPRC, a National Resource, or an academic center with an NHP breeding colony. Domains in which responding investigators conduct NHP research can be found in Figure B-1. Behavioral and systems neuroscience was the most reported research domain by responding investigators, followed by HIV/AIDS (human immunodeficiency virus/acquired immunodeficiency syndrome), viral infectious disease (non-HIV/AIDS), and visual system research.
| Institution in Which Nonhuman Primate Research Is Carried Out | Number of Survey Respondents |
|---|---|
| National Primate Research Center | 82 |
| National Resource or academic center with breeding colony | 23 |
| Other academic center | 153 |
| Commercial organization | 13 |
| Federal laboratory | 1 |
| Total Respondents | 272 |
NOTE: Table generated from responses to Question 113 from the NHP Investigators Survey.
SOURCE: NHP Investigators Survey, 2022.
___________________
2 These reported awards are based on the number of responses received to Question 2 of the survey. Complete information for six awards was not provided by respondents and these awards were excluded from further analysis.
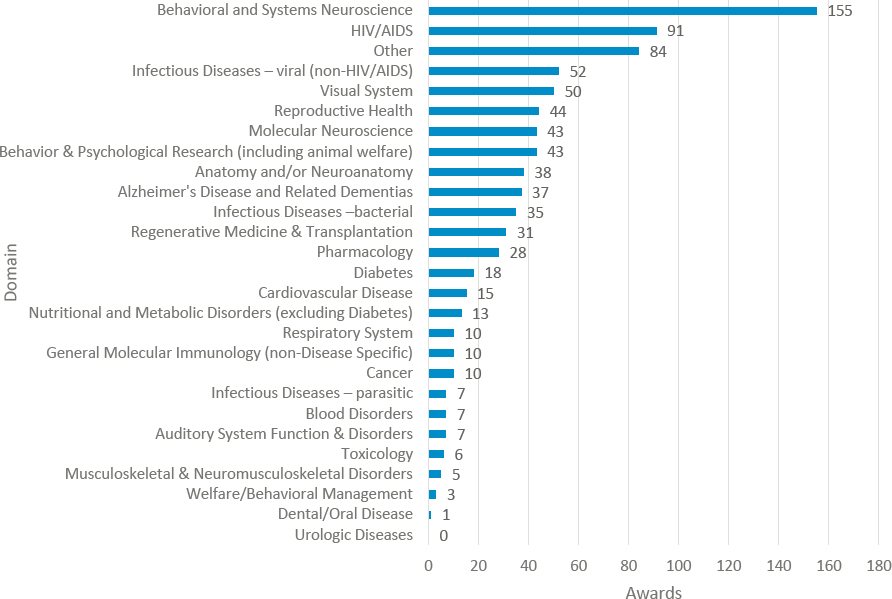
NOTES: Counts add to more than the number of responding investigators (n = 250) as some investigators reported having awards in multiple research domains. “Other” category included neurological disorders, including Parkinson’s disease; substance use disorders and addiction; biodefense and radiation effects; pregnancy and fetal programming; and aging, among others. Figure generated from responses to Question 12 from the NHP Investigators Survey.
SOURCE: NHP Investigators Survey, 2022.
Sourcing of NHPs for NIH-Supported Research
Among the active awards reported by responding NIH-supported NHP investigators, just over half used NHPs sourced from NPRCs (see Table B-16). Of those awards that used NHPs obtained from NPRCs, nearly 75 percent used rhesus macaques. NHPs were acquired from importers for approximately 14 percent of awards reported by responding NHP investigators. These data indicate that NPRCs serve as a major source of NHPs for NIH-supported research.
Access to NHP Models for Biomedical Research
Delays in the enrollment of NHPs for NIH-supported research projects were noted in the 2018 ORIP report Nonhuman Primate Evaluation and Analysis (ORIP, 2018) as a consequence of persisting NHP shortages. Among awards reported by NHP researchers responding to the committee’s survey, NHPs were received after the planned enrollment date for 41 percent of awards using any NHP species and 44 percent of awards using rhesus macaques—the most widely used and in-demand NHP species (see Table B-17).
| NHP Species | Home Institution | NPRC | Source Domestic Breeder | Importer | Other | Total Awards Using Each Nonhuman Primate Species |
|---|---|---|---|---|---|---|
| African green, vervet, or grivet | 6 | 2 | 0 | 1 | 1 | 10 |
| Baboon | 7 | 15 | 6 | 3 | 7 | 32 |
| All owl monkey species | 0 | 1 | 0 | 0 | 1 | 2 |
| All capuchin species | 0 | 0 | 0 | 2 | 1 | 3 |
| Common marmoset | 9 | 11 | 4 | 3 | 8 | 30 |
| Macaque—crab-eating, cynomolgus, or longtailed | 5 | 14 | 29 | 35 | 13 | 75 |
| Macaque—Japanese | 1 | 7 | 0 | 0 | 0 | 8 |
| Macaque—pig-tailed | 7 | 16 | 12 | 1 | 2 | 30 |
| Macaque—rhesus | 76 | 195 | 81 | 23 | 59 | 366 |
| Sooty mangabey | 0 | 0 | 0 | 0 | 0 | 0 |
| Squirrel monkey | 6 | 0 | 3 | 2 | 1 | 12 |
| Titi monkey | 0 | 1 | 0 | 0 | 0 | 1 |
| White-capped mangabey | 0 | 0 | 0 | 0 | 0 | 0 |
| Other—write in | 1 | 3 | 0 | 1 | 5 | 10 |
| Total Awards by Nonhuman Primate Source | 118 | 265 | 135 | 71 | 98 | |
NOTES: Total awards column may not reflect the sum of numbers in each row because some awards obtained the same species of nonhuman primates from multiple sources. Contingency table generated from unique awards (n = 506) reported by respondents to both Questions 5 and 11 from the NHP Investigators Survey. NPRC = National Primate Research Center.
SOURCE: NHP Investigators Survey, 2022.
| Awards for Which NHP Enrollment Time Information Was Reported | Number on Time | Number Late | Percent on Time (%) | Percent Late (%) |
|---|---|---|---|---|
| Overall (number of unique awards, n = 475) | 280 | 195 | 59 | 41 |
| Rhesus macaques (number of unique awards, n = 351) | 186 | 145 | 56 | 44 |
NOTES: Late enrollment included any award receiving NHPs after the planned enrollment date. Contingency table generated from award data reported by respondents to both Questions 9 and 10 from the NHP Investigators Survey.
SOURCE: NHP Investigators Survey, 2022.
NPRCs provide animals for use by investigators at their facilities and for use at external research facilities (e.g., an academic center that does not have a breeding colony on-site and requires marmosets for an NIH-funded study). Numbers of NHPs provided to NIH-funded investigators for use at a facility external to the NPRC varied by NPRC and year but generally were lower in FY2020 and FY2021 relative to the FY2018 and FY2019 numbers (Table B-18). The number of NHPs provided to external investigators for research carried out at the NPRC was lower in FY2019 and FY2020 relative to FY2018 numbers but in FY2021 increased above the FY2018 numbers (Table B-19). Data provided by the responding National Resources did not yield any clear trends in the provision of NHPs to external investigators conducting research at the National Resource facility or at a different location (Tables B-20 and B-21). It appears that the distribution of animals by the Caribbean Primate Research Center is the major driver in increasing provision of NHPs for research at external facilities and for a decline in the number of animals made available for use for research conducted within the center.
| NPRC | FY2018 | FY2019 | FY2020 | FY2021 |
|---|---|---|---|---|
| California NPRC | 86 | 160 | 150 | 23 |
| Tulane NPRC | 13 | 363 | 2 | 241 |
| Wisconsin NPRC | 0 | 7 | 0 | 14 |
| Washington NPRC | 112 | 51 | 44 | 75 |
| Emory NPRC | 0 | 0 | 0 | 22 |
| Southwest NPRC | 222 | 302 | 69 | 50 |
| Oregon NPRC | 175 | 217 | 221 | 66 |
| Totals | 608 | 1,100 | 486 | 491 |
SOURCE: NPRC Information Request, 2022.
| NPRC | FY2018 | FY2019 | FY2020 | FY2021 |
|---|---|---|---|---|
| California NPRC | 194 | 189 | 160 | 331 |
| Tulane NPRC | 145 | 92 | 65 | 112 |
| Wisconsin NPRC | 231 | 168 | 307 | 360 |
| Washington NPRC | 82 | 64 | 66 | 62 |
| Emory NPRC | 74 | 110 | 102 | 214 |
| Southwest NPRC | 59 | 49 | 18 | 24 |
| Oregon NPRC | 243 | 318 | 234 | 143 |
| Totals | 1,028 | 990 | 952 | 1,246 |
SOURCE: NPRC Information Request, 2022.
| National Resource | FY2018 | FY2019 | FY2020 | FY2021 |
|---|---|---|---|---|
| Wake Forest University | 4 | 8 | 36 | 14 |
| Caribbean Primate Research Center | 192 | 103 | 204 | 286 |
| MD Anderson Cancer Center | 140 | 118 | 106 | 135 |
| The Johns Hopkins University | 75 | 4 | 69 | 96 |
| Totals | 411 | 233 | 415 | 531 |
SOURCE: National Resources Information Request, 2022.
| National Resource | FY2018 | FY2019 | FY2020 | FY2021 |
|---|---|---|---|---|
| Wake Forest University | 81 | 35 | 11 | 34 |
| Caribbean Primate Research Center | 1,885 | 1,942 | 1,694 | 1,646 |
| MD Anderson Cancer Center | 62 | 64 | 40 | 108 |
| The Johns Hopkins University | 0 | 0 | 0 | 0 |
| Totals | 2,028 | 2,041 | 1,745 | 1,788 |
SOURCE: National Resources Information Request, 2022.
Needs for specific NHP characteristics, as well as external pressures (e.g., infrastructure and logistical issues), were found to be factors associated with poor accessibility of NHPs by NIH-supported investigators. Certain characteristics of investigators’ requests for animals from NPRCs and National Resources were noted by these stakeholders as contributing to longer wait times for animals (Table B-22). Particularly, all NPRCs and National Resources indicated that the need for a specific age of the requested NHPs was associated with longer wait times for animals. Sex and specific genotypes of requested NHPs were also commonly reported by NPRCs and National Resources as factors associated with increased wait times. Factors commonly reported by NPRCs and National Resources as impediments to meeting researcher demands for NHPs (Table B-23) included issues related to NHP housing, sufficiency of funding, and the time required to expand breeding colonies. These factors and challenges are described in Chapter 3.
| Nonhuman Primate Demographics Reported to Result in Longer Wait Times for Principal Investigators | Number of Reporting NPRCs That Selected the Response (n = 7) | Number of Reporting National Resources That Selected the Response (n = 4) |
|---|---|---|
| Age | 7 | 4 |
| Specific genotype | 7 | 2 |
| Sex | 6 | 4 |
| Species | 4 | 2 |
| Other—write in* | 4 | 1 |
* “Other” characteristics noted as associated with long wait times by responding NPRCs include viral infection status (n = 4), animal size and weight (n = 1), and pregnancy status (n = 1). Among responding National Resources, the single “other” response noted was viral status (n = 1).
SOURCES: NPRC Information Request, 2022; National Resources Information Request, 2022.
| Reported Challenges Faced by NPRCs and National Resources in Meeting Changes in Demand for Nonhuman Primates | Number of Reporting NPRCs That Selected the Response (n = 7) | Number of Reporting National Resources That Selected the Response (n = 4) |
|---|---|---|
| Housing | 7 | 2 |
| Funding | 7 | 3 |
| Length of time required for breeding colony expansion | 7 | 3 |
| Transportation | 4 | 2 |
| Lack of availability of animals for breeding | 3 | 2 |
| Other—write in* | 4 | 1 |
*“Other” challenges reported by responding NPRCs included staffing challenges (n = 4) and research infrastructure challenges (research equipment and nonhuman primate caging) (n = 2). Among responding National Resources, the single “other” response noted staffing challenges (n = 1).
SOURCE: National Resources Information Request, 2022; NPRC Information Request, 2022
As indicated earlier, in Table B-17, NIH-supported researchers experienced challenges with timely enrollment of NHPs in their studies. Among investigators responding to the committee’s survey and reporting issues with accessing NHPs, 72 percent associated these challenges with shortages of NHPs meeting specific demographics required for their study protocols, and 50 percent faced challenges accessing NHPs from their preferred source (see Table B-24). More detail about these challenges and associated impacts on NIH-supported research can be found in Chapter 3.
| Challenges Reported by Survey Respondents with Timely Enrollment of NHPs | Number of Respondents Reporting Specific Challenges Related to Timely Enrollment* (n = 175) | Percentage of Respondents Reporting Specific Challenges Related to Timely Enrollment (%) (n = 175) |
|---|---|---|
| Availability of specific demographics of NHPs (e.g., age classes, sex) | 126 | 72 |
| Availability from a preferred source | 87 | 50 |
| Funding and costs associated with obtaining NHPs | 76 | 43 |
| Infrastructure issues (e.g., lack of access to appropriate equipment for conducting research) | 50 | 29 |
| Transportation | 32 | 18 |
| Availability of NHPs with specific genotypes or genetic diversity | 27 | 15 |
| Other—write in* | 44 | 25 |
* Other issues reported as write-in responses related to challenges with obtaining NHPs were similar to those provided as options for the survey and included lack of availability of nonhuman primates with needed characteristics, delays related to COVID-19, limitations in NIH funding, available space, and staffing issues, among others.
NOTES: Table generated from responses to Question 115 from the NHP Investigators Survey. Respondents were able to select more than one challenge.
SOURCE: NHP Investigators Survey, 2022.
Demand for NHPs by Research Domain and Species
NPRCs, National Resources, NIH-supported investigators, and NIH institutes, centers, and offices were asked to consider areas for future demand for NHPs (see Figure B-2 and Tables B-25 and B-26). The most commonly listed domains generally overlapped across stakeholders and indicated existing and future demand for NHP models in neuroscience research, infectious disease, aging and aging-related diseases (such as Alzheimer’s disease and related disorders), and regenerative medicine. More information about priority research domains for current use and future NHP investment across these stakeholders is described in Chapter 3.
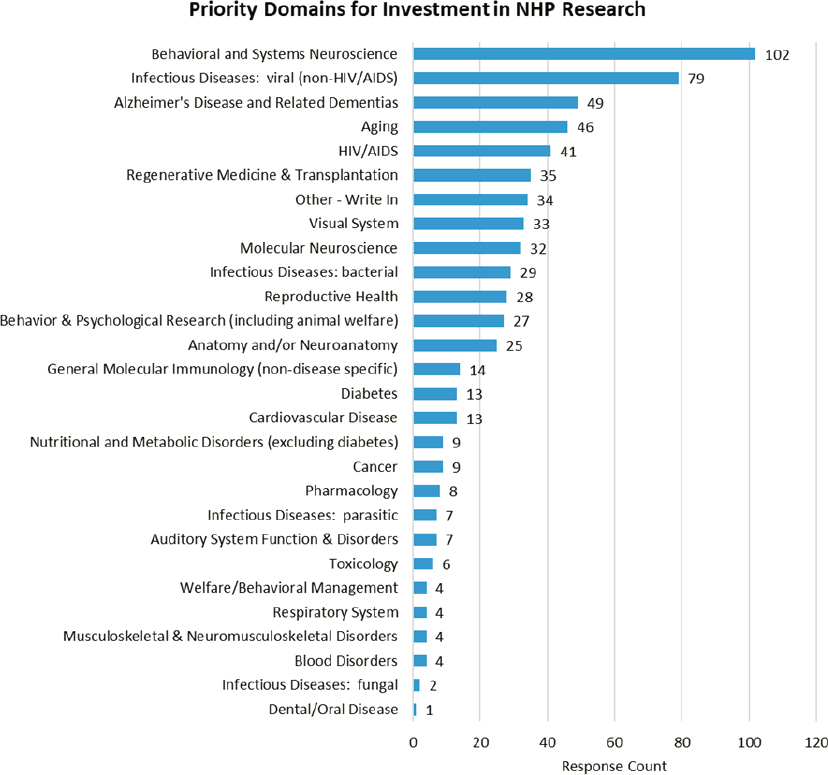
NOTES: Figure generated from responses to Question 119 from the NHP Investigators Survey. Respondents were able to select up to three priority research domains. A total of 259 respondents provided input on priority domains. HIV/AIDS = human immunodeficiency virus/acquired immunodeficiency syndrome.
SOURCE: NHP Investigators Survey, 2022.
| Research Domain | Number of Reporting National Primate Research Centers (n = 7) |
|---|---|
| Immunology and infectious disease | 7 |
| Neuroscience | 7 |
| Aging | 6 |
| Regenerative medicine | 6 |
| Metabolism | 5 |
| Neonatal disease | 5 |
| Reproductive health | 5 |
| Women’s health | 5 |
| Genetics | 4 |
| Genomics | 4 |
| Nutrition/obesity | 4 |
| Stem cells | 4 |
| Transplantation | 4 |
| Alcohol, drug abuse, addiction | 3 |
| Animal welfare | 3 |
| Children’s health | 3 |
| Developmental sciences | 3 |
| Heart, lungs, blood | 3 |
| Behavior/psychology | 2 |
| Vision | 2 |
| Cancer | 1 |
| Environmental enrichment | 1 |
| Psychological well-being | 1 |
| Allergy | 0 |
| Autoimmune | 0 |
| Digestive disorders | 0 |
| Endocrine | 0 |
| Kidney disease | 0 |
| Musculoskeletal | 0 |
| Oral/dental | 0 |
| Skin | 0 |
| Urinary health | 0 |
NOTE: Respondents were able to select multiple priority research domains.
SOURCE: NPRC Information Request, 2022.
TABLE B-26 National Resources Predicted Future Demand for Nonhuman Primates by Research Domain
| Research Domain | Number of Reporting National Resources (n = 4) |
|---|---|
| Immunology and infectious disease | 4 |
| Aging | 3 |
| Neuroscience | 3 |
| Behavior/psychology | 3 |
| Alcohol, drug abuse, addiction | 2 |
| Genetics | 2 |
| Neonatal disease | 2 |
| Regenerative medicine | 2 |
| Women’s health | 2 |
| Transplantation | 1 |
| Metabolism | 1 |
| Nutrition/obesity | 1 |
| Vision | 1 |
| Autoimmune | 1 |
| Cancer | 1 |
| Children’s health | 1 |
| Developmental sciences | 1 |
| Genomics | 1 |
| Stem cells | 1 |
| Animal welfare | 1 |
| Psychological well-being | 1 |
| Endocrine | 0 |
| Heart, lungs, blood | 0 |
| Allergy | 0 |
| Digestive disorders | 0 |
| Environmental enrichment | 0 |
| Kidney disease | 0 |
| Musculoskeletal | 0 |
| Oral/dental | 0 |
| Reproductive health | 0 |
| Skin | 0 |
| Urinary health | 0 |
NOTE: Respondents were able to select multiple priority research domains.
SOURCE: National Resources Information Request, 2022.
No available, comprehensive data sources describe the number of NHPs used in NIH-supported research or how NHPs are used across different research domains. Table B-27 shows the distribution of NHPs used in active NIH awards across research domains as self-identified by investigators who responded to the committee’s survey. The greatest number of NHPs used were reported for NIH awards associated with HIV/AIDS, behavioral and systems neuroscience, behavior and psychological research, reproductive health, and viral infectious diseases (besides HIV/AIDS). It should be noted that investigators were able to select more than one domain per
award; therefore, the numbers in the table do not represent the absolute number of NHPs used by investigators responding to the survey. Table B-28 describes the projected future NHP species needs by this same group of investigators and shows investigator interest in using rhesus macaques (82 percent of respondents who anticipate NHP use in the next 5 years), cynomolgus macaques (22 percent), common marmosets (11 percent), and baboons (11 percent).
| Research Domains of Current National Institutes of Health Awards Reported by Responding Investigators | Number of NHPs Used |
|---|---|
| HIV/AIDS | 6,310 |
| Behavioral and Systems Neuroscience | 4,537 |
| Behavior & Psychological Research (including animal welfare) | 4,511 |
| Reproductive Health | 4,301 |
| Molecular Neuroscience | 3,310 |
| Nutritional and Metabolic Disorders (excluding diabetes) | 3,177 |
| Anatomy and/or Neuroanatomy | 3,025 |
| Welfare/Behavioral Management | 2,845 |
| Infectious Diseases—Parasitic | 2,359 |
| Visual System | 2,306 |
| Dental/Oral Disease | 2,300 |
| Alzheimer’s Disease and Related Dementias | 1,445 |
| Cardiovascular Disease | 1,218 |
| Diabetes | 1,167 |
| Regenerative Medicine & Transplantation | 1,103 |
| Infectious Diseases—Bacterial | 899 |
| Cancer | 792 |
| Respiratory System | 561 |
| Pharmacology | 489 |
| General Molecular Immunology (non–disease specific) | 416 |
| Blood Disorders | 332 |
| Musculoskeletal & Neuromusculoskeletal Disorders | 323 |
| Toxicology | 217 |
| Auditory System Function & Disorders | 71 |
| Infectious Diseases—Fungal | 0 |
| Urologic Diseases | 0 |
| Other* | 2,902 |
* “Other” category included such write-in responses as Genetics and Genomics (950), Microbiome (400), Aging (391), Biodefense and Radiation Research (333), Neuroanatomy and Neurological Disorders and Injuries (173), Social Effects of Health (170), Substance Abuse and Addiction (134), Pain Research (21), Neuromodulation and Deep Brain Stimulation (12), Gene Therapy and Gene Editing (6).
NOTES: Contingency table generated from award data provided by respondents to both Questions 7 and 12 from the NHP Investigators Survey. Respondents were able to select more than one research domain per award, and NHPs used on an award can be represented in more than one category. The total number of NHPs across all awards reported by respondents to these questions was 17,729.
SOURCE: NHP Investigators Survey, 2022.
| NHP Species Projected for Future Use | Percent of Responding Future NHP Users (%) (n = 258) |
|---|---|
| Macaque—rhesus | 82 |
| Macaque—crab-eating, cynomolgus, or longtailed | 22 |
| Common marmoset | 11 |
| Baboon | 11 |
| Macaque—pig-tailed | 8 |
| African green, vervet, or grivet | 6 |
| Squirrel monkey | 3 |
| Other—write In | 2 |
| All capuchin species | 2 |
| Macaque—Japanese | 2 |
| All owl monkey species | 1 |
| Titi monkey | 0.4 |
| Sooty mangabey | 0 |
| White-capped mangabey | 0 |
NOTES: Table generated from responses to Question 118 from the NHP Investigators Survey. A total of 258 respondents responded to the question and were able to select more than one species in response.
SOURCE: NHP Investigators Survey, 2022.
NPRCs were prompted similarly to provide projections for future increases and decreases in researcher demand for NHP species (Table B-29) and identified high-demand species similar to those identified by the investigators responding to the committee’s survey. Six of seven NPRCs indicated that demand for certain species will increase, and of the six NPRCs that responded to this question, all projected increased demand for rhesus macaques.
| NHP Species | Number of NPRCs Reporting Projected Decrease in Demand (n = 7) | Number of NPRCs Reporting Projected Increase in Demand (n = 7) |
|---|---|---|
| Baboon | 0 | 2 |
| Common marmoset | 0 | 4 |
| Macaque—crab-eating, cynomolgus, or longtailed | 1 | 3 |
| Macaque—Japanese | 1 | 0 |
| Macaque—pig-tailed | 0 | 1 |
| Macaque—rhesus | 0 | 6 |
SOURCE: NPRC Information Request, 2022.
Openness Practices in NHP Research
Investigators who responded to the committee’s survey were asked to provide their experiences with engaging in various openness practices aimed at improving scientific rigor. Of the 263 researchers who answered the survey question, 81 percent indicated that they were engaged in the sharing of data in its raw or aggregate form upon the submission of a manuscript for publication. Other actions reported by respondents included actions to increase the transparency of study design and analysis (74 percent), the sharing of research materials (60 percent), and sharing of code or other analytic methods (50 percent) (Table B-30). These data suggest that interest in engaging in openness practices for the benefit of rigor are widespread.
| Openness Practices | Number of Respondents (n = 263) | Percentage of All Respondents (%) |
|---|---|---|
| Sharing data (i.e., raw or aggregate data are deposited in trusted repository minimally upon submission or publication of a manuscript) | 212 | 81 |
| Design and analysis transparency (i.e., publications detail sufficient experimental details to recreate experiments, including the use of standardized checklists such as the ARRIVE guidelines, reporting of variables such as social housing conditions of animals, etc.) | 194 | 74 |
| Research materials sharing (i.e., materials required to carry out experiment are deposited in a trusted repository or available via some other publicly known method) | 158 | 60 |
| Analytic methods (code) sharing (i.e., code to run analyses is deposited in a trusted repository) | 131 | 50 |
| Engagement in replicating existing studies | 70 | 27 |
| Meta-analytic or quantitative reviews of existing literature | 45 | 17 |
| Preregistration of studies | 21 | 8 |
| Preregistration of analysis plans | 17 | 6 |
| Other* | 21 | 8 |
*The “other” responses included the publication of results in peer-reviewed journals, tissue sharing, studies that combine research groups across multiple centers, and the use and sharing of standardized written methods and transparent data documentation, among others.
NOTES: Table generated from responses to Question 122 from the NHP Investigators Survey. A total of 263 unique investigators responded and were able to select more than one response. ARRIVE = Animal Research: Reporting of In Vivo Experiments.
SOURCE: NHP Investigators Survey, 2022.
PATHOLOGY, TISSUE ARCHIVES, AND RESOURCE SHARING
The seven NPRCs and four National Resources were asked to provide information on their tissue-archiving and resource-sharing practices. Responses varied across institutions in terms of the proportion of decedent NHPs undergoing necropsy examinations, the types of examinations performed, and the length of time tissues were archived. While all NPRCs
REFERENCES
CDC (Centers for Disease Control and Prevention). 2022. Request for Information from a National Academies Committee on Nonhuman Primate Model Systems. Document provided to the Committee on the State of the Science and Future Needs for Nonhuman Primate Model Systems on August 15, 2022. Available by request through the National Academies’ Public Access Records Office.
CDC. 2023. Request for Information from a National Academies Committee on Nonhuman Primate Model Systems. Document provided to the Committee on the State of the Science and Future Needs for Nonhuman Primate Model Systems on February 10, 2023. Available by request through the National Academies’ Public Access Records Office.
National Primate Research Center Information Request. 2022. Information Request Responses. Document provided to the Committee on the State of the Science and Future Needs for Nonhuman Primate Model Systems on August 10, 2022. Available by request through the National Academies’ Public Access Records Office.
National Resources Information Request. 2022. Information Request Responses. Document provided to the Committee on the State of the Science and Future Needs for Nonhuman Primate Model Systems on August 10, 2022. Available by request through the National Academies’ Public Access Records Office.
NHP Investigators Survey. 2022. See Appendix E.
ORIP (Office of Research Infrastructure Programs). 2018. Nonhuman primate evaluation and analysis Part 1: Analysis of future demand and supply. https://orip.nih.gov/nonhuman-primate-evaluation-and-analysis-part-1-analysis-future-demand-and-supply (accessed January 17, 2023).
USDA (U.S. Department of Agriculture). 2015. Annual reports search. https://aphis-efile.force.com/PublicSearchTool/s/annual-reports (accessed May 25, 2022).
USDA. 2021. Annual reports search. https://aphis-efile.force.com/PublicSearchTool/s/annual-reports (accessed January 1, 2022).


