Increasing the Utility of Wastewater-based Disease Surveillance for Public Health Action: A Phase 2 Report (2024)
Chapter: 2 Sampling Methods for Endemic Pathogens
2
Sampling Methods for Endemic Pathogens
In this chapter, the committee discusses sampling approaches for a national wastewater surveillance system focused on endemic pathogens. Endemic pathogens are consistently present in the country but may have regional, seasonal, or year-to-year variability in their prevalence, leading to outbreaks of concern to communities or the nation. A system focused on endemic pathogens would require different sampling approaches than systems focused on emerging pathogen spread and outbreaks, which are discussed in Chapter 6. The committee provides an overview of the major considerations of the methods for wastewater sampling strategies, including spatial distribution, temporal distribution, and sampling methods. As discussed in the committee’s Phase 1 report (NASEM, 2023), close collaboration with wastewater treatment plants, which provide samples and expertise, and dedicated resources to enable their participation are integral to any effort to improve sampling for wastewater surveillance.
OVERARCHING CONSIDERATIONS
Unlike clinical samples collected from a single person, wastewater samples represent a composite of the biological material of many individuals—from a few hundred to a few million. Available wastewater surveillance sampling strategies have different trade-offs in terms of the representativeness of the sample, equipment cost and maintenance, and staffing cost and capacity. Representativeness in wastewater surveillance can be described as how well the sample captures an equivalent amount of the pathogen biomarkers shed by infected individuals in the sewershed over a specified time period.
When considering wastewater sampling strategies for endemic pathogens, it is perhaps helpful to first envision an ideal or extreme sampling scenario that would provide the best possible representation of pathogen inputs from the community to better understand the trade-offs of sampling decisions.
An ideal wastewater sampling scenario for disease surveillance would involve every sewered community, with each sample including equivalent amounts of each person’s fecal matter, urine, and other bodily secretions deposited throughout the previous 24-hour period in the sewershed. In this way, sample material (e.g., feces, urine) from a single infection in the community could be captured in every sample. In this scenario, “ideal” composite samples would be collected every day in every sewershed—or even sub-sewersheds for higher spatial resolution—in the country. Were this technically and financially feasible, the full dynamics of pathogen shedding in every sewered community could be captured. Even under this ideal scenario, interpretation may be challenged by natural variability, such as variation in shedding rates among infected individuals and wastewater flow rates. The other extreme may be where a small grab sample (a single sample taken at one point in time) is collected from a sewershed rarely, both temporarily and geographically. Where a sampling strategy should fall on the spectrum from grab samples collected rarely (e.g., monthly) in very limited locations to near-perfect 24-hour composite samples collected daily in every sewershed depends on the intended use of the information, wastewater treatment plant staff capacity for sampling, and funding constraints.
Much has been learned about the trade-offs in wastewater sampling to assess trends in COVID-19, but the potential addition of other targets beyond SARS-CoV-2 (see Chapter 5) necessitates consideration of their optimal sampling strategies and the costs and benefits of implementing a common sampling strategy for all. As the wastewater surveillance system evolves for other use cases or priorities, the optimal sampling frequency, sampling site distribution, and even sample volume to achieve actionable data on a specific target may vary.
SPATIAL DISTRIBUTION
In this section, the committee discusses the spatial distribution of NWSS sampling at state and national levels, including potential benefits of finer-scale sampling, such as sub-sewershed and facility sampling.
Spatial Distribution of NWSS Sampling Sites
Wastewater surveillance sites were brought into the National Wastewater Surveillance System (NWSS) during the public health crisis of the COVID-19 pandemic, and site selection was mainly driven by the ability of
wastewater treatment plants to provide samples and the analytical capabilities of jurisdictions. In the committee’s Phase 1 report (NASEM, 2023) the committee recommended a national wastewater surveillance system that is flexible, equitable, integrated, actionable, and sustainable. To achieve this vision, the committee recommended that the spatial distribution of sites be subject to intentional design, with adjustments as needed to optimize the network to address its intended purpose(s) without unnecessary redundancies to allow the system to be sustainable for decades to come. The NWSS sampling network should also be designed to be representative of the underlying population (NASEM, 2023). In additon to considering the overall coverage of the population, a representative sampling network for endemic pathogens should be
- Geographically representative, including socioeconomic and demographic differences in the U.S. population; and
- Able to capture key at-risk populations (e.g., communities with high social vulnerability or populations that are at higher risk for particular target pathogens).
Individual states and jurisdictions typically assess where surveillance should be done within their own unique constituencies based on their knowledge of at-risk communities. This necessitates a degree of flexibility in the structure of a national system to ensure it is at least partially customizable based on local needs.
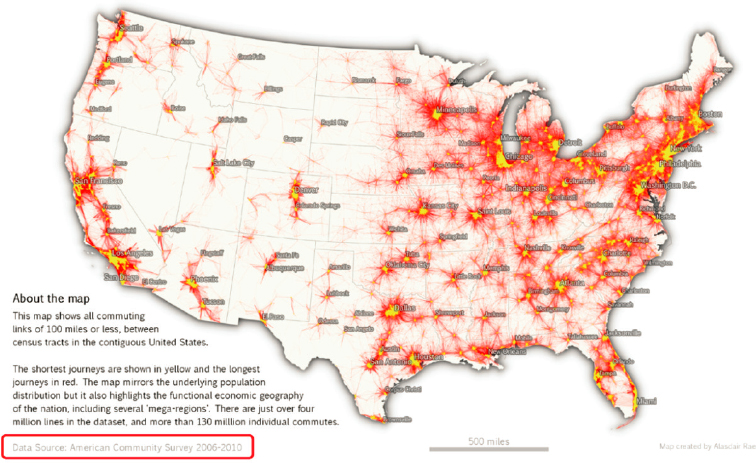
As shown in Figure 2-1, current sampling sites are not evenly distributed across states, and tend to cluster in more populated, urban areas. Many rural counties, which are often disproportionately non-sewered, are not monitored. Roughly 14 percent of the U.S. population lives in a rural area (Dobis et al., 2021), and approximately 7 percent of NWSS sites are located in rural areas (i.e., urban-rural designation 6; see Figure 2-2). Although the residences in non-sewered locations are not directly sampled in wastewater surveillance systems, useful information can still be gained from neighboring communities if a subset of the population commutes to a sewered area for work, school, or other regular activities (e.g., errands, religious/social activities) (Figure 2-3; Yu et al., 2024). In terms of socioeconomic spatial patterns, NWSS sites appear to be relatively evenly spread across a range of levels of social vulnerability (see Figure 2-4).
Many jurisdictions are currently examining their spatial distribution of sampling to maximize the information for public health decision making with available resources, but very few optimization efforts have been completed. Research is under way in California using statistical tools to optimize the wastewater sampling network considering factors such as population served, population density, geographic coverage, Social Vulnerability

SOURCES: (a) https://covid.cdc.gov/covid-data-tracker/#wastewater-surveillance; (b) https://maps.geo.census.gov/ddmv/map.html.
Index, and the dissimilarity of wastewater surveillance signals (Daza-Torres et al., 2024). These tools can be used to evaluate the representativeness of their wastewater surveillance sampling network and whether vulnerable populations are adequately monitored. They can also be used to develop spatial sampling that provides a more comprehensive understanding of disease dynamics while minimizing redundancy. Redundancy can be assessed by evaluating differences among sites in historic data trends, signal magnitude, and timing, although redundancy is a pathogen-specific attribute. Under more drastic budget cuts, these statistical tools can be used to assess the relative value of information from existing sites, considering state or local priorities.

SOURCE: Committee, based on NWSS data found at data.cdc.gov.
It is important to note that different pathogens may exhibit different spatial and temporal transmission patterns; two sites that show similar wastewater surveillance results for SARS-CoV-2 in terms of the timing of peaks and trends may differ for another pathogen. Transmission route, transmissibility, and prevalence may all influence the spatiotemporal patterning (and degree to which two sites are redundant) in different ways across different pathogens. Therefore, optimization efforts will need to be revisited if new pathogen targets are added and potentially as pathogen variants evolve. The holistic national spatial representation will also need to be examined to ensure equity across the systems and that larger regional and national comparisons are possible.
Many state jurisdictions currently lack the capabilities to conduct these sampling optimization analyses. Given the potential for these analyses to improve the use of resources by reducing redundant sites and identifying critical gaps in coverage, the Centers of Disease Control and Prevention (CDC) should provide technical support for sampling optimization, including guidance for optimization rules of thumb and experts who can conduct the analyses in partnership with states. This is also an active area of research, and participation from the broader scientific and public health research community in developing optimization methods and optimal sampling strategies would benefit the NWSS.
SOURCE: https://lehd.ces.census.gov/doc/workshop/2017/Presentations/TheaEvans.pdf.

NOTE: For more information on the Centers for Disease Control and Prevention (CDC)/Agency for Toxic Substances and Disease Registry (ATSDR) SVI metric, see https://www.atsdr.cdc.gov/placeandhealth/svi/index.html.
SOURCE: Committee, based on NWSS data found at data.cdc.gov and CDC county-level national SVI designations.
The extent to which NWSS sites are representative of rural populations cannot be determined solely by geographic data (e.g., urban-rural indices), due to issues of mobility and contact between populations. Continued research would help states and CDC evaluate which rural and non-sewered areas more closely mirror sewered populations than others due to differences in population mixing. Further research on this issue using the Longitudinal Employer-Household Dynamics Origin-Destination Employment Statistics (LODES) data (see Figure 2-3), cell phone mobility data, and contact survey data (Dorélien et al., 2020; Mousa et al., 2021) would be highly beneficial in efforts to optimize the spatial distribution of sites and understand the extent to which non-sewered populations may be
represented in existing sampling (e.g., via commuting for work or school). Additional research could evaluate whether or to what extent modeling and statistical tools can help adjust results from existing sites to better understand infectious disease trends in communities that are missing from the NWSS.
Consideration of Sampling Scale for Public Health Action
Although most NWSS sites provide community-level data by means of wastewater treatment plant sampling, there are advantages in facility or sub-sewershed sampling to address specific needs. It is important to understand that the reliability of the wastewater trend relative to an outbreak trend is impacted by the scale of the sewershed. Models of COVID outbreaks combined with individual fecal shedding dynamics highlight the impact of scale on wastewater signals (see Figure 2-5). In the simulated example provided in Figure 2-5, as a community’s population decreases, the wastewater signals become more stochastic and are less likely to follow the COVID-19 prevalence in the community. This simulated scenario assumes complete mixing within the sewershed and no-sampling-induced variability (i.e., an ideal composite sample); neither of these is achievable in real systems. Thus, a real-world scenario would show even greater variability in smaller sewersheds. Trends observed from sewersheds, sub-sewersheds, and facilities containing small populations (e.g., <1000 individuals for SARSCoV-2) may not accurately reflect illness trends in a community.
Sub-sewershed sampling. In cities with a single wastewater treatment plant representing a large population (e.g., over 1 million people), it can be more difficult to understand disease trends because increases in one part of the city could be offset by decreases in another, or an outbreak in a small neighborhood may be diluted by the rest of the sewershed. In such circumstances, higher-resolution sub-sewershed sampling (e.g., at manholes or lift stations within the sewershed) can be helpful for the purpose of verifying locations of concern. Sample collection within the sewershed reduces the represented population size to those more in line with small to mid-sized wastewater treatment plants. Additionally, sub-sewershed sampling may allow focused disease surveillance for specific localized at-risk groups, although the definition of who is at risk is likely to differ for different pathogens.
Sub-sewershed sampling is more complex than wastewater treatment plant sampling. A good understanding of the flow dynamics of the conveyance system is needed to choose sites and to understand the population represented by the sample. Flow rates are more variable in smaller areas of the system and therefore more challenging to measure but are necessary to understand loads and trends. Nonquantitative presence/absence measurements are typically easier to determine, but harder to interpret for trends.

SOURCE: Committee.
Further, sampling equipment may be vulnerable to vandalism if no secure location is available, and manhole access brings additional worker safety and traffic disruption issues, especially if located in high-traffic areas.
Facility-level sampling. Although monitoring individual facilities (e.g., nursing homes, prisons, hospitals, schools, universities, military bases) may not appear to be a high priority in a national wastewater surveillance system, facility-level surveillance has value to inform immediate interventions (e.g., resident screening, social distancing, hygiene protocols, educational outreach). This type of program can also provide a fine-scale picture of locations with the presence of target organisms, which provides an additional dimension to the understanding of disease spread at the community scale.
Facility-level sampling is particularly useful for understanding reservoirs of specific pathogens in the community or in subpopulations that have early incidence or higher disease risks than the general population, providing opportunities to mitigate outbreaks within these unique populations. For example, wastewater monitoring in hospitals, skilled nursing facilities, and assisted living facilities can help to understand the spread of rare antibiotic resistance targets and specific pathogens such as Candida auris due to the higher use of antibiotics and a more vulnerable patient and resident population in these facilities. Facility-level antimicrobial resistance surveillance would also be more actionable than wastewater treatment plant data because it is suspected to be less likely to be confounded by nonhuman or environmental reservoirs of resistance genes (Liu et al., 2023; McLellan and Roguet, 2019) but this has yet to be tested. A significant increase in wastewater detection of antibiotic-resistant genes at a facility could trigger investigation of whether there is an increased transmission and follow-up testing using appropriate clinical and clinical laboratory methods (see also Chapter 5).
Facility sampling can provide more actionable data, but states need to weigh these investments in sampling based on potential actions. By prioritizing monitoring and early detection at facilities with vulnerable populations (e.g., nursing homes, correctional facilities), wastewater surveillance can support highly impactful public health actions (see Box 2-1). However, jurisdictions should also weigh the complexity of interpretation and quality of the data at the facility level—the stochasticity and complications of measuring at small scales (due to variability in shedding, flow rates, etc., as shown in Figure 2-5) will be all the more challenging at the facility level. Particular issues arise in trying to obtain representative sampling at the facility level, because there is little mixing within such a small system and fecal shedding events pass through facilities so quickly. Sampling strategies for facilities are discussed later in this chapter. Also, some facilities may be more conducive than others for infectious disease surveillance. For example,
BOX 2-1
Wastewater Surveillance in Correctional Facilities
During the pandemic, wastewater surveillance was implemented in a number of correctional facilities to provide an early warning of a COVID-19 outbreak within the prison population to inform specific public health strategies to provide care and limit spread. Although collection and use of health data about incarcerated persons can raise special ethical concerns because of their vulnerability, wastewater surveillance also holds considerable promise for addressing health threats to this population. Correctional facilities represent high-risk groups for infectious disease transmission because of the densely housed population and typically poor ventilation. Outbreaks in prisons can easily spread to and from the community through prison staff and other prisons through prisoner transfers (Hassard et al., 2022).
Although wastewater can be challenging to sample at these sites because of limited access to prison wastewater infrastructure, researchers have identified statistically significant correlations between wastewater viral concentrations and clinical testing (Jobling et al., 2024; Klevens et al., 2023). A study of wastewater surveillance at a single large correctional facility in Georgia with 2,700 residents used passive sampling (Moore swabs) and reported that the polymerase chain reaction (PCR) signal was strongly correlated with clinical test results (Spaulding et al., 2023). The Ohio Department of Rehabilitation and Corrections conducted wastewater monitoring at 33 correctional facilities, with twice-weekly composite sampling (at least initially). Statistical tools were used to assess the trends through three or four sample moving averages and with machine learning tools. The wastewater surveillance data were useful to guide mitigation strategies, such as voluntary offender testing, staff testing, medical observation, controlling transport to a specific correctional facility during an outbreak, providing additional air-flow barriers, or determining whether to close gathering places, such as the commissary or barbershop (M. Weir, OSU, personal communication, 2023). As shown in Figure 2-5, it may be difficult for wastewater surveillance at small facilities to determine trends, and Hassard et al. (2022) noted that the minimum size of the population that can be usefully monitored for trends is unknown.
many K-12 students may not have bowel movements at school, which may reduce the representativeness of those data for fecally shed pathogens.
Selection of sampling scale. For typical endemic pathogens, wastewater treatment plant sampling will provide sufficient community-level data, but localities can evaluate the costs and benefits of additional sub-sewershed sampling. Facility- and subsewershed-level wastewater surveillance can provide valuable data to support early public health actions for vulnerable populations. Thus, use of NWSS funding for sub-sewershed and facility sampling may be appropriate if these data are sufficiently interpretable and
can inform high-priority local, state, or national public health action related to the spread of infectious disease.
TEMPORAL DISTRIBUTION
Sampling frequency is an important consideration in all wastewater-based epidemiology applications. If sampling frequencies are too low, infections are missed, and trends are not observable. High-frequency sampling, however, is costly and may generate more information than is necessary for efficient public health action and may place a higher burden on wastewater treatment plants to provide these samples. There are several components of frequency that need to be considered when designing a surveillance program, including the frequencies with which samples are collected, shipped, and analyzed, as well as the frequency with which results are posted. For simplicity, the committee focused on how frequently samples are collected—assuming that shipment, analysis, and reporting would follow immediately—but implications of these other aspects of frequency are also discussed, and timeliness of reporting is addressed in Chapter 4. Because this chapter covers endemic pathogen monitoring, this discussion is focused on the frequency necessary to accurately detect trends as opposed to accurately detecting the presence or absence of a target. This is also applicable to monitoring infectious disease trends during local outbreaks. Temporal sampling considerations for presence/absence applications, such as monitoring for emerging pandemic threats at a large international event, are discussed in Chapter 6.
Most studies that have examined the frequency of samples necessary for correctly identifying trends have largely focused on SARS-CoV-2. Early studies correlated wastewater and case data retrospectively to identify the number of samples necessary to correctly observe trends (as defined by clinical cases). Studies demonstrated correlations in retrospective analysis with samples collected at a frequency as low as once per week (Duvallet et al., 2022). Feng et al. (2021) used Monte Carlo simulations to evaluate the impacts of sampling frequencies to identify a trend over a 3-week period and determined at least two samples per week were necessary to determine trends. Likewise, Graham et al. (2020) determined that sampling primary sludge twice per week was necessary for obtaining significant associations between case counts and wastewater concentrations. Based on these and other early findings, many surveillance programs selected twice-weekly sampling. For example, Ohio conducted SARS-CoV-2 monitoring two times per week (Feng et al., 2021).
More recent studies with larger data sets have highlighted the value of more frequent sampling for timely trend detection of SARS-CoV-2. Holst et al. (2022) compared SARS-CoV-2 data collected one or two times per
week with data collected three to five times per week and determined that higher-frequency sampling provided more timely identification of outbreak onset and the higher resolution of trends. Schoen et al. (2022) determined that a sampling frequency of four times per week or greater was necessary to reduce the error associated with predicting incidence rates. Chan et al. (2023) tested for trends of SARS-CoV-2 wastewater measurements and found that sampling four or five times per week was necessary to effectively detect trends with a sensitivity and specificity cutoff of 0.5. These more recent studies demonstrate the potential value of higher-resolution sampling for the timely detection of trends with endemic pathogen surveillance.
One issue with many analyses focused on identifying the sampling frequency necessary to obtain trends is that trends are typically identified with a rolling average of multiple samples. These rolling average windows can quickly become too wide for timely decisions. For example, when samples are collected twice per week, a three-sample average captures samples from the previous 2 weeks of wastewater data to determine a trend (assuming a 4-day turnaround time). Increasing the number of samples in the rolling average analysis (e.g., using a five-sample rolling average) and continuing to sample twice per week may decrease noise in the detected trend; however, in this case the sampling window covers 3 weeks, which may be too wide of a window to capture timely shifts in trends when evaluating them in real time for public health decision making. A rolling window of 5–7 samples collected during the previous 1–2 weeks would substantially reduce the noise in the trend prediction and allow rapid response to changing trends in the community. Unfortunately, this will be too cost prohibitive for many programs and could exceed the staff capacity of some wastewater treatment plants. The trade-offs of sample frequency and rolling averages will need to be considered for each program. Based on the current state of the knowledge, the committee recommends that, during times when timely pathogen target trends from wastewater are critical (e.g., when a new variant is circulating or there is concern over a potential outbreak), sampling frequency of more than twice per week will be most valuable. Outside of these periods, when trends over many weeks are desired, sampling at once or twice per week may be acceptable. One possible approach to reduce the burden and cost while collecting higher-frequency samples is to batch the shipment and analyses of the samples. For example, samples could be collected at the plant on a daily or every-other-day basis but sent and analyzed only once or twice a week. This results in a high-frequency data set but saves time and costs for packaging, shipping, and possibly analysis, so long as the samples can be rapidly processed and reported once they do arrive.
Frequency recommendations will be dependent on the pathogen and overall goal of the sampling effort. To date, wastewater surveillance of endemic pathogens has generally focused on assessing pathogen trends. For
reference, CDC currently recommends that at least one sample per week be collected for SARS-CoV-2 and that three measurements are necessary for a trend. The impact of sampling frequencies for determining trends of other pathogens has been much less studied. They could be different from SARS-CoV-2 due to differences in shedding levels and dynamics through the course of an outbreak. It may be most efficient to sample all targets on the same cadence due to economies of scale in laboratory and personnel costs, and SARS-CoV-2 will likely drive the frequency initially. For respiratory viruses, the committee estimates that twice-weekly sampling will be sufficient to determine trends, although data on sampling frequencies to support trend analysis of influenza and respiratory syncytial virus (RSV) are lacking. Many of the endemic pathogens of interest for wastewater surveillance have consistent seasonal trends. Influenza A and RSV cases, for example, tend to peak in the United States in winter and have few, if any, cases in summer months. Sampling and analysis for these targets could therefore decrease or pause during times when there is historically little illness activity and resume in time to detect early seasonal activity.
As mentioned above, in this section the committee has assumed that there is no delay between sample collection and sample reporting. The longer it takes for sample results to be reported, the longer the rolling average window and thus the older the detected trend. Currently, there are a range of workflow approaches, with substantial lag times between sample collection and data availability for some sites. Improvement is needed in all steps of the process to streamline the workflow and optimize data availability and relevance (see also Chapter 4).
In summary, the selection of a temporal sampling program will depend on the pathogen and the use case, which determines how rapidly trends need to be detected. Sampling at least two times per week for SARS-CoV-2, influenza, and RSV will generally lead to positive correlations between wastewater levels and cases and sufficiently timely determination of trends. Programs wishing to increase sampling frequency could consider batching the shipment and analysis of samples (e.g., 4 days of samples shipped and analyzed twice per week).
SAMPLING METHODS
There are multiple methods for collecting wastewater samples that are analyzed for endemic pathogens. Some of the considerations include the physical location of sample collection, whether the sampling is conducted manually or by an automated device, and what kind of wastewater sample is collected (e.g., solids or liquids). Trade-offs in the selection of sampling method include the correlation of the results with epidemiological data, the sensitivity and variability of the resulting data (i.e., if one approach is more
amenable to lower detection limits or consistent data), the comparability of data across sampling sites, the representativeness of the samples for the population being monitored (and the ability to assess the representativeness of the samples), and the effort and cost of collecting, transporting, and processing the samples for analysis. At the time of this report, large wastewater surveillance programs in the United States use a variety of the methods. Biobot Analytics has focused primarily on 24-hour flow- or time-proportional composite influent samples collected from wastewater treatment plants or pump stations. The Michigan Wastewater Surveillance Network focuses on liquid wastewater samples collected, and the collection process varies across the network, with some groups focusing on grab samples and other groups focusing on flow- and time-proportional composite samples. Wastewater surveillance conducted by WastewaterSCAN,1 with over 180 sampling sites across the United States, focuses on enriched solids samples, collected either in primary sedimentation basins at wastewater treatment plants or via manual sedimentation of influent.
In practice, most ongoing wastewater surveillance programs use the sampling method they selected early in the COVID-19 pandemic. This is due to many reasons, including the desire to have consistent data, the capital costs and training that went into their sampling program, and the preference for and trust in familiar methods. However, the transition of wastewater surveillance from a pandemic emergency response to a long-term national network designed to assist the prevention and control of infectious diseases necessitates that these trade-offs be reconsidered across a larger set of targets and broader intended uses of the data. In the following sections, the committee reviews the major approaches to wastewater sampling and the trade-offs that come with specific approaches.
Wastewater Treatment Plant Sampling Methods
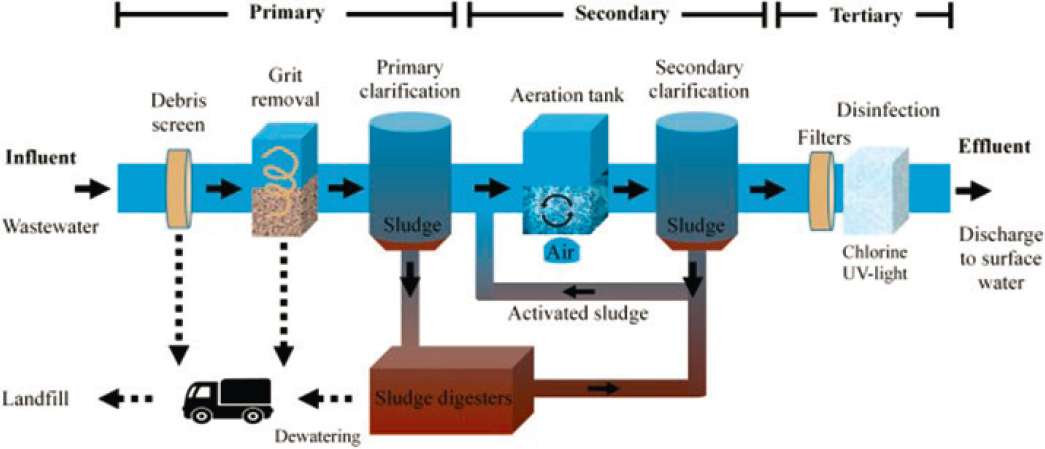
Several different sampling methods can be used to collect samples at wastewater treatment plants (termed community-level wastewater surveillance). The most common methods include composite wastewater influent sampling, grab influent sampling, and the collection of primary sludge from treatment plant clarifiers (Figure 2-6). Representativeness is the most important consideration for sample collection at wastewater treatment plants because samples that are not representative can lead to sampling-derived variability in the resulting data. This in turn has a negative impact on the interpretation of the observed infectious disease trends and thus reduces the value of the data. Nonrepresentative results can lead to misinterpretation, inappropriate public health actions (either too much or too little action) in
___________________
SOURCE: Martin-Pozo et al., 2022.
response to the surveillance data, wasted resources, as well as eroded confidence in the data. The following provides a brief overview of these main sampling strategies and then discusses considerations and trade-offs with the different approaches.
Influent sampling from wastewater treatment plants entails collection of wastewater from the head of the wastewater treatment plant (i.e., where the influent enters), although there is some variability in sampling locations (e.g., true raw influent, after the screens or grit removal). Composite sampling occurs at regular intervals over a period of time (typically 24 hours), combining the individual samples into a composite sample (see Figure 2-7). In doing so, composite sampling captures a larger fraction of the material shed over the period of a day than would be captured with a single sample collected at a single point in time. The collection of composite samples can be conducted manually by collecting samples by hand from the influent flow at regular intervals and combining them into a composite sample or with equipment that automatically collects samples (i.e., autosamplers) from the wastewater treatment plant influent at regular intervals and combines the samples into a composite sample.

SOURCE: USGS, 2008. https://www.usgs.gov/media/images/automated-sampler
Composite Influent Sampling
There are different types of autosampling approaches, such as flow-weighted sampling, time-weighted sampling, and continuous composite sampling. Time-weighted composite sampling involves the collection of a certain volume of water for a specified duration over specified intervals. For example, a composite sampler may collect 100 mL of wastewater over a 5-minute period every hour. In this scenario, a total of 2.4 L would be collected over a 24-hour period. It is worth noting that in this case, the composite sample is only collected for about 8.3 percent of the 24-hour period. For the remaining 91.7 percent of the time, the wastewater is not being sampled. In flow-weighted sampling, the collected sample volume is proportional to the flow rate of the wastewater. For example, the sampler may collect 100 mL for every 100,000 L that flows into the wastewater treatment plant. In general, flow-weighted sampling is considered to be more representative than time-weighted sampling because it better captures the pathogen loads over time despite flow variability. This is because more sample is collected when more material is entering the wastewater treatment plant. Flow-weighted sampling requires accurate flow metering, which can sometimes be challenging to maintain.
Influent Grab Sampling
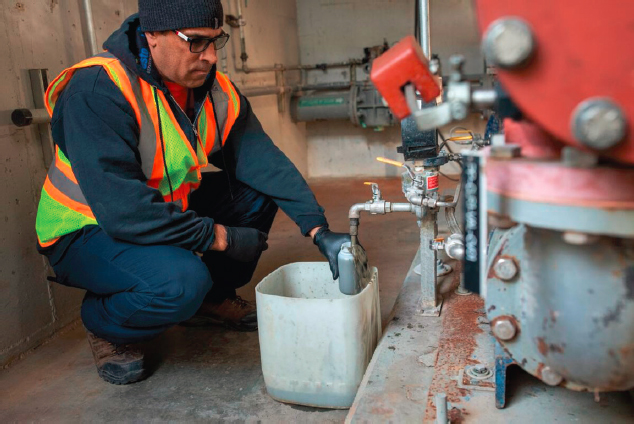
Grab sampling involves the manual collection of a water sample at one point in time. For the purpose of this discussion, grab sampling is defined here as the collection of a single grab sample, as opposed to the collection of multiple grab samples. (The latter would be referred to as composite sampling.) Grab samples are commonly collected by lowering a clean sample bottle into the wastewater flow (Figure 2-8). These samples are also generally collected at the head of the wastewater treatment plant, depending on accessible locations to the influent. Whereas the composite sample represents several snapshots in time, the grab sample is only representative of a single point in time.
Primary Sludge Sampling
In addition to samples collected from the head of wastewater treatment plants, enriched solids samples are sometimes collected from primary clarifiers at wastewater treatment plants (Figures 2-6 and 2-9). The purpose of this is to leverage the pathogen concentration process that inherently takes place at most wastewater treatment plants. Suspended solids in municipal wastewater are commonly settled from the bulk wastewater during primary

SOURCE: https://elpasomatters.org/2022/04/18/how-el-paso-is-using-wastewater-surveillance-to-detect-covid-19-spread/.
wastewater treatment. In this process, the wastewater spends time (typically ~2 hours) in a large basin and solids settle by gravity. Whereas the clarified wastewater passes to the next step of the wastewater purification process, the wastewater solids are collected from the underflow of sedimentation basins and these solids (termed primary sludge) are removed (via pipe flow) for further treatment and disposal. Suspended solids concentrations collected in primary sludge samples are typically in the range of 2 to 7 percent. This is in contrast to a concentration of <0.1 percent by mass in wastewater influent. Primary sludge samples are commonly captured from streams that are regularly pulled from the primary clarifiers. Some smaller plants do not have primary clarifiers; in these cases, influent samples are sometimes collected and settled manually to capture settled solids similar to what would be collected from primary clarifiers. The collected and transported solids can be further concentrated in the laboratory, often through centrifugation. Pathogens are then extracted from the enriched solids samples and quantified using methods similar to those used with influent sample concentrates.
SOURCE: Anna Maria Barry-Jester/KFF Health News.
Considerations Affecting Grab Versus Composite Sampling
Single grab samples represent a snapshot at a fixed point in time, and the interpretation is limited by the potentially small fraction of the sewershed population captured in the sample. Composite samples, on the other hand, represent the average of a number of snapshots collected over a period of time and therefore usually result in measurements that are more representative of the sewershed population. Due to their better representativeness, composite influent samples are preferred for measuring trends in endemic pathogens. That being said, a composite sampling apparatus can cost in the range of $2,000 to $7,000 (Liu et al., 2022) or more, depending on the options, and requires more maintenance than single grab samples. Likewise, collecting multiple grab samples manually and combining them requires more labor and supplies than collecting a single grab sample. Consequently, the collection of composite samples is not always a feasible option due to staff or resource issues.
Results obtained with single grab samples can in some cases be reflective of composite samples. For example, similar results have been observed for paired grab and composite samples when the monitoring was focused on target presence versus absence (George et al., 2022; Kmush et al., 2022). For endemic pathogen surveillance, wastewater samples are more often analyzed for pathogen concentration trends rather than absence or
presence. For this purpose, grab samples are more likely to result in concentrations similar to composite samples when collected from larger sewersheds (George et al., 2022; Kmush et al., 2022). For example, George et al. (2022) reported that SARS-CoV-2 RNA concentrations determined in grab samples were within 50 percent of concentrations of composite samples in a sewershed with approximately 50,000 inhabitants. By contrast, concentrations obtained with grab samples were up to two orders of magnitude different than composite samples in a sewershed representing 400 people. Curtis et al. (2020) also observed good correlations between grab and composite wastewater samples collected at the influent of a treatment plant representing a population of 78,000. In this case, 55 percent of the grab sample concentrations were within 50 percent of the concentrations obtained with composite samples. It is worth noting that these studies were conducted for SARS-CoV-2 at specific prevalence rates in the community—these relationships will differ with different pathogens and with different COVID-19 incidence.
The reason for these differences in how well single grab sample results reflect those obtained with composite samples is related to how human inputs vary and how flows vary between systems. The wastewater entering the treatment plant from larger systems exhibits less variability, both in flow and in constituent concentrations (e.g., total suspended solids concentration; see Table 2-1; Metcalf & Eddy et al., 2013). This is in part due to the larger number of contributors in larger wastewater samples—more inputs over time reduce the temporal variability observed within the sewer system.
TABLE 2-1 Ranges of Geometric Standard Deviations for Flow Rates and Common Wastewater Constituents in Typical Small (1–10 Mgal/day), Medium (10–100 Mgal/day), and Large (>100 Mgal/day) Wastewater Treatment Plants
| Ranges of Geometric Standard Deviations | |||
|---|---|---|---|
| Small Plants | Medium Plants | Large Plants | |
| Flowrate | 1.4–2.0 | 1.1–1.5 | 1.1–1.2 |
| Total suspended solids (TSS) | 1.4–2.1 | 1.3–1.6 | 1.1–1.3 |
| Biochemical oxygen demand (BOD) | 1.4–2.1 | 1.3–1.6 | 1.1–1.3 |
| Chemical oxygen demand (COD) | 1.5–2.2 | 1.4–1.8 | 1.1–1.5 |
NOTE: These data exclude systems with large amounts of infiltration into the collection system. Geometric standard deviation (GSD) is a measure of spread or variability in a quantity. For log-normally distributed quantities, it is expected that approximately 95% of the observations will be in a range between the geometric mean divided by the square of the GSD and the geometric mean multiplied by the square of the GSD.
SOURCE: Adapted from Metcalf & Eddy et al., 2013.
This is also in part due to the mixing characteristics in different conveyance systems. The extent to which the wastewater entering the treatment plant has mixed depends on factors such as the flow rate as well as how long different samples spend in the sewer, the physical aspects of the system (e.g. slope), and pumping that takes place in the system.
In summary, composite samples are, by nature, more representative than grab samples, and thus they are more reliable for assessing the overall occurrence of target organisms in a sewershed and provide more consistent and reliable data. Single grab samples cost the same to analyze as composite samples but the value of the data to understand trends is much lower, given the data variability. Therefore, composite sampling will typically be worth the additional investment costs. Single grab samples can be useful for assessing the presence or absence of a target, but negative results need to be weighed against the probability of detecting a signal. In large sewersheds, concentration trends obtained with single grab samples collected consistently at peak flow may be reflective of what would be captured with a composite sample, but ideally this should be validated against composite sampling during a period of time in which the pathogen target is present or changing (i.e., over 1–2 months), so that the degree of representativeness of grab samples is established. Grab samples collected in small sewersheds will likely have large variations associated with their measurements and this will decrease the reliability of their trend detection.
Considerations of Samples Enriched with Solids
As mentioned above, most wastewater surveillance studies and programs have focused on quantifying pathogens in wastewater treatment plant influent samples. Some programs keep the solid fraction in the wastewater sample prior to concentrating and extracting the target pathogens while others remove the solids prior to concentrating and extracting. However, several surveillance programs have focused on the collection and analysis on the solid fraction. Wastewater samples that are concentrated with solids are typically collected by sampling either the primary sludge (see Figures 2-6 and 2-9) or the wastewater influent and concentrating the solid fraction via settling, filtration, or centrifugation (Kim et al., 2022). Sample processing and analysis then focuses only on the concentrated solids fraction. Prior to discussing the benefits and drawbacks of focusing on samples enriched with solids, it is important to first understand the reasons pathogens are enriched in samples that contain more wastewater solids.
Municipal wastewaters contain suspended solids (i.e., particles > 0.2 µm), including solids of fecal origin. The wastewater that reaches the wastewater treatment plant is primarily liquid, with a total suspended solids content of <0.1 percent. As wastewater is conveyed to the wastewater treatment
plant, the fecal samples are broken into smaller pieces, and pathogens that enter the wastewater from humans in feces, urine, saliva, and skin will partition between the solid and liquid phases until equilibrium is reached. Virus, bacteria, and protozoa particles exhibit a range of sorption or partition tendencies at equilibrium. These tendencies are frequently characterized by partition coefficients (Kd), which represent the ratio of the pathogen particle concentration in the solids to the concentration in the liquid. Reported Kd values for viral genomes in untreated wastewater are in the range of approximately 100 to 10,000 mL/g (Boehm et al., 2024). Note that the Kd values reported in the literature sometimes represent the partitioning of the infectious pathogen particles and other times represent the partitioning of the measured pathogens genes, which for viruses could include intact particles, damaged particles, and free nucleic acids. The reported Kd values for viruses suggest that at equilibrium, 1 g of dried wastewater solids contains the same number of viruses as between 100 mL and 10 L of wastewater liquids, depending on the virus being tested.
If at equilibrium, the fraction of pathogens in each phase of a specific wastewater sample depends on both the Kd of the pathogen and the percentage of solids in that wastewater sample (Table 2-2). Equilibrium between the liquid and solid fractions of wastewater may not be fully achieved in a sample, but partition coefficients provide an approach to predicting the relative pathogen concentrations in the wastewater liquids and solids. Assuming a pathogen has a Kd equal to 1,000 mL/g, a composite wastewater sample contains 0.1 percent solids (by dry weight), and the system is at equilibrium, 9 percent of the pathogens in a wastewater sample would be associated with the solid fraction of wastewater and 91 percent of
TABLE 2-2 Examples of Pathogen Partitioning at Equilibrium Between Wastewater Solids and Liquid at Equilibrium Based on Different Partition Coefficients and Total Suspended Solids Concentrations
| Pathogen Partition Coefficient, Kd (mL/g) | Wastewater Total Suspended Solids Concentration (TSS, mg/L) | Percentage of Pathogens Partitioned to Solids in Wastewater |
|---|---|---|
| 100 | 100 | 1% |
| 1000 | 100 | 9% |
| 1000 | 200 | 17% |
| 1000 | 300 | 23% |
| 10,000 | 100 | 97% |
NOTE: These percentages were calculated as follows: .
SOURCE: Committee.
the pathogens would be associated with the liquid fraction. Research groups that focus on samples enriched with solids are harnessing this affinity of the viruses to wastewater solids. Indeed, a major advantage of collecting primary sludge is that it requires only a small sample volume (approximately 50 mL) to be collected and transported.
Pathogen concentrations measured in wastewater samples are commonly compared to clinical data to establish if the sampling method works. Nucleic acid concentrations obtained with both influent samples and primary sludge samples have correlated strongly with clinical cases for a number of pathogens. For example, Boehm et al. (2023a) found positive correlations for SARS-CoV-2, influenza A, influenza B, RSV A, RSV B, human metapneumovirus, rhinovirus, and seasonal coronaviruses when comparing the concentrations of RNA in primary sludge with positivity rates from clinical samples submitted to sentinel laboratories. Similar findings were reported for human norovirus (Boehm et al., 2023c) and enterovirus D68 (Boehm et al., 2023d) in primary sludge samples. Likewise, strong correlations between clinical cases and wastewater levels have been demonstrated with influent samples for a number of pathogens, including SARS-CoV-2 (Medema et al., 2020), human norovirus (Ammerman et al., 2024), and influenza A virus (Zheng et al., 2023). Overall, there is strong evidence that samples focused primarily on the liquid fraction (i.e., influent samples) and solids fractions (i.e., primary sludge samples) of wastewater can provide pathogen signals that are helpful for tracking disease trends in communities.
With respect to sensitivity and the ability to detect pathogens when community prevalence is low, limited studies have compared paired influent and primary sludge samples collected on the same day at times when prevalence is low. Some studies with paired influent and primary sludge samples have found that targeting the primary sludge, or more generally enriched solids samples, results in more positive detections (Graham et al., 2020; Wolfe et al., 2022), whereas others have reported similar sensitivities for paired liquid and enriched solids samples (Hewitt et al., 2022; Kim et al., 2022). These conflicting findings are likely due to the wide range of methods used in the studies and the different effective volumes and masses captured in the analyses. Furthermore, pathogens exhibit a range of partition coefficients, and so the relative sensitivity of influent versus primary sludge will differ from target to target. Finally, wastewater samples can contain high levels of inhibitors, and there may be differences in inhibition between sample types and methods (see Chapter 3). At this time, there is not sufficient evidence to determine if primary sludge or influent samples are overwhelmingly more sensitive.
Methods focused on influent or primary sludge should be similarly representative if the samples are both composite. The age of primary sludge
samples collected from primary clarifiers is often reported by wastewater treatment plants. However, characterizing the specific age of solid samples collected under the primary clarifier is complicated, dynamic, and not something that is frequently measured by wastewater treatment plants. The age of the solids (or residence time) in the clarifier blanket can be estimated using the total suspended solids (TSS) concentrations in the clarifier influent and effluent along with the TSS mass in the clarifier sludge blanket, but primary clarifier sludge age is not often calculated by wastewater treatment plants. Furthermore, the mixing state of primary solids is highly dependent on the physical design of the sedimentation tank and on overall plant hydraulics. Without additional analysis of plant configurations and settling times, the representativeness of solid samples collected from sedimentation basins is less certain than solids from well-defined influent liquid composite sampling. Collecting an influent composite sample and manually settling the solids to concentrate pathogens can help define the composition of an enriched solids sample. In this case, the composition of the sample is easily defined (e.g., the sample represents solids enriched from a 24-hour flow-weighted composite sample).
Recommended Sampling Methods at Wastewater Treatment Plants
For wastewater surveillance where the collection point is at the wastewater treatment plant and the sample is influent, composite sampling is preferable because it is more likely to provide a representative sample of the sewershed. For small wastewater treatment plants (e.g., defined by the U.S. Environmental Protection Agency as serving <10,000), it is particularly important to use composite sampling to obtain a representative sample of the community, because the wastewater samples are likely to be more highly variable due to the variable shedding dynamics of infected individuals (see Table 2-1). Small communities may have fewer resources to support in-house expertise or equipment to perform composite sampling and may benefit from use of a contractor to deploy and maintain the autosampler if NWSS or state funding support is available. If a composite sampler is not feasible, multiple grab samples could be taken several hours apart and then combined to mimic a composite sample, although such an approach would require more time from wastewater treatment plant staff.
Primary sludge sampling has proven a sensitive and effective approach and has the advantage of small sample size. However, more work should be devoted to characterizing the retention time of the primary sludge at different sizes and configurations of wastewater treatment plants to determine what timescale of composite the sludge sample represents. More analysis of existing wastewater data is necessary to determine if analytical methods are more sensitive for detecting trends of endemic pathogens in common
primary sludge samples compared to typical composite samples of wastewater influent. Furthermore, more research is needed to determine if pathogen data from primary sludge samples or influent samples are more directly comparable between different sewersheds. Ultimately, use of the same representative sampling methods across all sites would improve comparability across sites. However, more analysis is needed to examine the advantages and disadvantages of primary sludge versus influent samples before determining an optimal method for consistency, or at minimum different but comparable methods.
Sub-sewershed and Facility Sampling Methods
Several factors affect the sampling strategy appropriate for sub-sewersheds (frequently conducted via manholes), including the capacity for composite sampler placement, the sub-sewershed size, expected wastewater mixing, and the intended use of the data for targeted interventions (e.g., if quantitative data are necessary or if presence/absence data are sufficient). An effective grab sampling program will require more samples than composite sampling, and this may offset the cost of the composite sampling equipment. The likelihood of erroneous results increases with grab samples as the incidence of the target organisms decreases (George et al., 2022); in this case, negative results could produce a false sense of security. If monitoring is occurring for a targeted intervention that is effort or resource intensive, composite sampling may be worth the investment to get more reliable, quantitative results. The Houston Wastewater Epidemiology project, which is a CDC National Wastewater Surveillance System Center of Excellence, collects 24-hour time-proportional samples from its lift stations and institutions.
For facility monitoring, such as at hospitals, nursing homes, jails, and schools, grab samples are unlikely to provide representative information, because the wastewater samples are likely to be highly variable due to the shedding dynamics of the small number of individuals contributing to the samples and lack of mixing, which usually occurs in the many kilometers of pipes leading to a treatment plant. Thus, grab sampling at facilities will result in data with a higher likelihood of false negatives, and negative results need to be weighed against the probability of detecting a signal with a particular sampling method. For example, even composite samplers collect only a small subset of the wastewater discharged and could miss a single case within a facility. Passive sampling, described below, holds promise as a way to integrate and concentrate facility samples over time, for sites where presence/absence data are sufficient. Special considerations regarding facility data sharing to address the heightened risk of stigmatization and
reidentification that attaches to smaller-scale sampling are discussed in Chapter 4.
Alternative Approaches in Development: Passive Sampling
Facility-level composite sampling may not be feasible or cost-effective to deploy and maintain. In facilities, passive sampling represents a significant improvement upon grab samples and may permit measurements at many more sites than composite sampling could accommodate (Bivins et al., 2022). Passive samplers are designed to capture the target organism from wastewater as the wastewater stream passes over or through the sampler, concentrating the target in situ over the time period of deployment. Passive samplers have been used to monitor for microorganisms, such Salmonella Typhi B (Sikorski and Levine, 2020), as well chemical contaminants that are at low levels in the environment (Godlewska, 2021), but most of the recent work with passive samplers has been to detect SARS-CoV-2 virus. Recent studies have focused on evaluating different material for capture of the virus, including cotton buds, cotton gauze (e.g., Moore swabs), cellulose sponges, electronegative membranes, and granular activated carbon (Bivins et al., 2022; Hayes et al., 2022) as well as novel housings to hold different materials (Hayes et al., 2021; Schang et al., 2020). Benefits of passive samplers include their low cost and ease of placement without the need for secure locations or electricity for composite samplers, which may facilitate measurements at many more sites than composite sampling could accommodate (Bivins et al., 2022). However, sampling personnel need to visit a site twice per sample for placement and retrieval.
Passive samplers generally produce qualitative data (i.e., presence/absence), but semi-quantitative data are feasible with accompanying adsorption isotherm data. Passive samplers have the potential to increase the sensitivity of detection because larger volumes of wastewater can be exposed to the sampler compared to the limited sample volume (generally <100 mL) used in laboratory concentration methods. Greater sensitivity of passive samplers over traditional sampling has been reported, particularly when SARS-CoV-2 concentrations in wastewater were <1 gene copy/mL (Schang, 2021). In facilities such as hospitals and nursing homes, which may have large variability in viral concentrations in wastewater across grab samples, passive sampling represents a significant improvement (Bivins et al., 2022). The amount of target organisms detected is affected by many factors, including the waste-stream characteristics (e.g., flow, solids), the efficiency of attachment, the time the sampler is deployed, the saturation point of the material used, flow through the sampler device, and analytical recovery from the material used in the sampler (Bivins et al., 2022). Researchers have reported linear accumulation of SARS-CoV-2 over specific
time frames (10–48 hours) (Habtewold et al., 2022; Hayes et al., 2022), but the complexity of the adsorption dynamics makes it difficult to relate empirical concentrations from passive samplers to the data currently being generated from batch or composite liquid samples. Deployment across a large sewershed has been shown to reflect the spatiotemporal SARS-CoV-2 clusters across a city (Li et al., 2022).
Application of passive samplers is currently limited to qualitative or semi-quantitative needs and not appropriate for wastewater treatment plant sampling in NWSS. This type of sampler is useful when detecting the presence of a pathogen is important, such as determining spread during an epidemic or identification of a rare emerging pathogen (see Chapter 6). Additional research and development could advance passive sampling toward more quantitative applications. This will require a greater understanding of the efficacy of partitioning over time to different materials in different wastewater system conditions as well as the efficiency of recovering the nucleic acids from the sampler material. Research should also examine different types of target organisms, such as enveloped or nonenveloped viruses, Gram-negative or Gram-positive bacteria, and yeasts (e.g., Candida auris).
Sample Handling
Proper handling and storage of wastewater surveillance samples are crucial to produce accurate and reliable data. In wastewater without proper storage, coronaviruses experience rapid decay, with a 99.9 percent reduction in titer occurring within 2–4 days (Simpson et al., 2021). The Association of Public Health Laboratories (APHL, 2022) and CDC2 have developed guidance for sample handling in wastewater surveillance based on enveloped viruses, such as SARS-CoV-2. Both APHL (2022) and CDC recommend that wastewater samples be stored at 4°C until processing, unless immediate processing is possible. APHL (2022) recommends storing for no longer than 4 days, while CDC suggests that if processing of samples is delayed more than 24 hours after collection, the sample should be spiked with a matrix recovery control (see Chapter 3) before refrigerating it at 4°C or freezing it at −20°C or −70°C. However, several studies caution against storing untreated bulk wastewater samples at lower temperatures, specifically −20° and −80°C, based on observed decreases in viral load (Ahmed et al., 2020; Huge et al., 2022). NWSS does not require specific sample handling procedures.
Different pathogens are likely to have different survival times under various storage conditions, and these storage effects on recovery need to be
___________________
understood. Additionally, it is important to understand the variability introduced by different approaches in storage to determine whether increased consistency of methods should be required. Issues associated with sample archiving are discussed in Chapter 3.
Technical Developments for Sampling
Looking forward, wastewater surveillance is rapidly becoming part of the public health system, and as facilities are designed and built or renovated in the future, improved access to the wastewater system will simplify logistics and make representative sampling simpler. Logistics are often more challenging than technology gaps, and engineering adaptations to wastewater plumbing might overcome some of the barriers to collecting samples at facilities. Sampling ports on new facilities could be designed to access points in the system best suited for capturing a well-mixed sample that includes the entire facility.
New technologies can also improve how samples are collected or how data are interpreted. “Smart” manholes could also be used to capture ancillary measurements that aid in interpretation of sample data. For example, the City of Houston has approximately 2,300 smart manhole covers; most measure depth to wastewater in the manhole. A limited number of the smart manhole covers also measure flow velocity (Wolken et al., 2023). Flow is used to normalize the amount of waste passing a sample site, but in pipes that are only partially filled, this is very difficult to measure, adding to the uncertainty of how much of a daily average waste stream a sample might represent or how much was captured on a grab sample. Apart from smart manholes, other developing technologies can more accurately measure flows in smaller pipes that are only partially full. These data are valuable for interpreting sample concentrations and estimating how much of a facility’s waste stream was captured.
CONCLUSIONS AND RECOMMENDATIONS
To be most actionable and reliable, a national wastewater surveillance system should use representative sampling methods and move toward consistent sampling at all participating long-term sampling sites. Representative sampling methods are considered those that effectively capture waste input from a community over a given time period. At most sites, this would mean flow-weighted composite samples of wastewater influent. Solids sampling is also a promising strategy, although more characterization is needed on the time frame of inflows that are represented by solids sampling (compared to liquid composite samples of the inflow) and methods to ensure consistency and comparability. Small or low-resourced communities may
need additional support to provide composite samplers or staff to maintain the equipment, but such investments are worthwhile to ensure useful data from the surveillance effort. Over the next 5–8 years, CDC should work to move the program toward consistent sampling methods and procedures to reduce a source of variability and improve comparability, including training for sampling personnel.
For rapid trend resolution in support of public health action, nearly all wastewater surveillance systems should sample at least twice per week for RSV, influenza, and SARS-CoV-2, but additional data analysis will be necessary to determine appropriate sampling intervals for other targets added. Ultimately, the inherent variability in a given pathogen target and the intended use of those data will determine the temporal sampling needs. For respiratory viruses, twice-weekly sampling is sufficient to determine trends, although dense sampling networks (e.g., Houston’s 39 wastewater treatment plants) may possibly provide enough confirmation of trends such that weekly sampling is sufficient. During an outbreak, increased frequency of sampling would allow localities to react to trends more quickly. Tradeoffs may need to be assessed between setting different sampling frequencies as needed for different pathogens versus consistent sampling frequency for all targets (and which targets would dictate the overall sampling frequency). Less frequent sampling may be appropriate for use cases other than tracking trends of endemic pathogens (e.g., occasional measurements to assess levels in a community).
CDC should provide technical support for state and local optimization of sampling sites to maximize the value of NWSS data based on local, state, and national public health objectives and enhance the program’s sustainability. Some initial statistical methods are available that can be used to evaluate the redundancy of existing sites and the value of new sampling locations to ensure that the range of demographics are appropriately included. To support these efforts, CDC should convene centralized expertise as a resource for states to formulate adaptive sampling and data analytics strategies. As the suite of core wastewater surveillance targets expands and pathogens evolve, these analyses will need to be revisited.
In a holistic wastewater surveillance system, facility sampling (e.g., nursing homes, hospitals, correctional facilities) should be part of a diversified approach that also benefits especially vulnerable populations. Facility-based testing would be a more effective mode of sampling compared to community-wide wastewater surveillance to understand spatial spread and trends in antibiotic resistance and specific pathogens such as Candida auris, which have significant health impacts at hospitals, skilled nursing facilities, and assisted living facilities. As opposed to sampling at more aggregated sites, such as centralized wastewater treatment plants, facility monitoring is likely to produce clear actionable information needed to contain localized
outbreaks and inform facility-based prevention, particularly when data are correlated to clinical laboratory and health outcome data. For example, significant changes in the frequency of detection of antibiotic resistance genes above a certain threshold in facility wastewater can provide an early warning signal for potential spread or new infections and prompt facility-based epidemiological follow-up. For targets beyond antibiotic resistance, CDC, states, and localities will need to decide the benefits of other facility monitoring when balancing wastewater surveillance investments to support public health goals. Advances in passive sampling are promising and may make facility sampling increasingly cost-effective.
Research and development to improve sampling data quality and comparability is needed to increase the value of the data collected. Research needs include the following:
- Optimization of sampling methods to ensure a representative sample and reduce variability. There will always be an irreducible minimum variability in pathogens due to the stochastic nature of their occurrence and the chance of capture when sampling small volumes relative to the system as a whole. Research and development of methods targeted to reduce additional variability to the intrinsic minimum would enable better characterization of pathogen occurrence. This research can then be used to inform decisions to promote more consistency across NWSS or, at minimum, determine comparable methods.
- Development and validation of passive samplers. Specific studies should be conducted to determine sensitivity (i.e., ability to detect low levels of target) and compare passive sampler capture over time with traditional composite sampling to evaluate the ability to produce quantitative or semi-quantitative results in different waste streams to aid in the interpretation of results.
- Comparison of solid versus liquid sampling. Additional research is needed to compare the effectiveness of both sampling methods for reducing sampling-derived variability and improving comparability across sites. Research is also needed to define the representativeness of various solid sampling approaches in different wastewater treatment systems, and if and where system configurations may be inappropriate for representative solids sampling.
- Statistical analysis of existing data to inform sampling optimization. Additional research should be supported to develop standardized, validated approaches for optimizing sampling sites and identifying redundancies, thereby improving sustainability and cost-effectiveness.
- Determination of a sampling strategy for new pathogen targets. National analysis of NWSS sites and data on new targets are needed to gather information as to whether the new targets necessitate a different sampling frequency or spatial distribution to provide needed information while minimizing redundancy. This information is critical to inform decisions on trade-offs between sampling consistency across all targets and cost optimization alternatives.
- Understanding and improving rural representation in NWSS. Additional analyses of diverse data sets (e.g., cell phone data) could illuminate the extent to which existing NWSS sites encompass rural populations. Where critical data gaps exist, research could evaluate the feasibility of models to use existing site data to estimate disease trends in communities not included in the NWSS.


