Progress Toward Restoring the Everglades: The Tenth Biennial Review - 2024 (2024)
Chapter: 2 Restoration Progress
2
Restoration Progress
This committee is charged to discuss restoration accomplishments and assess “the progress toward achieving the natural system restoration goals of the Comprehensive Everglades Restoration Plan [CERP]” (see Chapter 1 for the statement of task and Appendix A for a discussion of restoration goals). In this chapter, the committee updates the National Academies’ previous assessments of CERP and related non-CERP restoration projects (NASEM, 2016, 2018, 2021, 2023; NRC, 2007, 2008, 2010, 2012, 2014). The committee also discusses programmatic and implementation progress and the ecosystem benefits resulting from the progress to date.
PROGRAMMATIC PROGRESS
To assess programmatic progress, the committee reviewed primary issues that influence CERP progress toward its overall goals of ecosystem restoration. These issues, described in the following sections, relate to project authorization, funding, and project scheduling.
Project Authorization
Once project planning is complete, CERP projects with costs exceeding $25 million must be individually authorized by Congress before they can receive federal appropriations. Water Resources Development Acts (WRDAs) have served as the mechanism to congressionally authorize U.S. Army Corps of Engineers
(USACE) projects. In the 20 years since the CERP was launched in WRDA 2000, six WRDA bills have been enacted:
- WRDA 2007 (Public Law 110-114), which authorized Indian River Lagoon (IRL)-South, Picayune Strand Restoration, and the Site 1 Impoundment projects;
- Water Resources Reform and Development Act (WRRDA) 2014 (Public Law 113-121), which authorized four additional projects (C-43 Reservoir, C-111 Spreader Canal [Western], Biscayne Bay Coastal Wetlands [BBCW Phase 1], and Broward County Water Preserve Areas [WPAs]);
- WRDA 2016 (Title I of the Water Infrastructure Improvements for the Nation Act [WIIN Act]; Public Law 114-322), which includes authorization for the $1.9 billion Central Everglades Planning Project (CEPP);
- WRDA 2018 (Public Law 115-270), which authorized the CEPP post-authorization change that included the 240,000 acre-foot (AF) Everglades Agricultural Area (EAA) Storage Reservoir;
- WRDA 2020 (Public Law 116-260), which authorized the Loxahatchee Watershed Restoration Project and combined the EAA Storage Reservoir and the CEPP into a single project; and
- WRDA 2022 (Public Law 117-263), which included no new CERP project authorizations but included additional authorization for IRL-South and authorized expedited completion of the EAA Reservoir.
Authorized CERP projects are sometimes classified by the WRDA bills in which they were authorized—Generation 1 (WRDA 2007), Generation 2 (WRDA 2014), Generation 3 (WRDA 2016 and 2018), and Generation 4 (WRDA 2020)—with the Melaleuca Eradication Project, which was authorized under programmatic authority, included in Generation 1. The occurrence of WRDAs every 2 years (since 2014) has ensured that the authorization process does not delay CERP restoration progress.
Funding
Within the past 2 years, authorized and requested funding—from fiscal years (FYs) 2023 and 2024, respectively—have continued at record-high levels. In FY 2023, both the state and federal agencies allocated more than $400 million in CERP funding—a first in the history of Everglades restoration (Figure 2-1). These allocations continue the historic pace of funding from FY 2022, when $1.1 billion was appropriated for the Everglades as part of the Infrastructure Investment and Jobs Act in addition to the annual USACE budget. In FY 2024, the USACE has budgeted
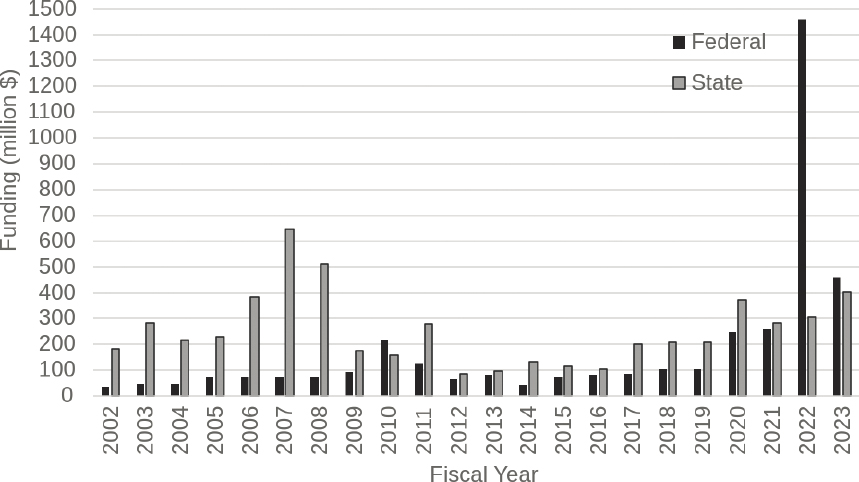
SOURCE: Data from SFERTF, 2024.
$413 million for the CERP,1 and the FY 2025 President’s Budget includes a request for $444 million for this program (OMB, 2024). In FY 2024, the State of Florida budgeted $470 million for the CERP (State of Florida, 2023), and the governor has recently signed the budget for FY 2025 with $664 million for the CERP (State of Florida, 2024). Continuation of these record-high budgets will help sustain a rapid pace of project implementation, which will expedite natural system restoration progress.
Through FY 2023 the federal government and the State of Florida have each spent $2.6 billion on CERP planning and construction (USACE, 2023d). Current projections estimate that CERP completion will total $23.2 billion (in FY 2020 dollars; USACE and DOI, 2020), although future project authorizations and modifications may affect that estimated total.
Project Scheduling and Prioritization
The anticipated future progress of CERP projects and the relationships among all the federally funded South Florida ecosystem restoration projects and some
___________________
1 See https://www.usace.army.mil/Missions/Civil-Works/Budget/#Work-Plans.
highly relevant state-funded projects are depicted in the Integrated Delivery Schedule (IDS). The IDS is not an action or decision document but rather a useful communication tool that provides information to decision makers across agencies to guide planning, design, construction sequencing, and budgeting. The schedule is developed by the USACE and the South Florida Water Management District (SFWMD) in consultation with the U.S. Department of the Interior (DOI), the South Florida Ecosystem Restoration Task Force, and the many CERP constituencies. The IDS replaced the Master Implementation Sequencing Plan, initially developed for the CERP, as required by the Programmatic Regulations (33 CFR §385.31).
Updated versions of the IDS were released in November 2022 (USACE, 2022a) and November 2023 (USACE, 2023e). The 2023 IDS update provides a forecasted project planning, design, and construction schedule for the next 10 years (through 2034), based on optimal funding scenarios. Essentially, the IDS provides the agency’s vision of the appropriate implementation plan based on project dependencies and construction capacity, assuming that funding is not a constraint. All authorized projects are included in the schedule, but not all components are listed if the design has not been completed (e.g., IRL-South natural storage areas, muck removal, and habitat creation).
The past 2 years of historically large funding levels enabled the program to largely keep pace with the aggressive schedule set forth in the 2022 IDS, with no delays on the completion of Generation 1 projects and some delays in Generation 2 and 3 projects, but an expedited plan for completion of the EAA Reservoir. The 2023 IDS assumes continuation of these historically high funding levels, with estimated project costs of $1.5 to $2.0 billion per year between 2024 and 2027. If funding levels return to pre-2023 levels, the pace of implementation will be substantially slower than that shown in the IDS and will require CERP leadership to decide whether to prioritize the rapid implementation of some projects over others to expedite overall ecosystem benefits or substantially delay the completion of all projects.
NATURAL SYSTEM RESTORATION PROGRESS
In the following sections, the committee focuses on recent information on natural system restoration benefits emerging from the implementation of CERP and major non-CERP projects. The implementation status of CERP projects is shown in Table 2-1, and pending unplanned projects are listed in Table 2-2, including Southern Everglades, the last major CERP planning effort and a critical element of restoration for Everglades National Park and Florida Bay.
TABLE 2-1 CERP Project Implementation Status as of May 2024
| Project or Component Name | Yellow Book (1999) Estimated Completion | IDS 2023 Estimated Completion | Project Implementation Report Status | Authorization Status | Construction Status |
|---|---|---|---|---|---|
| GENERATION 1 CERP PROJECTS | |||||
| Picayune Strand Restoration (Fig. 2-2, No. 1) | 2005 | 2005 | Submitted to Congress, 2005 | Authorized in WRDA 2007 | Ongoing |
| Site 1 Impoundment (Fig. 2-2, No. 2) | 2007 | Submitted to Congress, 2006 | Authorized in WRDA 2007 | ||
|
– Phase 1 |
Completed | Completed, 2016 | |||
|
– Phase 2 |
Not specified | Requires authorization | Project on hold | ||
| Indian River Lagoon-South (Fig. 2-2, Nos. 3 and 4) | Submitted to Congress, 2004 | Authorized in WRDA 2007 | |||
|
– C-44 Reservoir/STA (Fig. 2-2, No. 3) |
2007 | Completed | Completed, 2021 | ||
|
– C-23/C-24 North and South Reservoirs (Fig. 2-2, No. 4) |
2010 | 2030 | Not begun | ||
|
– C-23/24 STA (Fig. 2-2, No. 4) |
2010 | 2025 | Ongoing | ||
|
– C-25 Reservoir/STA (Fig. 2-2, No. 4) |
2010 | 2028 | Not begun | ||
|
– Natural Lands |
NA | Not specified | Not begun | ||
| Melaleuca Eradication and Other Exotic Plants (Fig. 2-2, No. 5) | 2011 | Completed | Final June 2010 | Prog. Authority WRDA 2000 | Completed 2013, operations ongoing |
| GENERATION 2 CERP PROJECTS | |||||
| C-111 Spreader Canal (Western) Project (Fig. 2-2, No. 6) | 2008 | Final component not specified | Submitted to Congress, 2012 | Authorized in WRRDA 2014 | Mostly completed in 2012; S-198 construction on hold |
| Biscayne Bay Coastal Wetlands (Phase 1) (Fig. 2-2, No. 7) | 2018 | 2025 | Submitted to Congress, 2012 | Authorized in WRRDA 2014 | Ongoing |
| C-43 Basin Storage: West Basin Storage Reservoir (Fig. 2-2, No. 8) | 2012 | 2025 | Submitted to Congress, 2011 | Authorized in WRRDA 2014 | Ongoing |
| Project or Component Name | Yellow Book (1999) Estimated Completion | IDS 2023 Estimated Completion | Project Implementation Report Status | Authorization Status | Construction Status |
|---|---|---|---|---|---|
| Broward County WPAs (Fig. 2-2, No. 9) | Submitted to Congress, 2012 | Authorized in WRRDA 2014 | |||
|
– C-9 Impoundment |
2007 | 2034 | Not begun | ||
|
– C-11 Impoundment |
2008 | 2031 | Ongoing | ||
|
– WCA-3A & -3B Levee Seepage Management |
2008 | 2031 | Not begun | ||
| GENERATION 3 CERP PROJECTS | |||||
| Central Everglades Planning Project (CEPP) North (Fig. 2-2, No. 10) | NA | 2030 | Submitted to Congress, 2015 | Authorized in WRDA 2016 | Ongoing |
| CEPP South (Fig. 2-2, No. 11) | NA | 2031 | Ongoing | ||
| CEPP New Water (Fig. 2-2, No. 13) | NA | 2024 | Completed 2024 | ||
| CEPP EAA (Fig. 2-2, No. 12) | NA | Submitted to Congress, 2018 | Authorized in WRDA 2018, 2020 | Ongoing | |
|
– EAA Reservoir and Pump Station |
2030 | ||||
|
– EAA A-2 STA |
2023 | ||||
| GENERATION 4 CERP PROJECTS | |||||
| Loxahatchee River Watershed (Fig. 2-2, No. 14) | 2013 | 2032 | Submitted to Congress, 2020 | Authorized in WRDA 2020 | Not begun |
| CERP PROJECTS IN PLANNING | |||||
| Lake Okeechobee Watershed (Fig. 2-2, No. 15) | 2009–2020 | NA | Third revised draft, Jun. 2022 | Requires authorization | NA |
| Western Everglades (Fig. 2-2, No.16) | 2008–2016 | NA | Draft Dec. 2023 | Expected 2024 | NA |
| Biscayne Bay and Southeastern Everglades Ecosystem (Fig. 2-2, No.17) | 2008–2020 | NA | In development | Expected 2026 | NA |
NOTES: Does not include non-CERP foundation projects. NA = not applicable.
SOURCES: Data from NASEM, 2023; Parrott, 2024; USACE, 2023e; Velez, 2024; G. Ralph, USACE, personal communication, 2024.
TABLE 2-2 CERP Projects or Components That Have Not Been Addressed in Prior or Ongoing CERP Planning Initiatives as of June 2024
| Project or Component Name | Estimated Financial Requirement | Status |
|---|---|---|
| PENDING CERP PLANNING EFFORTS | ||
| Southern Everglades: Per USACE and DOI (2020) includes | Not available until project planning completed | Planning process anticipated 2025–2028 |
|
– WCA-3 Decompartmentalization (QQ) |
||
|
– Dade Broward Levee/Pensuco Wetlands (BB) |
||
|
– Broward Co. Secondary Canal System (CC) |
||
|
– Flows to eastern Water Conservation Area (EEE) |
||
|
– Lake Okeechobee ASR (GG) |
||
|
– Central Lake Belt Storage Area (S) |
||
|
– Bird Drive Recharge Basin (U) |
||
|
– Divert WCA-2 Flows to Central Lake Belt Storage (YY) |
||
|
– Divert WCA-3 Flows to Central Lake Belt Storage (ZZ) |
||
| PENDING MAJOR UNPLANNED CERP COMPONENTS | ||
| C-43 Basin ASR (D Phase 2) | $483,000,000 | Not yet begun |
| L-8 Basin ASR (K Part 2) and C-51 Regional Groundwater ASR (LL) | $387,000,000 | On hold |
| Site 1 Impoundment ASR (M Phase 2) | $234,000,000 | Inactive after Hillsboro ASR Pilot |
| Palm Beach Agricultural Reserve Reservoir and ASR (VV) | $211,000,000 | Not yet begun |
| Caloosahatchee Backpumping with Stormwater Treatment (DDD) | $136,000,000 | Not yet begun |
| Southern CREW (OPE) | $28,700,000 | On hold |
| Florida Keys Tidal Restoration (OPE) | $23,100,000 | Suspended |
| Loxahatchee National Wildlife Refuge Internal Canal Structures (KK) | $17,600,000 | On hold |
| Henderson Creek – Belle Meade Restoration (OPE) | $10,800,000 | On hold |
| Comprehensive Integrated Water Quality Plan (CIWQP) | $8,300,000 | On hold |
| Florida Bay Florida Keys Feasibility Study (FBFKFS) | $6,500,000 | Suspended in 2007. The project is planned for the future |
NOTES: Remaining unplanned CERP projects include all projects more than $5 million (2019 dollars) as reported in USACE and DOI (2020), for which the components have not been incorporated in other planning efforts or formally removed from the CERP. Letters in parentheses represent project component code from Yellow Book. Estimated financial requirement derived from SFERTF (2023).
SOURCES: Data from SFERTF, 2023; USACE, 2023e; USACE and DOI, 2020.
The discussions of restoration progress that follow are organized into four major sections based on implementation status.
-
Operating CERP projects (or project increments)
- Picayune Strand Restoration Project
- Melaleuca Eradication
- CEPP New Water
- C-111 Spreader Canal
- BBCW
-
Regional operations plans
- Kissimmee Headwaters Revitalization Schedule
- Lake Okeechobee System Operating Manual (LOSOM)
- Combined Operational Plan (COP)
-
Authorized CERP projects/components not yet operating (or constructed)
- CEPP South, CEPP North, and the EAA Reservoir
- C-43
- IRL-South
- Loxahatchee River Watershed
- C-11 Impoundment
-
CERP projects in planning
- Western Everglades Restoration Project (WERP)
- Lake Okeechobee Watershed Restoration Project (LOWRP)
- Biscayne Bay and Southeastern Everglades Ecosystem Restoration (BBSEER)
The committee’s previous report (NASEM, 2023) contains additional descriptions of the projects and progress through mid-2022. The South Florida Environmental Report (SFWMD, 2024a) and the 2023 Integrated Financial Plan (SFERTF, 2023) also provide detailed information about implementation and restoration progress.
CERP Projects with Recent Information on Restoration Benefits Delivered
The committee’s review in this section is based on reported monitoring data to date for CERP projects for which construction has begun, with emphasis on progress and new information gained during the past 2 years.
Picayune Strand Restoration Project
The Picayune Strand Restoration Project (Figure 2-2, No. 1) was the first CERP project under construction. The 55,000 acre (86 mi2) Picayune Strand area in southwest Florida was drained for an intended real estate development,
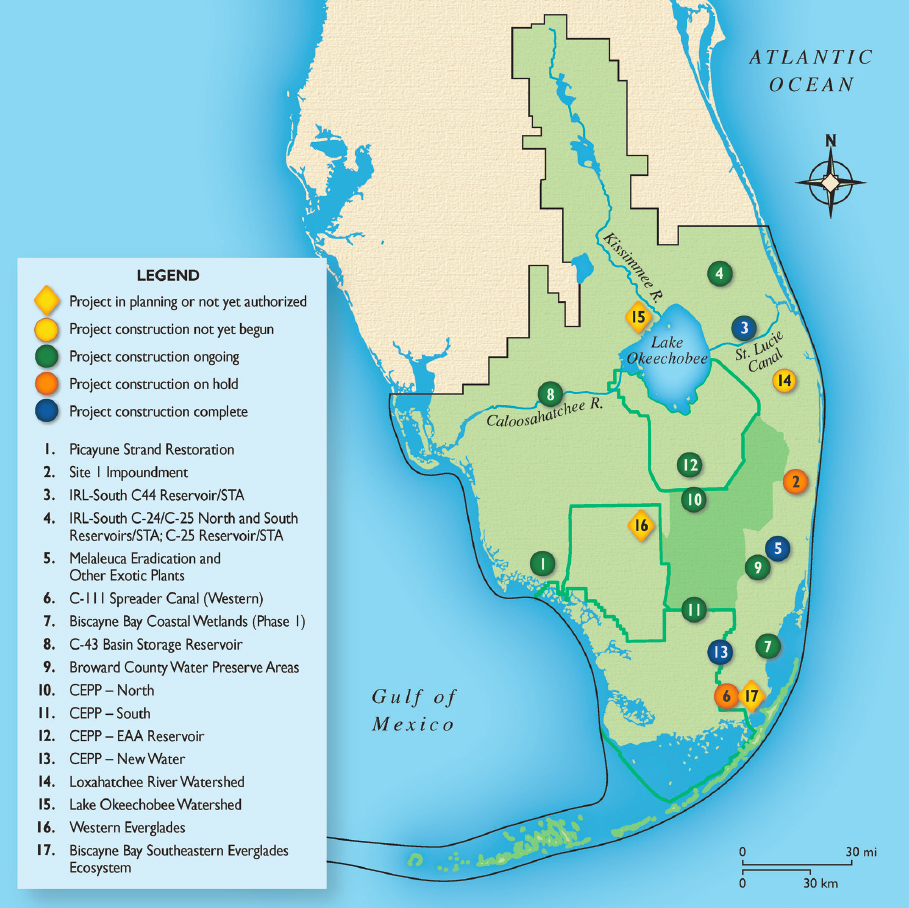
SOURCE: Map by International Mapping.
Golden Gate Estates-South, which was abandoned before completion. Construction of drainage canals and an extensive road network drained a large area of wetlands, reduced sheet flow to the south into the Ten Thousand Islands National Wildlife Refuge, and altered regional groundwater flow into surrounding areas (Figure 2-3). Restoring the predrainage hydrology should bring multiple
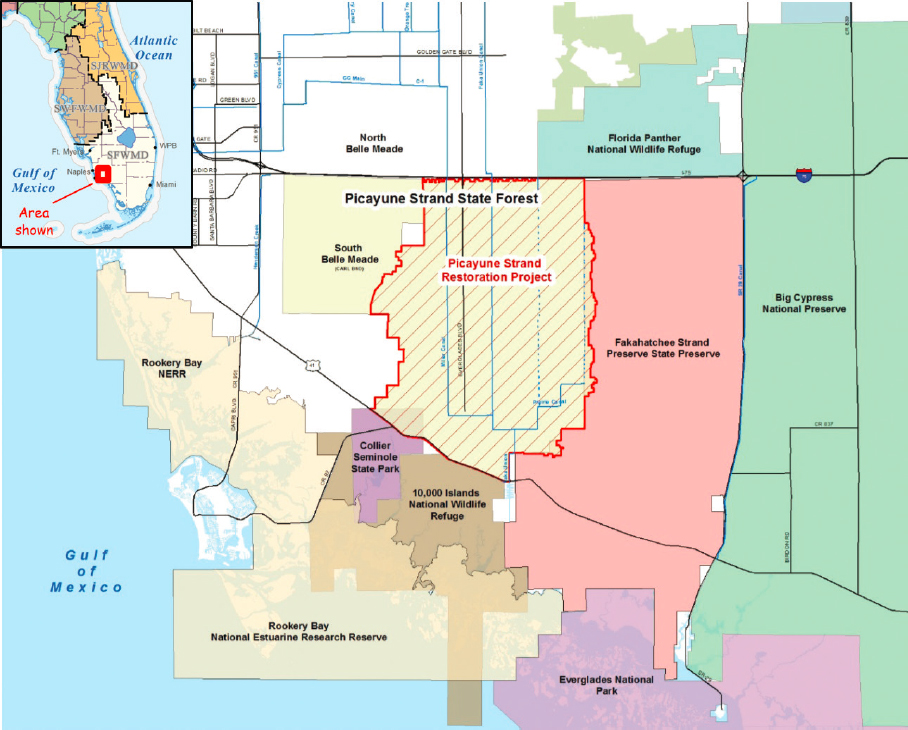
NOTE: Restoration of water levels within the project footprint will enhance the hydrologic conditions in these surrounding natural areas.
SOURCE: Chuirazzi et al., 2018.
ecological and environmental benefits, including an increase in the spatial extent of wetlands, decreased frequency and intensity of forest fires, and increased habitat for endangered species such as the wood stork and Florida panther. The project is also expected to improve groundwater recharge to the City of Naples’ eastern Golden Gate well field, as well as coastal estuarine salinities affected by freshwater point discharges from the Faka Union Canal (RECOVER, 2019).
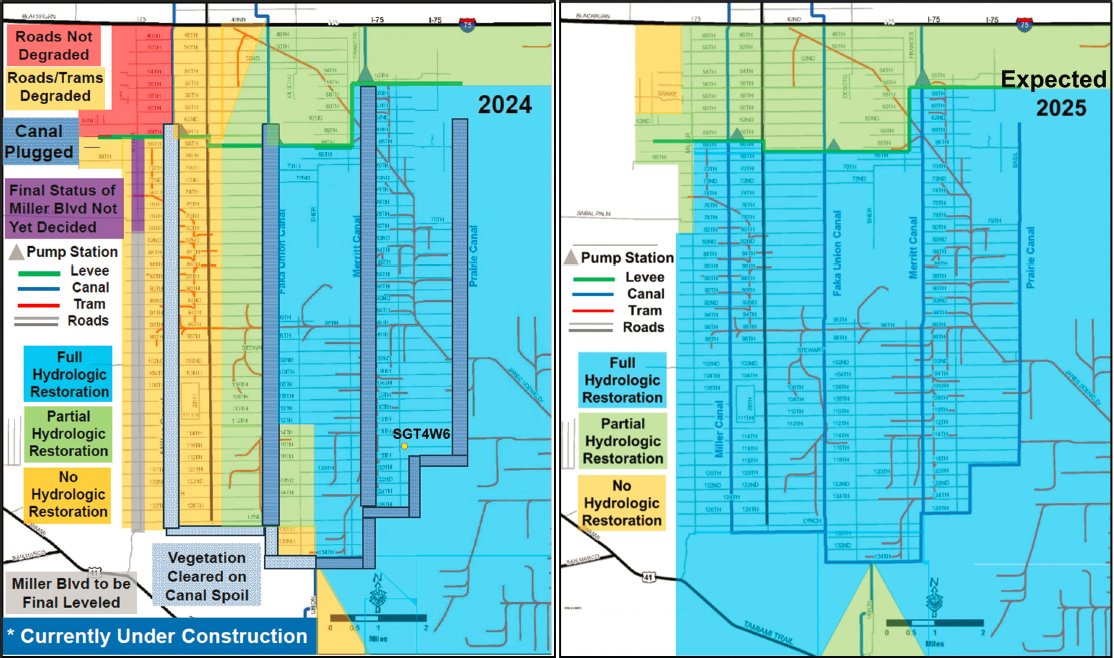
Project components include plugging drainage canals, degrading roads, and removing logging trams (Figure 2-4; USACE and SFWMD, 2004). Construction has

SOURCE: M. Duever, consultant to the SFWMD, personal communication, 2024.
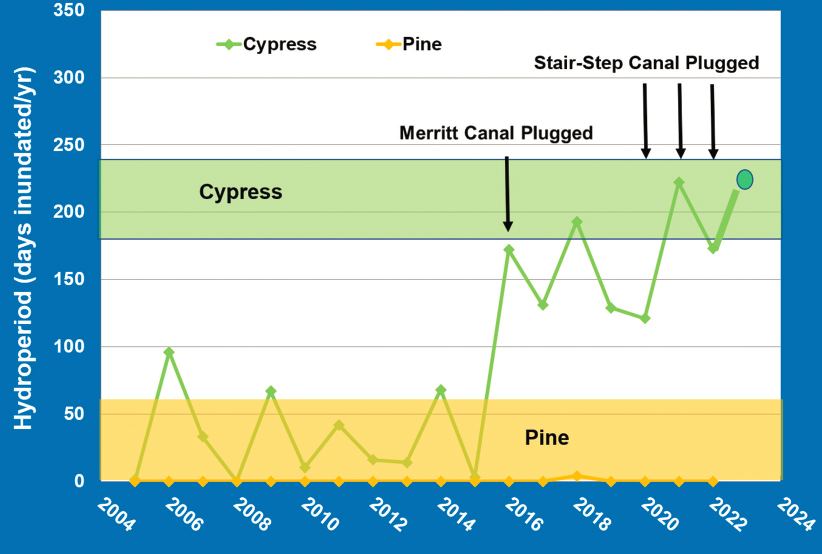
occurred in stages starting with the easternmost portion of the area and proceeding west (Figure 2-5, Table 2-3). The Eastern Stair-step canal was plugged in summer 2021, and 8.4 miles of the Faka Union Canal were plugged by May 2024. The Miller Canal, the westernmost canal, is scheduled to be plugged in late 2024 and 2025 after completion of the Southwest Protection Feature, a levee on the southwest edge of the project intended to reduce flood risk to the agricultural lands to the west of the project. Because of the staged plugging of drainage canals, the degree of hydrologic restoration varies both spatially and temporally. Prior to the 2019–2021 construction, only the northeast corner was considered to have full hydrologic restoration; as of May 2024, roughly half of the project footprint is considered to have full hydrologic restoration, with considerable additional hydrologic restoration expected by the end of 2025 (Figure 2-5).
Recent data on natural system restoration progress.
NASEM (2018, 2023) provided a comprehensive review of the hydrologic and vegetation monitoring program. Ongoing groundwater monitoring since release of the committee’s last report suggests that the area south of the Merritt Pump Station continues to show natural hydrological patterns, with target hydroperiods attained for cypress habitat (Figure 2-6). No additional vegetation data are being collected until 2025, with analysis expected in 2026. Thus, the remainder of this section focuses on information obtained during the past 2 years on invertebrate and vertebrate survey data in relation to hydrologic and vegetation outcomes from restoration efforts.
SOURCE: M. Duever, consultant to the SFWMD, personal communication, 2024.
TABLE 2-3 Phases and Progress of the Picayune Strand Project
| Component | Lead Agency | Road Removal (mi) | Logging Tram Removal | Canals to Be Plugged (mi) | Description | Project Phase Status |
|---|---|---|---|---|---|---|
| Tamiami Trail Culverts | State | NA | NA | NA | 17 culverts constructed | Completed in 2007 |
| Prairie Canal Phase | State (expedited) | 64 | 30 | 7 | Hydrologic restoration of 11,000 acres in Picayune Strand and 9,000 acres in Fakahatchee Strand State Preserve Park | Plugging and road removal completed in 2007; logging trams removed in 2012 |
| Merritt Canal Phase | Federal | 65 | 16 | 8.5 | Merritt pump station, spreader basin, and tie-back levee constructed | Completed in 2015; pump station transferred to the SFWMD in 2016 |
| Faka Union Canal Phase | Federal | 81 | 11 | 8.4 | Faka Union pump station, spreader basin, and tie-back levee constructed | Pump station completed in 2017; 8.4 miles canal plugging completed by May 2024 |
| Miller Canal Phase | Federal/State | 77 | 11 | 13 | Construct pump station, spreader basin, tie-back levee, and private lands drainage canal; remove Western Stair-step canals | Miller pump station completed June 2019. Partial road removal completed September 2022; canal plugging to be completed 2025 |
| Manatee Mitigation Feature | State | 0 | 0 | 0 | Construct warm water refugium to mitigate habitat loss | Completed in 2016 |
| Southwestern Protection Feature | Federal | 0 | 0 | 0 | Construct 7-mile levee, canal, and water control structures for flood protection of adjacent lands | Construction completion estimated in 2024 |
| Eastern Stair-step Canals | Federal | 0 | 0 | 5.2 | Plugging completed in June 2021 |
SOURCES: NASEM, 2023; data updates from M. Duever, consultant to the SFWMD, personal communication, 2024.
SOURCE: Duever, 2023.
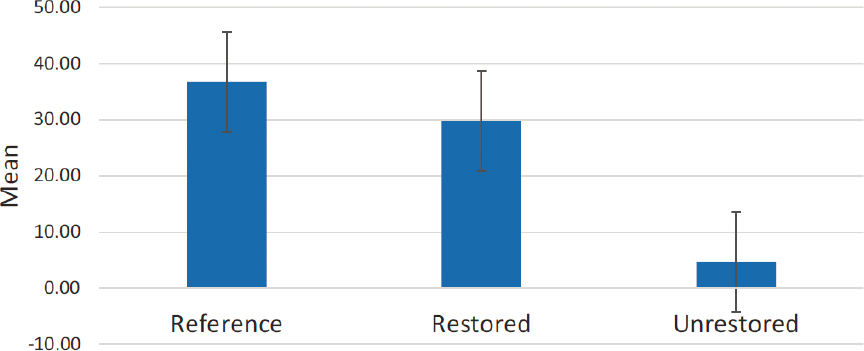
There is some early evidence that animal communities are responding to the changes in hydrology and vegetation enabled by restoration. In comparison to baseline data on the relative abundance and species diversity of aquatic macroinvertebrates collected in 2005–2007 (Bartoszek et al., 2007; Ceilley, 2008), macroinvertebrate assemblages by 2019 in some of Picayune Strand’s cypress habitats had started to exhibit shifts toward the species composition found in reference wetland communities. These shifts included an increase in species richness and recolonization of sites by longer hydroperiod (wetter) indicator species such as freshwater sponges, limpets, and crayfish (Ceilley et al., 2020). Additional monitoring in 2021–2022 revealed similar patterns, including evidence of further convergence of restored sites toward reference conditions since the 2019 macroinvertebrate sampling (Figures 2-7 and 2-8; Ceilley, 2022; Gaglia, 2022). Data on how fish and anuran (frogs and toads) communities are responding to restoration activities in Picayune Strand are limited compared to data on macroinvertebrates but yield important insights for future monitoring of

NOTE: Directional arrows show that restored sites are moving in ordination space toward reference habitats.
SOURCE: Gaglia, 2022.
these taxonomic groups. As of 2019, the spatial extent of successful sampling remained constrained by short hydroperiod conditions not conducive to supporting fish. Moreover, Ceilley et al. (2020) reported abundant capture of the African jewelfish, a nonnative, invasive species, which may complicate the ability to track native fish community recovery. Anuran diversity and abundance surveys have thus far been limited to monitoring of artificial structures (i.e., PVC pipes that treefrogs use for shelter). The results have primarily yielded invasive treefrogs to date; more than 90 percent of frogs sampled from 2005 to 2019 in Picayune Strand have been Cuban treefrogs (Ceilley et al., 2020; Clark, 2020), obfuscating the ability to discern how native species are responding to restoration. Although this sampling technique has benefits such as ease of standardized, repeated sampling over time, it has several limitations. For example, only refuge-seeking species such as treefrogs typically utilize these artificial habitats, leaving the presence of other species (e.g., Ranid frogs) in the anuran community unknown. Adopting the use of automated audio recording technology (e.g., “frog loggers”;
SOURCE: Gaglia, 2022.
De Solla et al., 2006; Dorcas et al., 2009; Measey et al., 2017; Stevens et al., 2002), with the possibility of employing artificial intelligence to support analyses of recordings (Gan et al., 2021; Lapp et al., 2021), would provide a more comprehensive assessment of the species of amphibians using restored habitats and might help to overcome possible sampling biases toward a single invasive species. Automated audio recordings offer the additional benefit of documenting broader changes to the soundscape in response to restoration activities. For example, ecoacoustics are increasingly used to document bird diversity and even underwater fauna (Desjonquères et al., 2020), as well as responses of ecosystems to restoration (Ramesh et al., 2023) and the invasion of nonnative species (Barney et al., 2024; Hopkins et al., 2022; Ribeiro et al., 2022).
The committee’s overall conclusion is that restoration of hydrology in the Picayune Strand Restoration Project appears to already be generating benefits to the local flora and fauna, with vegetation and macroinvertebrate communities responding favorably. Additional longitudinal monitoring will be needed to continue documentation of recovery, especially given the magnitude of seasonal and inter-annual variation. Sampling methods for some species (e.g., amphibians) need to evolve to generate a clearer picture of what species are responding to restored hydrology. Modern passive acoustics are one example of a sampling
method that could have far-reaching benefits for Everglades restoration. Invasive species will remain a challenge, and their management will be key to the reestablishment of some native species.
Recent issues affecting progress.
Newly discovered, unanticipated impacts of the project on endangered red-cockaded woodpeckers (RCWs, Dryobates borealis) will likely require design modifications in the vicinity of the Miller Canal. To date, impacts on RCWs have not been an important consideration because the species does not occur in the original project area. The U.S. Fish and Wildlife Service (FWS) Biological Opinion included in the Project Implementation Report (PIR) (USACE and SFWMD, 2004) thus focused on how the project would impact the species’ potential habitats—mesic and hydric pine flatwoods—in the project footprint and concluded that the project would not adversely affect the species. However, new analyses completed in early 2024 have revealed that the project will likely harm RCW habitat in the adjacent South Belle Meade tract to the west of the original project area (Figure 2-9).
Adverse impacts of the project on RCWs in Belle Meade were not totally unanticipated, because analyses included in the PIR estimated that the project would result in a roughly 14 percent loss each of mesic and hydric pine flatwoods in Belle Meade (USACE and SFWMD, 2004). At the time, the RCW population in Belle Meade was very small, having been extirpated in 2000 and reestablished in 2001. In 2004, it consisted of only four family groups (Folk, 2018). Therefore, there was little concern about the impact of the project on the Belle Meade RCWs, but the population continued to expand, reaching a stable population size of 14–15 family groups by 2016 (Folk, 2018; Mangione and Spickler, 2022). Potential impacts on the RCW population became an issue in 2019 when new modeling associated with National Environmental Policy Act analysis for the Southwest Protection Feature redesign indicated that the project would create a hydrologic flow-way running from the Miller pump station through the southeastern portion of South Belle Meade (Figure 2-9). The resulting increase in hydroperiod was projected to convert a significant portion of the pine habitat currently occupied by RCWs to wet prairie and marsh that is unsuitable for RCWs.
The situation is complicated by the fact that unlike the original project area, in which development of the failed Golden Gates Estates-South left the landscape in need of restored hydrology, no such need exists in South Belle Meade, which is part of Picayune Strand State Forest. Although RCW habitat in Belle Meade has suffered from wildfires and a hurricane in recent years, hydrologically it is otherwise in good condition (J. Spickler, Florida Fish and Wildlife Conservation Commission, and M. White, Florida Forest Service, personal communication, 2024). Hence, the Picayune Strand Restoration Project does not appear to provide any benefits to RCWs in South Belle Meade that could compensate for identified negative effects.
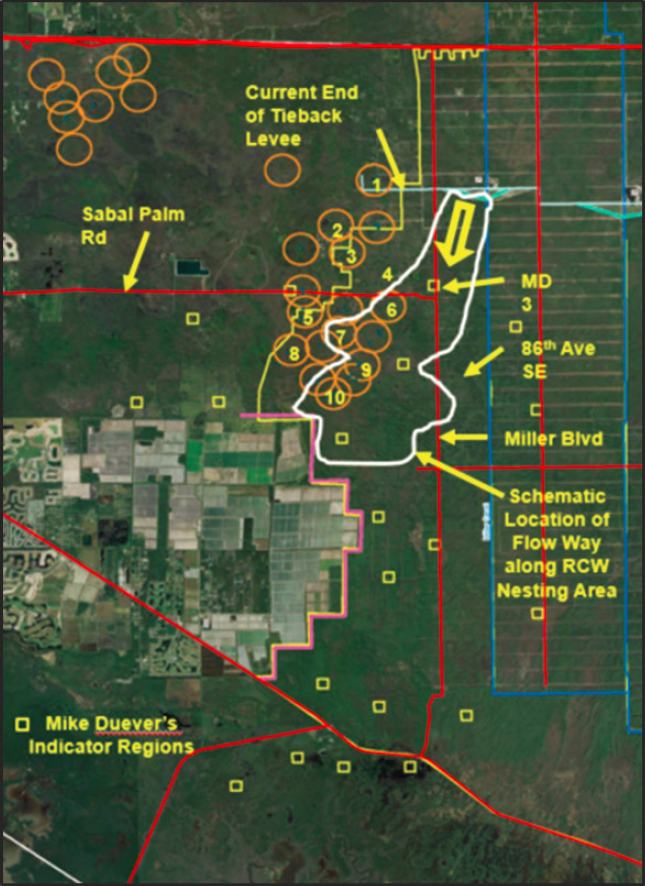
SOURCE: USACE et al., 2023b.
In response to the projected adverse impacts on RCW habitat, the Project Delivery Team is proposing to leave a section of Miller Boulevard from 64th Avenue to 80th Avenue to act as a berm. This option does not require new features or significantly increase costs, nor is its implementation likely to delay construction (A. McKenzie, SFWMD, personal communication, 2024). Whether resolving this issue delays completion of the final stage of construction of the Picayune Strand Restoration Project instead depends on the length of time it takes to move the selected option through the approval process. This issue is discussed further in Chapter 5 in the context of adaptive management.
Melaleuca Eradication and Other Exotic Plants
CERP funds were used to construct the Biological Control Rearing Annex, adjacent to the U.S. Department of Agriculture’s Invasive Plant Research Laboratory (IPRL) in Davie, Florida, and CERP operational funding ($660,000 per year) supports biocontrol efforts for invasive plants in the Everglades (A. Dray, USDA, personal communication, 2024). The IPRL evaluates potential insect or fungal natural enemies in the native range of an invasive plant, obtains permits to export and import those species, raises them in quarantined conditions, evaluates how best to produce large numbers and release them to the wild, obtains permits for those releases, and then monitors the success of the releases. In general, biological control measures complement physical control measures (e.g., cutting or herbicide application) (Dray et al., 2023).
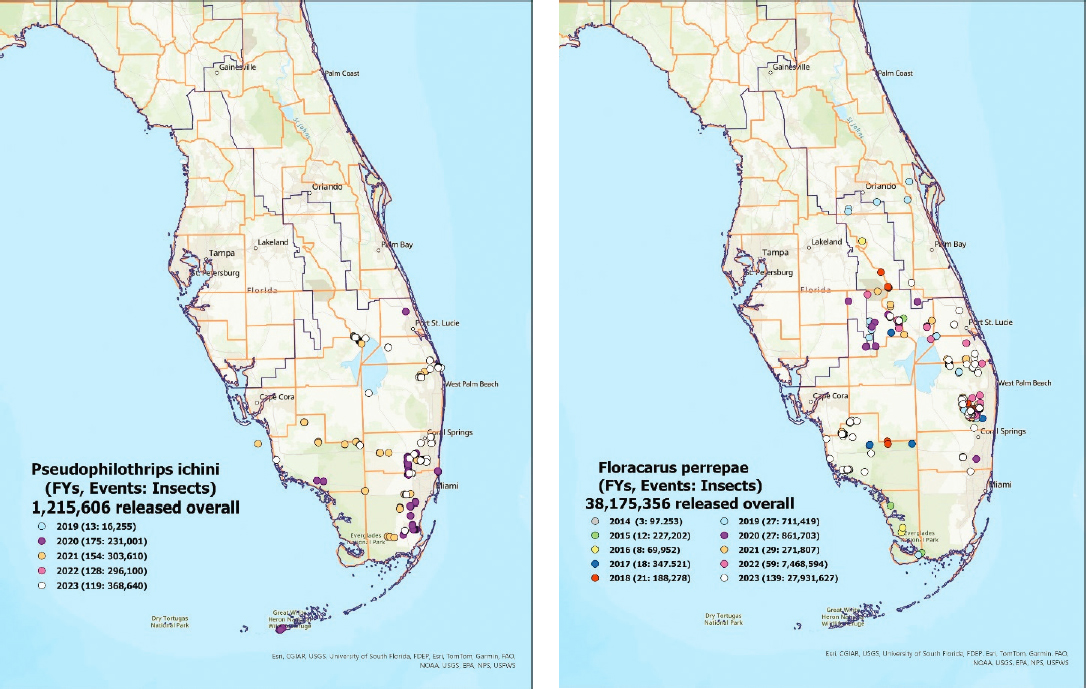
Five particularly problematic invasive plants that are the focus of recent and ongoing management and biocontrol in the South Florida ecosystem are listed in Table 2-4. Figure 2-10 shows recent information on the locations, numbers of release events, and numbers of released insects for two major biocontrol species. Melaleuca was once the most vigorously managed invasive plant, but integrated control measures, including biocontrol by a weevil, a sap-sucking psyllid, and a midge, have reduced the area dominated by Melaleuca by approximately 75 percent (Smith, 2022). In South Florida, Melaleuca control is considered to be in maintenance mode and is no longer targeted by active control methods except in areas where other invasive species are being controlled. The biological control agents drastically reduce establishment of seedlings except in persistently wet areas where the weevil—the most effective biocontrol agent—does not pupate (Smith, 2022). IPRL identified another midge species from the Melaleuca native range, the tip-galling midge, Lophodiplosis indentata, that was able to complete its life cycle in wet areas. Lophodiplosis indentata was granted a release permit in April 2022 and was introduced at one site in June 2023. A monitoring grid has been set up to confirm establishment of a field population and detect spread from the release site (Dray et al., 2023).
TABLE 2-4 Biocontrol Agent Rearing for Invasive Plant Species Control from 2019 to 2024
| Invasive Species | Biocontrol Agents in Use |
|---|---|
| Melaleuca (Melaleuca quinquenervia) | tip-galling midge (Lophodiplosis indentata; in testing) |
| Brazilian pepper (Schinus terebinthifolia) | Brazilian peppertree thrips (Pseudophilothrips ichini) |
| water hyacinth (Eichhornia crassipes) | water hyacinth planthopper (Megamelus scutellaris) has been used but is no longer needed to maintain control |
| Old World Climbing Fern (Lygodium microphyllum) | Lygodium mite (Floracarus perrepae) Lygodium defoliator moth (Neomusotima conspurcatalis) |
| air potato (Dioscorea bulbifera) | air potato beetle (Lileoceris cheni) has been used but is no longer needed because control has been reached |
SOURCE: Data from Dray et al., 2022.
Brazilian pepper is one of the most invasive upland shrubs in Florida and is problematic elsewhere. It has been primarily controlled by chemical and mechanical means, but biocontrol is now provided by two insect species. The Brazilian pepper thrips, Pseudophilothrips ichini, was first released in July 2019 and is currently being mass reared and distributed. Monitoring has demonstrated that it has established persistent populations in the field and is spreading into new areas (Dray et al., 2023). A second species, a leaf galler (Calophya latiforceps), was approved for release in 2019 but as of 2022 has not been released because the rearing colony at IPRL was lost during the pandemic and has not yet been replaced by collecting new insects in Brazil (Cuda et al., 2023).
Water hyacinth is an extremely invasive aquatic nuisance. Control efforts using herbicides started in the 1940s. Frequent repeated herbicide sprays are required because water hyacinth rapidly regrows after being sprayed. Biocontrol was started in the 1970s in an attempt to provide more sustainable biological control (Goode et al., 2021). The three biocontrol insect species introduced in the 1970s effectively reduced biomass of water hyacinth but did not substantially reduce cover (Tipping et al., 2014), and immature stages were killed by herbicide use. Since 2007, IPRL has used CERP funding to identify biocontrol species that are less effected by herbicide use. The water hyacinth planthopper, Megamelus scutellaris, was released starting in 2010. In experimental conditions, the combination of biocontrol and herbicide use reduces water hyacinth biomass to zero or near-zero and reduces regrowth, which increases the time between required herbicide sprays (Tipping et al., 2017). Megamelus scutellaris is less effective in the field because dispersal of the planthopper makes it difficult to maintain high densities on water hyacinth plants.
The Old World Climbing Fern is one of the worst invasive plants in moist areas of central and southern Florida. First reported as naturalized in 1965, it spreads horizontally and vertically to form thick mats covering other vegetation.
SOURCE: Dray et al., 2023.
It is a difficult plant to control because it is widespread, it covers large areas, and herbicide use is expensive. Two species, brown lygodium moth, Neomusotima conspurcatalis, and the lygodium mite, Floracarus perrepae, were released in 2008, but in the field, neither has a consistent effect on Lygodium spread (Walker et al., 2024). The brown lygodium moth is no longer being reared and released because of disease issues and labor-intensive maintenance (Dray et al., 2023). IPRL is evaluating the suitability of additional natural enemies as biocontrol agents (Walker et al., 2024).
The air potato vine is invasive across the southeastern United States. Like the Old World Climbing Fern, it spreads horizontally and vertically and covers extant vegetation. Large-scale field releases of a beetle, Lilioceris cheni, started in 2012 (Rayamajhi et al., 2019) and continued until 2019. Field monitoring shows that greater than 90 percent of air potato vines are damaged by L. cheni and vegetative reproduction is greatly reduced, to the extent that additional releases and herbicidal measures are not needed. The plant is no longer considered a priority invasive species by land managers (Overholt et al., 2016; Rayamajhi et al., 2019). Rearing and release of L. cheni was terminated in 2022 (Dray et al., 2021).
Evaluating the success of biocontrol measures is complicated because biocontrol has the potential to impact large areas but usually has a chronic, not an acute, effect that acts over long time frames. Current species-specific monitoring has focused on assessing population persistence in and dispersal from introduction sites (Dray et al., 2022). There are examples of substantial impact in limited areas (Figure 2-11), but landscape-scale effects are more difficult to monitor. In general, biocontrol has generally been viewed as a success for Melaleuca and air potato vine but has been less effective for other species for various reasons.
Vegetation mapping using remote sensing is the best way to assess large-scale effects of invasive species management, using trained staff to identify species-specific signatures in remote-sensed imagery. The recently completed vegetation map of Everglades National Park, using color-infrared aerial photography taken in 2009 (Ruiz et al., 2021), includes maps of locations and cover of Brazilian pepper, Melaleuca, and Lygodium, although Lygodium was difficult to detect. Because these maps are based on aerial photography, they only show areas where an invasive species is apparent in the canopy, but they provide a baseline landscape-scale assessment. An updated vegetation map based on more recent imagery would provide a useful means to assess large-scale progress in the control of invasive plants in the Everglades.
Central Everglades Planning Project
The CEPP is the keystone project in the restoration of the central heart of the Everglades. It will provide the means to send additional water south through

NOTE: The helicopter shadow helps delineate the extent of the damage.
SOURCE: Dray et al., 2022.
the Water Conservation Areas (WCAs) and Everglades National Park to Florida Bay, reduce harmful discharges to the northern estuaries, and improve the timing and distribution of flow in the central Everglades (USACE, 2024a). The CEPP continues to progress at the rapid pace that has characterized it throughout its development, authorization, and implementation (NRC, 2014). The CEPP is a complex project with four phases, each with multiple components: CEPP South, CEPP North, CEPP New Water, and CEPP EAA. Its many parts include improvements in seepage management; improvements in conveyance through filling of canals, levee removal, and addition of new structures such as pump stations and
gated spillways; a large water storage feature (the EAA Reservoir); and construction of the A-2 stormwater treatment area (STA) to ensure that the new inflows comply with existing water quality requirements (Figure 2-12). Although all of these project components are under active construction, in this section the committee discusses CEPP New Water, which is now operating with evidence of restoration benefits. The other CEPP project components are discussed in a later section under projects under construction.
CEPP New Water.
CEPP New Water consists of a single project—a partial depth seepage barrier. Its objective is to reduce seepage from Northeast Shark River Slough into the 8.5 Square Mile Area to the east (Figure 2-13), reducing flood control constraints on operations to allow more existing water to flow south. Previously, the Limestone Products Association constructed 5 miles of seepage barrier (35 feet deep) south of Tamiami Trail along the L-31N levee (also known as the L-31N Rock Miners Seepage Wall) to the north of the CEPP New Water project, and in December 2022 the SFWMD completed construction of a 2.3-mile, 63-foot-deep seepage barrier adjacent to the 8.5 Square Mile Area immediately south of the project (Figure 2-13). CEPP New Water created an additional 5.0 miles of seepage barrier (55–65 feet deep) running from the SFWMD seepage barrier north to the L-31N Canal. There will be a 1.6-mile gap between this new seepage barrier and the existing Rock Miners Seepage Wall to the north (Figure 2-13). CEPP New Water was completed in early 2024 (Parrott, 2024).
It is already evident that the two new seepage barriers will greatly reduce, and perhaps even eliminate, flood control constraints imposed by the 8.5 Square Mile Area/Las Palmas community within the CEPP footprint. Prior to the COP, these constraints for decades completely stymied every attempt to restore the historic distribution of flow between Northeast and Western Shark River Slough (NASEM, 2021). Although the COP has been highly successful in restoring historic flow patterns, it has not been immune to these constraints, experiencing four events in which flood control constraints affected operations in water year (WY) 2021 and two more in WY 2022 (NASEM, 2023). With the completion of the SFWMD seepage barrier and the CEPP New Water curtain wall, there have been no such events since (see also The Combined Operational Plan below) (B. Mills, SFWMD, personal communication, 2024). The change in hydrology can be seen in Figure 2-14, which shows that water levels within the 8.5 Square Mile Area now remain up to 3 feet lower than water levels in the adjacent slough. The importance of eliminating flood control constraints emanating from the 8.5 Square Mile Area on water management to restoration in the central Everglades cannot be overstated and paves the way for additional water deliveries in the CEPP.

SOURCE: USACE and SFWMD, 2024.

NOTE: The combined seepage barrier along the 8.5 Square Mile Area would end 1.6 miles from the end of the 5-mile Rock Miners Seepage Wall.
SOURCE: Modified from Reynolds, 2022.
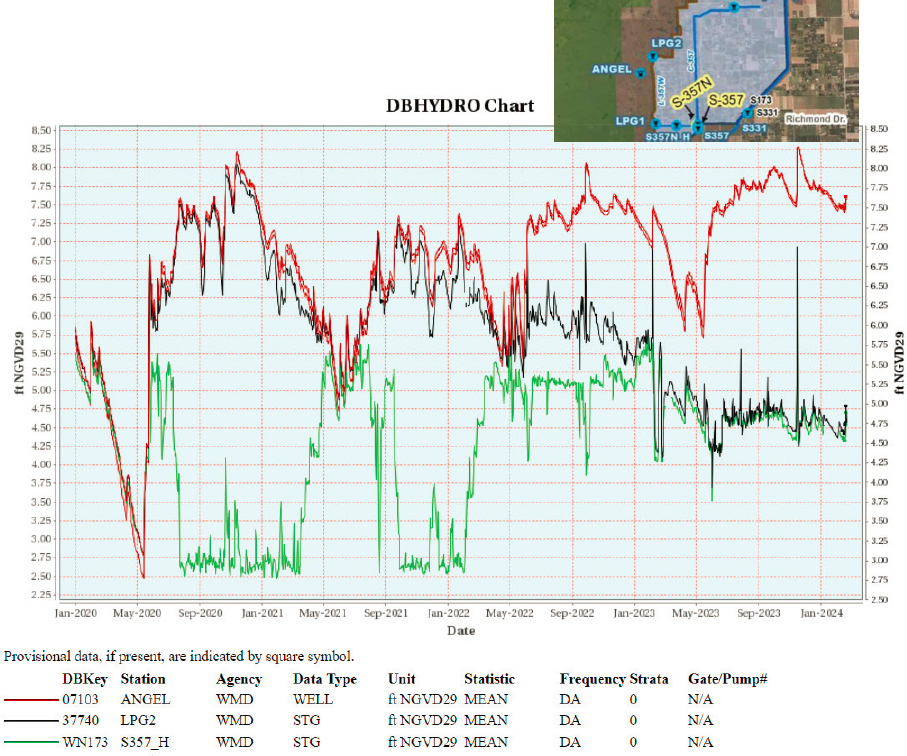
NOTES: Since the start of construction of the CEPP New Water seepage barrier in 2022, Angel’s well (red line), located outside the 8.5 Square Mile Area, has exhibited water levels up to 3 feet higher than those of a well just inside the new seepage barrier (LPG [black line]). In September 2022, the SFWMD’s 2.3-mile seepage barrier was completed, which together with a previously constructed interior seepage drainage system has managed flooding in the southern end of the 8.5 Square Mile Area (green line).
SOURCE: B. Mills, SFWMD, personal communication, 2024.
C-111 Spreader Canal Western Project
The C-111 Canal, originally designed to provide flood protection in Dade County, spurred agricultural development on lands to the east while draining water from the Southern Glades and Taylor Slough in Everglades National Park. A principal source of the freshwater in the canal is seepage from Everglades
National Park. Because seepage drains water from the park and alters the flow pattern of Taylor Slough, the C-111 Canal has had detrimental ecological and environmental effects on Taylor Slough and Florida Bay. The C-111 Canal also discharges large volumes of freshwater through the S-197 structure into Manatee Bay and Barnes Sound, while reducing overland flows that entered the central zone of Florida Bay, altering the natural salinity regime and ecology of those waters.
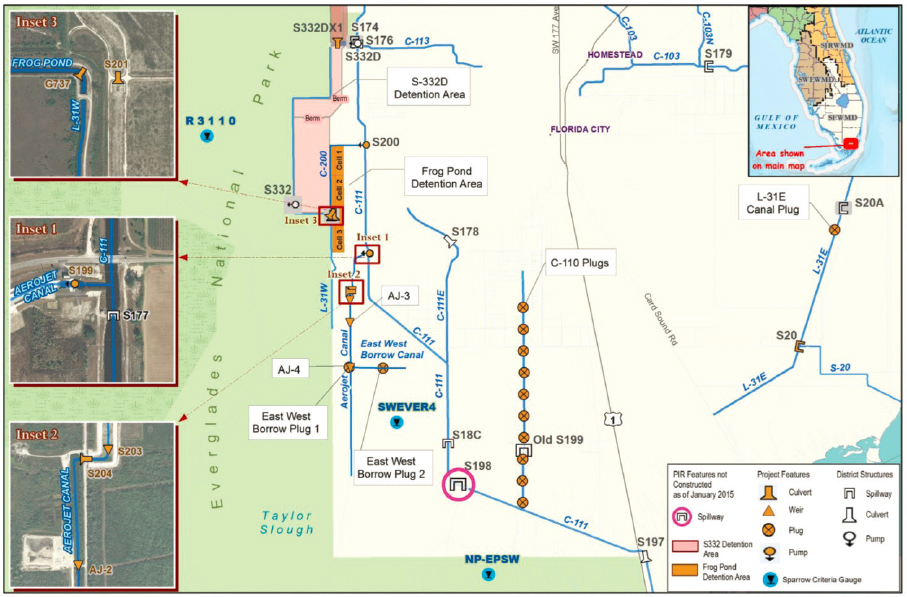
The construction of the C-111 Spreader Canal project (Figure 2-2, No. 6) was envisioned in two phases—the eastern and western projects. Planning for the features and objectives of the C-111 Spreader Canal Eastern project are part of the BBSEER project, discussed later in this chapter. The western project (Figure 2-15) was designed to help restore the quantity, timing, and distribution of water delivered to Florida Bay via Taylor Slough; improve hydropatterns within the Southern Glades; and lower coastal-zone salinities in central and eastern Florida Bay. The project was largely completed in February 2012 through expedited investment by the SFWMD, and operations began in June 2012. Construction of the final
SOURCE: Qiu et al., 2018.
project component—the S-198 Spillway (Figure 2-15)—is currently on hold. The SFWMD reports that it “may be implemented” if it is “anticipated to increase restoration and can be implemented without adversely impacting pre-project levels of flood protection” (Gottlieb et al., 2024); it remains unclear whether it will be constructed, because it is not included in the next 10-year schedule in the 2023 IDS (USACE, 2023e).
The C-111 Spreader Canal Western project pumps excess water from the canal into the 600-acre Frog Pond Detention Area and into the Aerojet Canal impoundment (Figure 2-15), thereby creating a 6-mile hydraulic ridge along the eastern boundary of Everglades National Park to reduce seepage from the park and improve the hydrologic conditions of Taylor Slough. Rather than a persistent feature, the hydraulic ridge is present and functions only when water is available to fill the detention area. The project is also intended to contribute to improved distribution of flows in the Southern Glades through emplacement of earthen plugs along the C-110 Canal and through modified operations of structures located principally along the southern segment of the C-111 Canal.
Annual SFWMD reports show prior year data on flow and stages (e.g., Gottlieb et al., 2024), but no recent long-term analysis is available on the hydrological or ecological outcomes of the project relative to expectations or baseline conditions. Gottlieb et al. (2024) report, “Within Taylor Slough, dry-season water levels have risen, and dry season tidal creek flows have increased” since operations began, although the data analysis is not presented. Given the overlap in downstream footprint of the project with other CERP and non-CERP projects, the SFWMD concluded that potential interactions will make it difficult to tease out specific direct benefits of the project (Gottlieb et al., 2024). The project features are operated as part of the COP, which outlines the integrated operations of CERP and non-CERP projects in the region. The benefits of the COP are discussed later in this section.
Biscayne Bay Coastal Wetlands, Phase 1
Historically, Biscayne Bay received freshwater from overland flow passing through the coastal ridge and wetlands, and from extensive groundwater seepage. As a consequence of historical hydrologic alteration and development, freshwater delivery to Biscayne Bay has been greatly reduced, particularly in the dry season, resulting in loss of wetlands and an increase in salinity along the western margin of the bay. At the same time, controlled freshwater pulse discharges as point sources create altered flow, salinity, and nutrient inputs into the bay. Freshwater wetlands in the Southern Everglades have been reduced in area, altered, and degraded because of water management practices, land development, and sea-level rise, and much of the Model Lands, Southern Glades, and South Dade Wetlands are drained. These factors have contributed to landward
expansion of saltwater and mangrove wetlands, including low-productivity, sparsely vegetated dwarf mangroves, and invasive exotic vegetation. The BBCW Project (Figure 2-2, No. 7) was developed to address these issues.
The primary goal of the BBCW Project is to reduce near-shore salinity and improve the ecological condition of wetlands, tidal creeks, and other habitats by increasing freshwater flows to Biscayne Bay and Biscayne National Park. The full BBCW Project, as outlined in the Yellow Book (USACE and SFWMD, 1999), envisioned restoration of wetland hydroperiods to 11,300 acres of the total 22,500 acres of wetlands. The footprint of BBCW Project Phase 1 is small. Its goals are to restore about 400 acres of freshwater wetlands and redistribute existing surface water to another approximately 2,000 acres in three geographically distinct components: the Deering Estate component, just north of the Biscayne Bay National Park, and the L-31E Flow-way and the Cutler Wetlands components, portions of which are within Biscayne National Park (Figure 2-16). The Deering Estate component was completed in 2012 and is operational. L-31E Flow-way is under construction, with some incremental benefits and completion expected in 2025 (Charkhian, 2023). No restoration progress is expected from the Cutler Wetlands component, which is only recently under construction, with completion estimated in 2025 (USACE, 2023e). The objectives of BBCW Project Phase 2 are being addressed through the BBSEER planning process, discussed later in the chapter.
Deering Estate.
The goal of the Deering Estate component is to rehydrate the wetland region east of Old Cutler Road, reduce point source discharges at S-123, and restore a more natural freshwater flow regime. The hydrologic objective was to redirect up to 100 cfs of water from the C-100A Spur Canal, via the S-700 pump station, to the coastal wetlands using nighttime pumping (see Chapter 5, Figure 5-8), thereby reducing point source freshwater discharges. However, in WY 2019 the SFWMD moved to continuous pumping at a minimum rate of 25 cfs to alleviate the hydrologic flashiness that occurred with intermittent pulsed releases (Charkhian, 2023). This change improved the hydration and increased the hydroperiod in the remnant wetlands over approximately 19 acres in this project area underlain by extremely porous limestone, which significantly reduced the groundwater and surface-water salinity in the wetland. Annual vegetation monitoring between 2019 and 2022 noted increasing numbers of willows and royal palm in the wetland sloughs (Charkhian and Niemeyer, 2023).
L-31E Flow-way.
The goal of the L-31E Flow-way component is to improve habitat conditions by diverting water that would normally be released through the L-31E Canal to the adjacent coastal wetlands via 10 newly constructed culverts, thereby lowering near-shore salinities. These culverts have been in place since 2010, but without completion of the associated pumps, it is difficult to maintain

SOURCE: Charkhian, 2024.
the canal stage high enough (stage target level is 2.2 feet National Geodetic Vertical Datum [NGVD]) to promote outflow through the culverts. The USACE is expected to finish construction of the L-31E Flow-way component in 2025, which will include a total of five pump stations (USACE, 2023e).
Several coastal wetland vegetation transects downstream from the L-31E culverts were sampled in 2022 and 2023. All transects remained dominated by a mangrove overstory, and a large decrease in mangrove with freshwater inflows has not been observed. New establishment of herbaceous species was limited and largely consisted of salt-tolerant species. The presence or increase of other freshwater species such as sawgrass outside of a few meters of established culverts was not observed (Charkhian, 2024). Charkhian (2024) stated,
As future deliveries of fresh water to the wetland are anticipated to substantially increase in the next two years, future monitoring efforts will determine whether this early lack of response is a result of the limited volumes of fresh water that have been delivered till now, or the strength of the opposing influences represented by rising sea level in Biscayne Bay, irrespective of any changes in freshwater delivery.
Regional Operations Plans
Kissimmee River Headwaters Revitalization Schedule
The Kissimmee Basin includes more than two dozen lakes in the Kissimmee Chain of Lakes, their tributary streams and associated marshes, and the Kissimmee River and floodplain (Figure 2-17). The Kissimmee River Restoration Project was authorized in 1992 with the goal of restoring more than 40 mi2 (or one-third) of the river-floodplain ecosystem and 44 miles of the river channel. Project features, which included backfilling 22 miles of the C-38 Canal, removing water control structures, and reconnecting remnant river segments, were completed in 2021, setting the stage for implementation of the new Headwaters Revitalization Schedule, which is beginning phased implementation in 2024.
Once fully implemented, anticipated in 2026, the new stage regulation schedule for the S-65 water control structure will allow water levels to rise up to 1.5 feet higher than the current S-65 schedule and will increase the water storage capacity of the Upper Kissimmee Basin by approximately 100,000 AF (Koebel et al., 2024). This increased capacity will allow releases to more closely approximate the historic flows needed for restoration of the Kissimmee River and its floodplain wetlands and is also expected to improve littoral zone conditions in Headwaters Lakes.
The ultimate goal of hydrologic restoration for the entire Kissimmee River is to restore the single, continuous floodplain inundation event that occurred

SOURCE: Betts et al., 2024.
most years prior to channelization that typically began late in the wet season, continued well into the dry season, and extended throughout all seasons in some years. Floodplain inundation supported wetland vegetation along the Kissimmee River floodplain and provided important foraging habitat for wading birds and waterfowl and nursery areas for native fish. Modeling results project that floodplain inundation will improve with the 1,400-cfs discharge plans while also improving conditions to the Headwaters Lakes (Koebel et al., 2024).
Lake Okeechobee System Operating Manual
Management of Lake Okeechobee is challenged by its fast inputs and limited managed outflow, allowing high precipitation events to raise water levels quickly. Prolonged high-water levels result in the loss of submerged aquatic vegetation (SAV) in the littoral zone (because of low light transmissivity) and extreme high-water levels can pose dike safety issues, thereby requiring releases to the northern estuaries. These releases alter salinity and increase turbidity and nutrient loads, which can negatively affect SAV in the estuaries and exacerbate harmful algal blooms. In contrast, extended periods of low precipitation can lower water levels in the lake, leading to expansion of invasive species in the littoral zone and threats to water supply deliveries to utilities, agricultural producers, and residential populations (see NASEM, 2018, for in depth discussions of Lake Okeechobee and the northern estuaries).
In 2022, after extended stakeholder input, the USACE released a draft of LOSOM as the updated plan to manage the water levels in the lake after completion of the Herbert Hoover Dike rehabilitation efforts (USACE, 2022b). Zone D of the proposed operating schedule provided considerable flexibility compared to previous plans as to when to hold or release water from the lake, but with this flexibility comes uncertainty regarding the criteria for operational decisions within Zone D (Figure 2-18). LOSOM also resulted in substantially less water storage (between 460,000 and 800,000 AF) compared to the operations in place when the CERP was originally designed (for more information, see NASEM, 2023). Implementation of LOSOM was scheduled for March 2023 but was delayed pending final agency review after recent consultation and a biological opinion from the National Oceanic and Atmospheric Administration’s National Marine Fisheries Service (NMFS, 2023).
The LOSOM Final Environmental Impact Statement (EIS; USACE, 2024b) was published in May 2024. The EIS reemphasizes the USACE operational strategy to balance the needs of managing flood risk, water supply, navigation, recreation, and the ecological health of fish and wildlife. The committee acknowledges the greater flexibility in LOSOM to make releases to improve water supply and enhance fish and wildlife, as well as use whole-system behavior to make
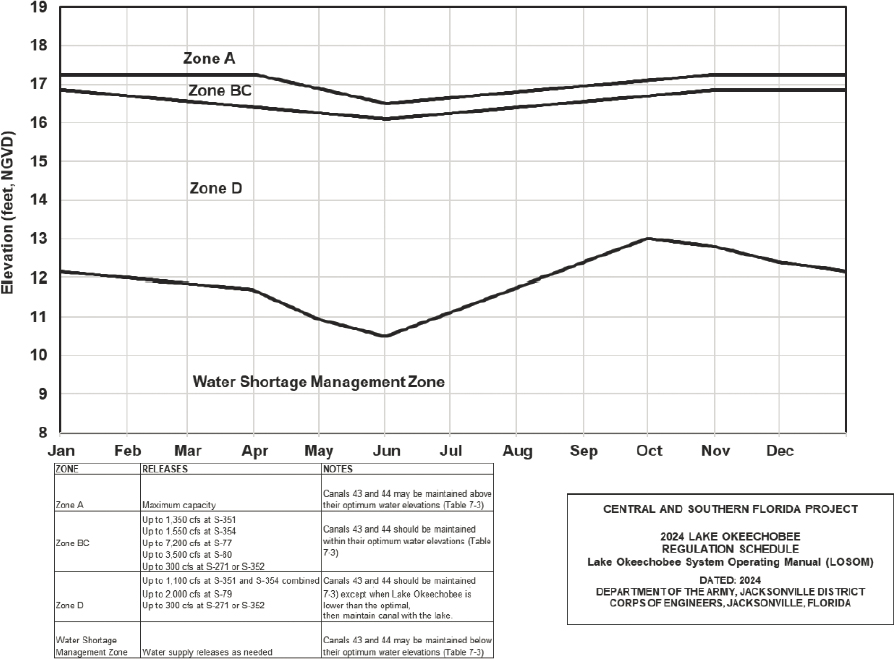
NOTES: If lake level exceeds the top line bordering Zone A, water must be released to the northern estuaries at maximum discharge capacity. In Zone BC, discharge levels are high but below maximum (≤7,200 cfs to the Caloosahatchee River Estuary and ≤3,500 cfs to the St. Lucie Estuary) to lower lake levels. Within Zone D, no water is discharged to the St. Lucie Estuary and up to 2,000 cfs may be discharged to the Caloosahatchee River Estuary.
SOURCE: USACE, 2024b.
real-time decisions, because of the latitude in Zone D. NASEM (2023) recommended that the USACE implement a process for periodic multi-stakeholder review of Lake Okeechobee operations relative to the objectives of LOSOM to build confidence that the flexibility of the new operational schedule is being used as designed and to support learning to enhance future decision making. USACE (2024b) noted that it plans to hold three seasonal periodic scientist call meetings per year for agency and stakeholder communication and input.
The Combined Operational Plan
The COP is a comprehensive, integrated water control plan that defines the operations of the constructed features of the Modified Water Deliveries to Everglades National Park (Mod Waters) and C-111 South Dade projects (Figure 2-13) and other water management structures in the region. These non-CERP projects whose capabilities it incorporates are considered foundation projects for the CERP because they alter the delivery and flow of existing water in ways that are critical to the CERP’s capacity to deliver additional flow volumes and restoration benefits. In addition, completion of Mod Waters and its operations plan was required before federal funding could be appropriated to begin construction of the CEPP. Therefore, the implementation of the COP marks not only the largest step by far toward restoring the hydrology and ecology of the central Everglades yet achieved but also the beginning of the next phase of the restoration of the heart of the Everglades embodied in the CEPP.
Two features of Mod Waters and other related projects are especially critical to the capacity of the COP to make significant changes to the hydrology of the central Everglades. First, raising the Tamiami Trail and bridging extensive portions of it enables increased flows into Northeast Shark River Slough and Everglades National Park, and much more as sheet flow (Box 2-1). Second, seepage management and flood mitigation features along the eastern boundary of Everglades National Park (Figure 2-13) reduced flood risk management constraints that limited flows into Northeast Shark River Slough. The C-111 South Dade Project improved seepage management along the eastern boundary of Everglades National Park further south, enabling more flow through Taylor Slough to Florida Bay, while continuing to honor flood risk management constraints for the agricultural lands east of the park (USACE, 2022c). The C-111 Spreader Canal Western project extends this hydraulic ridge southward, providing additional restoration benefits to Taylor Slough.
The ongoing ecological degradation of the central Everglades (see NRC, 2012 for a review) has long been a major concern motivating restoration efforts, and management of water in this area is a source of controversy. The COP is the latest in a series of water management plans that attempts to address the issues in this region. The development of the COP was informed by data gathered during a period of incremental operational testing, beginning in 2015. Thus, the hydrologic and ecological changes discussed in this section reflect incremental operational changes from 2015 to 2020 and full implementation of the COP in September 2020, which were made possible by the new infrastructure available from the Mod Waters, C-111 South Dade, and Tamiami Trail Next Steps projects.
A comprehensive assessment of observed COP benefits can be found in the COP Biennial Report (USACE et al., 2023a), which summarizes COP operations,
BOX 2-1
Tamiami Trail Next Steps Project
The 10.7 miles of the Tamiami Trail between the L-31N and L-67 extension levees have been an impediment to surface flow from WCA-3 into Northeast Shark River Slough located in Everglades National Park since the completion of this highway in 1928. Reducing the impact of this barrier has been an important component of the restoration. The Modified Water Deliveries Project created a 1-mile bridge, completed in 2013, near the eastern end of this portion of the Trail. Phase 1 of the Tamiami Trail Next Steps project, completed in 2019, addressed an additional 2.6 miles of highway with 2.3 miles of bridging at the western end of the 10.7 miles of the Trail (Figure 2-19). The Tamiami Trail Next Steps Phase 2 project will reduce the impact of the remaining 6.7 miles of highway on sheet flow through the addition of six new 60-foot-wide slab bridges, improvements to seven culverts, and raising of the highway in unbridged segments. Phase 2 construction began in 2021 and is projected to be completed in 2026 (USACE, 2023e). With the completion of this project, the entire 10.7 miles of the Trail will have been modified, which will enable raising of the maximum water level in the L-29 Canal to 9.7 feet to accommodate the CEPP, which will have a profound effect on capacity to manage water moving through WCA-3 into Everglades National Park. At that time managers anticipate implementing a new water management plan (CEPP 1.0) that will replace the COP and that incorporates these new features.
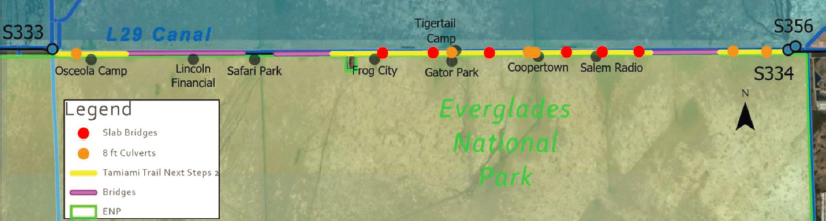
SOURCE: Johnson, 2020.
the USACE decision-making rationale for any deviations, and the hydrologic and ecosystem status for the period September 1, 2020, through April 30, 2022. The COP Biennial Report seeks to address whether the plan is achieving its objectives and whether adjustments are recommended. The report also evaluates the adaptive management uncertainties identified in the design of the COP based on recent monitoring results.
Hydrologic responses.
The COP Biennial Report (USACE et al., 2023a) presents an analysis of the hydrologic performance of the COP, employing the performance metrics used in the development of the COP as a reporting and evaluation framework. Monitoring results from before and after COP implementation and simulated COP performance from the Regional Simulation Model for the Glades and Lower East Coast Service Areas (RSM-GL) are compared. This comparison enables assessment of actual COP performance relative to the expectations based on modeling, and thus provides insight on the predictive performance of the modeling in terms of recent historical conditions (termed baseline, WY 2002–2015), which sheds light on the actual improvements achieved on the ground. Although encompassing only approximately 2 years of full COP operations, the report includes both a wet (WY 2021) and dry water year (WY 2022), signaling some early hints at COP performance. The biennial reports will be increasingly informative and important as the period of COP implementation lengthens.
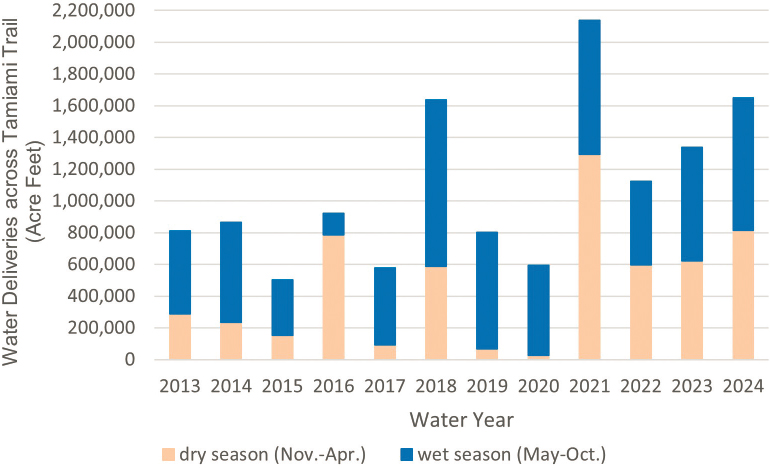
For the current report period, the hydrologic results have been consistent with or better than the expectations based on model simulations and better than historical conditions. Even in the dry year of WY 2022, the water deliveries across Tamiami Trail were well above the typical deliveries prior to 2016 (note that the period after 2016 and prior to the COP consisted of incremental field testing of the Mod Waters features and emergency deviations and is less useful for comparisons) (USACE et al., 2023a). As the committee noted previously, the COP has been remarkably successful so far in not only increasing water deliveries across Tamiami Trail, particularly during the dry season (Figure 2-20), but also restoring the historical distribution of those flows between Western and Northeastern Shark River Slough (Figure 2-21; NASEM, 2023).
Water deliveries to Taylor Slough have also shown improvements from COP implementation to date. The longer hydroperiods have been observed relative to the pre-2016 baseline for most of the Everglades National Park region and especially in Northeastern Shark River Slough, Taylor Slough, and the western and eastern marl prairies. Again, the results compare well with the modeled expectations and generally show improvement relative to the historical baseline. Dry days and risk of soil oxidation within Everglades National Park have been reduced under the COP relative to the baselines even in the dry year, although risk of soil oxidation increased as was anticipated in north-central WCA-3A. In terms of increases in freshwater flows to Florida Bay, the results are modest and reflect the need for additional projects to come online before improvements can be expected there (USACE et al., 2023a). Overall, the early hydrologic results from the COP are promising and provide confidence in the modeling, coordination, and evaluation process used to produce it.
SOURCES: Data from Velez, 2024, and L. Do, USACE, personal communication, 2024.
Ecological responses.
To assess ecological performance, the COP Biennial Report (USACE et al., 2023a) employs a similar process as that used to assess hydrological performance. Of the four ecological performance measures monitored—freshwater fish, tree islands, wood stork and wading bird nesting, and slough vegetation—there are, as yet, too few data to definitively assess COP performance for freshwater fish and tree islands. For wood stork and wading bird nesting (see also below), the variation in rainfall over the period of review was deemed too large to evaluate the impact of the COP (USACE et al., 2023a). The fourth performance measure, slough vegetation, however, is highly informative. Coincident with increased hydroperiods in Northeastern Shark River Slough under the incremental field testing and the COP, long hydroperiod species such as sawgrass and slough species such as Eleocharis are expanding (USACE et al., 2023a). Nocentini et al. (2024) further document this pattern, including transitions to wetter plant communities along the gradient from dry marl prairie to beaksedge (Rhynchospora tracyi) marsh to sawgrass marsh to slough communities, as well as loss of marl prairie species. These results indicate that a predicted ecological benefit of the COP is being achieved.
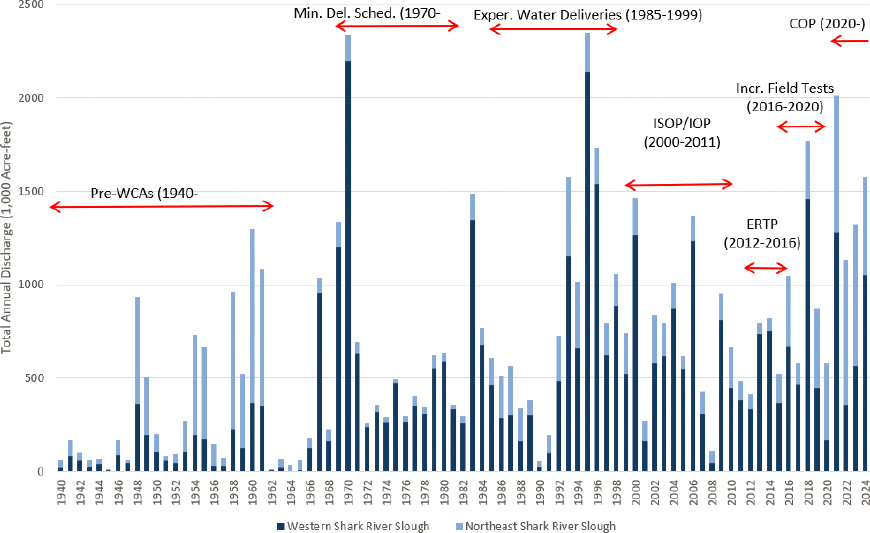
NOTES: The red arrows demarcate the water management plans that governed water flows through these pathways from 1940 to 2024. These data highlight the increasing flows into Northeast Shark River Slough in the COP.
SOURCES: R. Johnson, DOI, and E. Stabenau, National Park Service, personal communication, 2024.
Additional ecological monitoring associated with the COP addresses impacts on threatened and endangered species (see Table 2-5 for the committee’s summary of results of monitoring for the Cape Sable seaside sparrow [Ammodramus maritimus mirabilis], Everglade snail kite [Rostrhamus sociabilis plumbeus], and wood storks [Mycteria americana]) related not only to performance measures but also to criteria for incidental take, exceedances of which could require reinitiating consultation with the FWS over COP operations.2 The prior period
___________________
2 Several of the criteria require an exceedance in 2 consecutive years to reinitiate consultation. Exceedances may also be attributable to climatic variability rather than operations of the COP. For example, if an exceedance did occur but localized rainfall was the cause of the exceedance, then re-initiation of consultation may not be warranted because the root cause was not attributable to operations (G. Ralph, USACE, personal communication, 2024).
TABLE 2-5 Committee Assessment of COP Effects on Threatened and Endangered Species Relative to 2016–2020 Conditions
| Type | Target/Criterion | Baseline Performance (2016–2020) | COP Performance (2021–2023) | Assessment |
|---|---|---|---|---|
| Cape Sable Seaside Sparrow | ||||
| Take | Population size | Criterion met 4/4 (100%) | Criterion met 3/3 (100%) | Criterion always met, close to exceedance 1/5 baseline and 2/3 COP years, no improvement over baseline |
| Parameter | Nesting season dry days in 6 subpopulations | Target met 12/30 (40%) | Target met 3/10 (30%) | Target only sometimes met, no improvement over baseline |
| Parameter | 4-year average hydroperiod in 6 subpopulations | Target met 8/30 (27%) | Target met 2/10 (20%) | Target met regularly 1 subpopulation, rarely in 5, no improvement over baseline |
| Snail Kite | ||||
| Take | Maximum dry season water level (4/15–5/31) | Criterion met 1/5 years | Criterion met 2/3 years | Criterion sometimes met, improvement over baseline |
| Take | Pre-breeding maximum water level (6/1–12/31) | Criterion met 3/5 years | Criterion met 2/2 years | Criterion usually met, improvement over baseline |
| Take | Recession rate (maximum stage difference) | Criterion met 18/20 (90%) at 4 gages | Criterion met 6/12 (50%) at 4 gages | Criterion sometimes met, less often compared to baseline |
| PM | Dry season water level (5/1–6/1) | NA | Target met 56%, 2%, 100% days 2021–2023 | Variable success meeting target depending on rainfall regime |
| PM | Pre-breeding water level | NA | Target met 2/2 years | Target always met |
| PM | Optimal and suboptimal (but suitable) weekly recession rates during nesting season (1/1–6/1) | NA | Over 3 years, 3% optimal, 30% suboptimal, 67% undesirable | Suboptimal target sometimes met, optimal target rarely met |
| Type | Target/Criterion | Baseline Performance (2016–2020) | COP Performance (2021–2023) | Assessment |
|---|---|---|---|---|
| Wood Stork | ||||
| Take | Nesting season maximum water level in WCA-3A (3/1–5/31) | Criterion met 9/15 (60%) months | Criterion met 8/9 (89%) months | Criterion almost always met, improved over baseline |
| PM | Optimal and suboptimal (but suitable) weekly recession rates during nesting season (1/1–6/1) | NA | Over 3 years, 5% optimal, 82% suboptimal, 14% undesirable | Suboptimal target almost always met, optimal target rarely met |
| PM | Maximum undesirable recession rates during nesting season (1/1–6/1) | NA | Target met all weeks 2021 and 2022, met 20/22 weeks 2023 | Target almost always met |
| PM | Optimal and suboptimal (but suitable) water depths in the core foraging areas of active nesting colonies | NA | Generally met in 2021, often not met in 2022, 2023 | Target sometimes met |
| PM | Maximum conversion of short to long hydroperiod wetlands within core foraging areas | NA | Greatly exceeded in 2021, 2022 (no data for 2023) | Target appears unattainable |
NOTES: Three types of measure are included: criteria for incidental take (Take), performance measures (PM), and hydrological parameters indicating potential for incidental take of Cape Sable seaside sparrows (Parameter). Results are shown for the incremental testing baseline period (baseline performance) and for full COP operations (COP performance) and summarized in Assessment.
SOURCES: Data from USACE, 2023f, 2023g; USACE et al., 2023a.
of incremental testing (2016–2020) was used as the baseline for comparisons to COP performance (2021–2023), limiting the ability to assess the full benefits of the COP relative to previous management plans (NASEM, 2021). No comparisons to a baseline have been made for performance measures for threatened and endangered species; performance is instead assessed in terms of success in meeting targets.
The monitoring results summarized in Table 2-5 highlight the challenges that the COP faces in meeting precise, complex targets over extended periods, such as water levels and especially recession rates during the nesting season for snail kites and wood storks. The COP and the infrastructure it employs likely lack the capacity to adjust sufficiently to achieve such precise goals under all rainfall regimes, a conclusion evidently reached by FWS in its decision not to reinitiate consultation in response to exceedance of incidental take of snail kites based on recession rates (Table 2-5). Impacts on wood storks and snail kites were not expected to be sufficiently adverse to result in constraints on operations, and no constraints have been placed on operations. For these two species, performance related to incidental take criteria, as anticipated, has instead improved under the COP relative to the 2016–2020 baseline, with the exception of the recession rate criterion for kites.
Results for the Cape Sable seaside sparrow present a very different picture. Simulations of COP performance predicted that the hydrologic targets for the sparrow will not be met (USACE, 2020a), and monitoring confirms this prediction. If anything, performance has declined under the COP relative to baseline (Table 2-5). The evidence is abundant that the COP is reducing short hydroperiod wetlands (see above; see also NASEM, 2023). That the acres of short hydroperiod wetlands within the core foraging areas of stork colonies experiencing long hydroperiods exceeded the target by an order of magnitude in each of the first 2 years of the COP (USACE, 2023g) adds to this evidence. Because of these changes, sparrows are losing habitat in the areas they currently occupy, and to date, they have not colonized new suitable habitat created by the COP. Data as of July 2024 indicate that their estimated population size has fallen below the threshold for incidental take (2,387 sparrows) (M. Meyer, FWS, personal communication, 2024). The future of the sparrow under the COP and subsequently the CEPP is an issue that requires creative solutions, sooner rather than later.
Water quality responses.
The 2023 COP Biennial Report highlighted ongoing water quality concerns, noting an exceedance in the 12-month average phosphorus concentration for inflows to Shark River Slough during WY 2019. Since then, exceedances have occurred in WY 2021–2023 (Qiu, 2024a,b).
Uncertainty #16b in the COP adaptive management plan (USACE, 2020a) specifically addressed water quality changes due to COP operations:
Water Quality in Northeast Shark River Slough: Will there be downstream biogeochemical effects associated with modifying inflows and hydrologic conditions in [Everglades National Park] ENP, that result in detrimental effects on nutrient movement, availability, and ecological responses?
During the reporting period, monitoring data were analyzed to investigate the potential to reduce concentrations by shifting flows from the S-333 structure to the S-333N structure and/or making adjustments to the S-12 structures, but the analysis showed that such changes would not reduce total phosphorus (TP) concentrations. Concerns were raised about water quality resulting from S-333 operations, but during the COP biennial reporting period, management options were not implemented. Water quality issues associated with increased restoration flows are discussed in more detail later in the chapter.
Summary of COP results.
The initial monitoring results indicate that the COP has met expectations in changing the quantity, distribution, and seasonal patterns of flow and improved conditions relative to the baseline period. Initial results also indicate that these hydrologic changes are producing some of the predicted broader ecological responses that are COP objectives, as illustrated by changes in plant communities and risk of soil oxidation. The COP has achieved much less success with more complex objectives that involve creating fairly precise hydrologic conditions over extended periods of time, as illustrated by recession rates and water levels during the nesting season for threatened and endangered species. Thus, the COP is proving to be what it was intended to be—not a complete solution but rather the first major step toward restoring the central heart of the Everglades. Additional efforts will likely be needed to sustain the Cape Sable seaside sparrow, including but not limited to translocation. The first COP Biennial Report is an effective means of conveying progress toward restoration that should be emulated through the remaining years of the COP and beyond.
CEPP 1.0 operational plan.
Lessons learned from the COP can be applied to the next system operating plan, CEPP 1.0, which is currently in planning to adapt operations to recently completed or soon-to-be-completed CERP features. CEPP 1.0 will incorporate CEPP components scheduled for completion by 2025, including CEPP New Water and several CEPP South features.3 Several non-CERP projects will also be included for the development of this regional operations
___________________
3 These features include the S-333N and S-355W Spillways; the S-631, S-632, and S-633 culverts through the L-67A levee; and the S-152 culvert and L-67 levee gap from the Decomp Physical Model.
plan, including the Tamiami Trail Next Steps Phase 2 project (Box 2-1), the 2.3-mile seepage barrier adjacent to the 8.5 Square Mile Area constructed by the SFWMD, the 5.0-mile CEPP New Water seepage barrier (Figure 2-13), and LOSOM (Figure 2-18). Crucially, CEPP 1.0 will raise the constraint on water levels in the L-29 Canal from 8.5 up to 9.7 feet, enabling movement of even higher flows of freshwater through the central Everglades and into Everglades National Park. Thus, CEPP 1.0 represents a major increment in the restoration of historic flow volumes and distribution beyond that achieved by the COP. Currently alternatives are being developed and compared, with the expectation that CEPP 1.0 will be implemented in 2026 (USACE and SFWMD, 2024).
Authorized CERP Projects Not Yet Constructed or Fully Operating
Six CERP projects are actively under construction, of which four—the C-43 Reservoir, IRL-South, the C-11 Impoundment, and the CEPP (including CEPP South, CEPP North, and CEPP EAA)—are too early in their construction to have documented restoration benefits. Additionally, the Loxahatchee River Watershed project has been authorized, but construction has not yet begun. These projects are described briefly here to understand the context of implementation progress.
C-43 Reservoir
Early in the 20th century, the course of the Caloosahatchee River was deepened and straightened, and canals were excavated in the river basin that connected the river to Lake Okeechobee and drained agricultural lands and urban areas. As a result, during prolonged dry periods, freshwater flow to the estuary is greatly reduced, and saline water can migrate far up the river, killing beds of freshwater submerged plants. Conversely, during periods of heavy rainfall, large volumes of nutrient- and sediment-rich freshwater are transported into the Caloosahatchee River estuary, affecting habitat quality for seagrasses, oysters, and other aquatic organisms. The Caloosahatchee River (C-43) West Basin Storage Reservoir (Figure 2-2, No. 8) is a CERP project designed to impound up to 170,000 AF of stormwater runoff from the C-43 drainage basin or from Lake Okeechobee during wet periods (USACE and SFWMD, 2010), hence protecting the estuary from excessive freshwater. During dry periods, this stored water can be released to supplement low river flows to maintain optimal salinity levels in the estuary. Additionally, the SFWMD is planning to construct a non-CERP in-reservoir alum treatment system to reduce phosphorus loading to the Caloosahatchee River estuary to address concerns that storage of high phosphorus water in the reservoir could contribute to algal blooms (J-Tech, 2020). Reservoir construction has been delayed by the need to replace the contractor (A.B. Williams, 2023),
although completion is still anticipated in December 2025 (USACE, 2024d), and the SFWMD expects to begin filling the reservoir in late 2024 (Parrott, 2024). It is too soon to realize natural system benefits from this project.
Indian River Lagoon-South
The Indian River Lagoon and the St. Lucie Estuary are biologically diverse estuaries located on the east side of the Florida Peninsula, where ecosystems have been impacted by factors similar to those that have impacted the Caloosahatchee River Estuary—surges of freshwater from Lake Okeechobee and canals in the watershed and nutrient-rich runoff from farmlands and urban areas (USACE, 2022d). The IRL-South Project (Figure 2-2, Nos. 3 and 4) is designed to reverse this damage through improved water management, including the 50,600-AF C-44 storage reservoir, three additional reservoirs (C-23/C-24 South, C-23/C-24 North, and C-25) with a total of 97,000 AF of storage, three new STAs (C-44, C-23/24, C-25), dredging of the St. Lucie River to remove 7.9 million cubic yards of muck, and restoration of 53,000 acres of wetlands (Figure 2-22). The project also involves the restoration of nearly 900 acres of oyster habitats and the creation of 90 acres of artificial habitat for oysters and SAV (USACE, 2022d). Construction was completed on the C-44 STA and C-44 Reservoir in March and December 2021, respectively (USACE, 2024e). The reservoir filling was initiated in 2022, operational testing of the reservoir is ongoing as of mid-2024, and work is under way to repair seepage issues that occur when water depths exceed 10 feet (Booth, 2023). The USACE estimates a 2026 completion of the repairs (Williams, 2024).
Construction of the C-23/24 STA began in 2022, the contracts for construction of the C-23/C-24 North and South Reservoirs are anticipated to be awarded in FY 2024, and the construction award for the C-25 Reservoir is expected in late 2024 (Figure 2-22; USACE, 2024e). Because newly completed features remain in the early stages of operational testing, there is no natural system restoration progress to report.
C-11 Impoundment
The C-11 Impoundment is a major component of the Broward County WPAs project (Table 2-1; Figure 2-2, No. 9), which is designed to reduce seepage from WCA-3. The C-11 Impoundment is expected to have approximately 4,600 AF of storage and is designed to capture urban stormwater runoff from the western C-11 basin and associated nutrient loads, which previously had been pumped into WCA-3 via the S-9 pump station. This stored water is expected to help reduce seepage from WCA-3 while also increasing groundwater recharge

SOURCE: USACE, 2022d.
near the feature, thereby enhancing municipal and agricultural water supply and reducing saltwater intrusion (USACE and SFWMD, 2012). This feature was listed as a dependency for CEPP construction in USACE and SFWMD (2014). Construction began in 2017 on an initial Mitigation Area A berm, and a new contract award for continued construction is expected in September 2024 (G. Ralph, USACE, personal communication, 2024). No natural system restoration benefits are expected from construction to date.
CEPP North
CEPP North (Figure 2-2, No. 10) is designed to improve the distribution of flows into northern WCA-3, which has long been subject to overly dry
conditions, to restore its hydrology and ecology. It will also hydrate WCA-2 under high flow conditions. CEPP North includes backfilling of the Miami Canal, as well as several projects designed to improve conveyance (Figure 2-12; USACE and SFWMD, 2014). CEPP North remains in the design phase, and improvements in design based on new information continue to be made (see Chapter 5). As of May 2024, construction was under way on the S-620 gated culvert and the S-8 pump station modifications, and CEPP North is estimated to be completed in 2030 (USACE and SFWMD, 2024).
CEPP EAA
CEPP EAA consists of construction of the EAA (A-2) Reservoir and adjacent A-2 STA (Figure 2-2, No. 12), and several components related to the operation of these new features, such as construction of an inflow pump station and seepage and inflow/outflow canals (Figure 2-12). The objectives of CEPP EAA are to store new water and treat it before moving it south, with projected increases in average annual inflows to the remnant Everglades of 370,000 AF (USACE, 2020b). The principal component of CEPP EAA—the 23-foot-deep, 240,000-AF reservoir—is expected to be completed in 2030. As of May 2024, some features of the A-2 Reservoir are currently under construction, including seepage canal segments and the foundation and seepage cutoff wall, and others are in design or procurement. The A-2 STA is well along in construction and is expected to be completed by December 2024 (USACE and SFWMD, 2024). The timely delivery of the intended benefits of the EAA Reservoir is dependent on the performance of both the existing STAs and the A-2 STA (NASEM, 2023).
CEPP South
The objectives of CEPP South (Figure 2-2, No. 11) are to remove barriers to sheet flow in southern WCA-3A and increase capacity to move more water south (USACE and SFWMD, 2014). It has been progressing at a good pace, and as of May 2024, two components of the project have been completed (S-333N gated spillway, Old Tamiami Trail roadway removal); construction contracts are under way covering construction of three 500-cfs gated structures in the L-67A levee, backfill of the agricultural ditch in WCA-3B, and spoil removal (Figure 2-12). The 2023 IDS estimates completion of most features, including the Blue Shanty Levee, by 2031 if projected funding needs are met.
A more significant issue for the CEPP that may impact restoration progress involves potential ecological impacts from changing phosphorus dynamics associated with increased flows. These issues and their potential causes and solutions are discussed in detail below (see Issues That May Impact Progress: Water Quality
later in this chapter), and possible modifications to CEPP South to address these issues are discussed in Chapter 5.
Loxahatchee River Watershed
Alterations of the Loxahatchee River system and watershed over the past century, including dredging, channelization, and drainage, have substantially altered flows in the watershed and have reduced natural water storage of excess waters, resulting in periods of either excessive or limited flows to the Loxahatchee River Estuary. The resulting changes in natural land cover, including up-river migration of mangrove and the displacement of cypress, raised concern, especially in the area designated as a Wild and Scenic River (FDEP, 2010). The Loxahatchee River Watershed Restoration Project (Figure 2-2, No. 14), authorized in WRDA 2020, seeks to capture, store, and redistribute freshwater currently lost to tide; rehydrate natural areas in the headwaters; reduce peak discharges to the estuary; and improve the resilience of estuarine habitats by altering the timing and distribution of water from upstream. Planned components of the project include wetland restoration and hydrologic improvements within the watershed, a single 9,500-AF impoundment, four aquifer storage and recovery (ASR) wells, and several structures related to connectivity in the southern part of the watershed. Together the project components are expected to deliver 98 percent of the wet season restoration flow target and 91 percent of the dry season restoration flow target in the Northwest Fork of the Loxahatchee River (USACE and SFWMD, 2020a). In turn, these flows are expected to limit saltwater penetration in the estuary, conserve the remaining cypress, and promote the recovery of freshwater aquatic vegetation (e.g., Vallisneria) and other habitats important for estuarine species such as manatee and oysters. Design is ongoing and construction has not yet begun.
CERP Projects in Planning
Western Everglades Restoration Project
WERP (Figure 2-2, No. 16) is one of the few CERP projects that address ecological degradation in the western Everglades. WERP is intended to reestablish ecological connectivity of wetland and upland habitats, restore hydroperiods and predrainage distributions of sheet flow, restore low-nutrient conditions to reestablish native vegetation, and promote ecosystem resilience. The project footprint covers more than 1,200 mi2 of the western basin and includes Big Cypress National Preserve and lands of the Florida Seminole and Miccosukee Tribes (Figure 2-23). Planning for WERP started in August 2016 following discussions
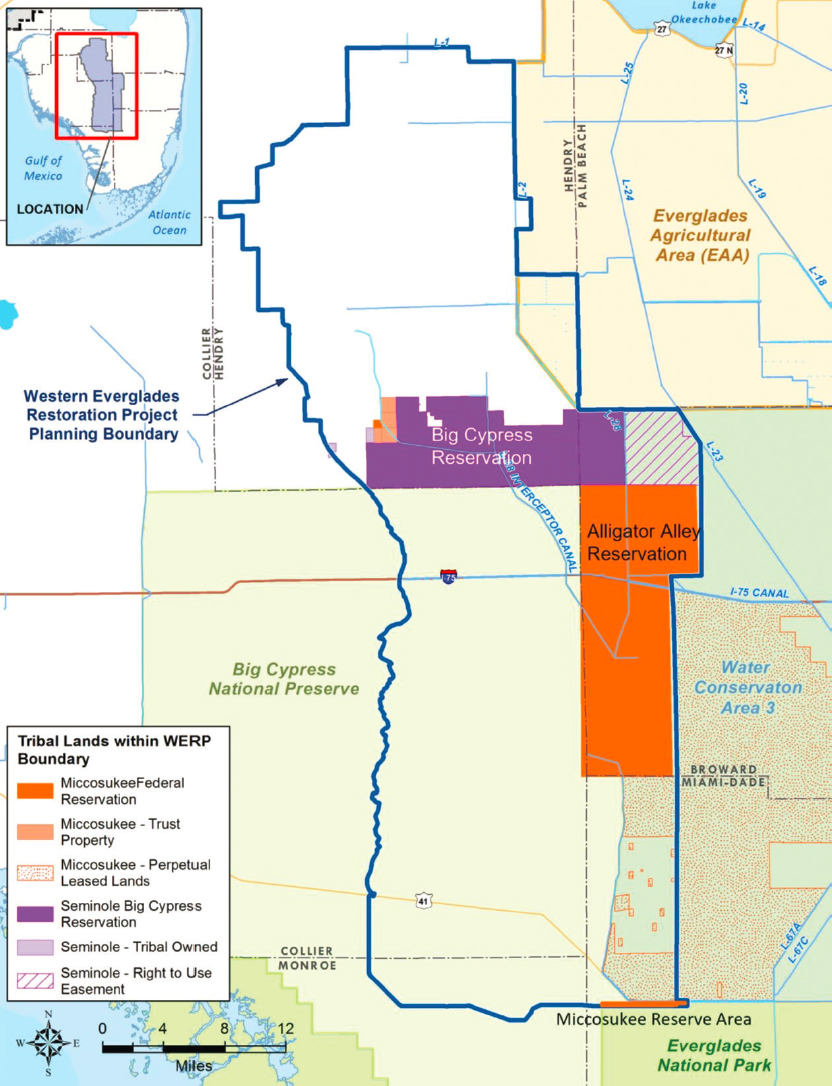
SOURCE: USACE and SFWMD, 2023a.
by a subgroup of the South Florida Ecosystem Restoration Task Force (Task Force) formed in response to concerns raised by the Seminole Tribe about lack of restoration progress in the western Everglades.
The planning process has been challenging. The initial preferred alternative—Alternative H (Alt-H)— was deemed not cost-effective. The high project costs, together with unmet need for an extensive real estate takings analysis, led to the suspension of WERP planning in 2019. Through strong stakeholder support, the planning was restarted and the project re-scoped, resulting in the Hybrid Revised Alternative (Alt-Hr), which included two STAs that were to cover nearly 7,500 acres and treat runoff entering the northern portion of the project area. Stakeholder objections to the placement of one STA in an area of remnant cypress led to further project revisions. Alternative Hybrid Natural Flow Revised (Alt-HNFR) was ultimately identified as the tentatively selected plan, and the draft PIR was released in December 2023 (USACE and SFWMD, 2023a). The recommended WERP plan is shown in Figure 2-24, although as of August 2024, the final draft PIR was not publicly available. Therefore, the following information is largely derived from the December 2023 draft PIR.
Within the northern portions of the recommended plan (Figure 2-24), several canals will be modified, and a variety of other structures including a weir, spreader canals, and culverts are designed to direct flows into the Seminole Big Cypress Reserve Native Area—an area of great cultural importance to the Seminole Tribe—and the Big Cypress National Preserve to rehydrate these areas. Better hydration in the Big Cypress National Preserve will help reduce the risk and severity of wildfires in the preserve. Further work is planned to restore vegetation in WCA-3A in an area currently dominated by cattail due to water quality impacts near the intersection of the L-28i and L-28N, within the Miccosukee Alligator Alley Reservation. The recommended plan (Figure 2-24) includes one STA to provide treatment for flows from the North Feeder subbasin and areas within the C-139 annex basin, with the objective of improving water quality conditions in the L-28N Canal. Water quality concerns in the West Feeder Basin (where an STA was eliminated in Alt-HNFR) will be addressed using a source-control approach through non-CERP components. Natural removal processes within the Kissimmee Billie Slough are also expected to reduce phosphorus concentrations. Upstream phosphorus levels must be addressed so that WERP does “not cause or contribute to water quality violations in Big Cypress National Preserve, the Seminole Tribe of Florida Reservation or other areas as determined by the regulatory agencies” (USACE and SFWMD, 2023a).
In the southern portion of the project area, portions of the L-28 Tieback and L-28S Canals will be filled; gated control structures will be built on L-28S to increase exchange between Big Cypress and WCA-3A; and culverts will be added beneath 11-Mile Road, US-41, and the Loop Road to enhance hydrologic
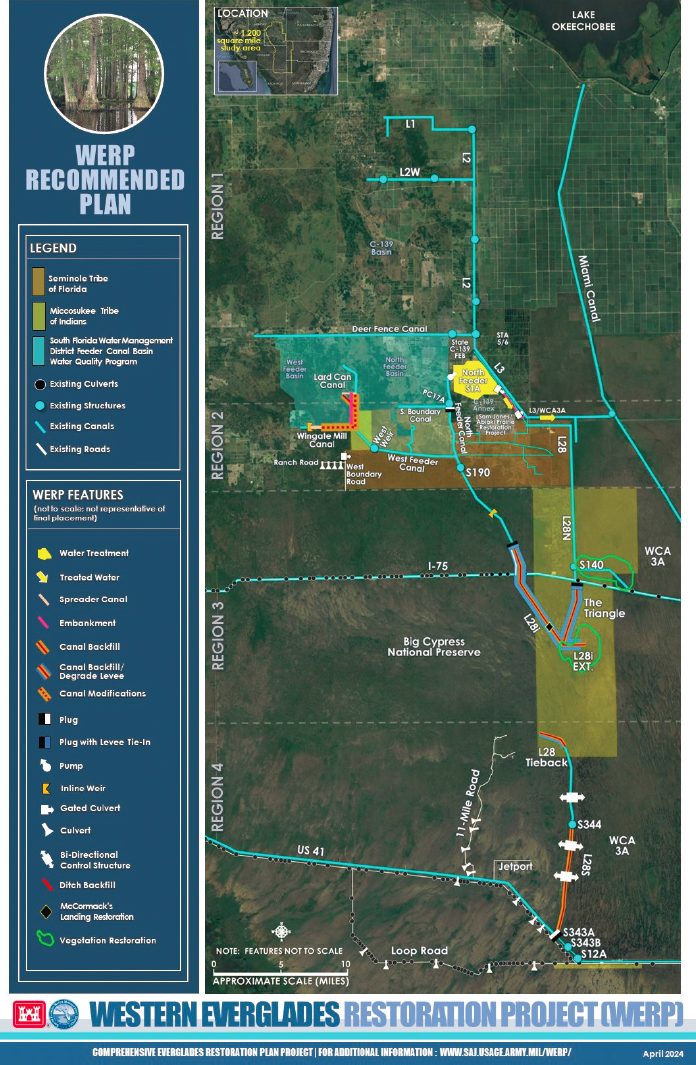
SOURCE: https://www.saj.usace.army.mil/WERP, accessed August 29, 2024.
connectivity and flows to the southwest, while protecting Tribal tree islands and camps. Overall, WERP features, if implemented as planned, should improve hydration, hydrologic and ecological connectivity, and water quality, which have been longstanding concerns in the WERP study area. The WERP Project Delivery Team has targeted September 2024 for a Chief’s Report, with the goal of authorization in WRDA 2024 (Velez, 2024).
The Adaptive Management Plan for WERP (Annex D of USACE and SFWMD, 2023a) identifies nine key uncertainties, monitoring plans, trigger points and or thresholds for management action, and potential management actions (see also Chapter 5). Continuous monitoring and assessment will enable a comparison between what is expected and actual system response, and in turn support an iterative process to guide subsequent management decisions and any needed improvements or adjustment to the current plan. In this regard, it is important that the WERP project team works closely with Miccosukee and Seminole Tribes to continue to refine performance measures and targets/trigger points based on Indigenous Knowledge (see also Chapter 3).
Water quality and WERP implementation dependencies.
The 2023 Draft PIR (USACE and SFWMD, 2023a) states that implementation of WERP and its project dependencies will occur in stages over approximately 10 years following authorization, starting with implementation of non-CERP best management practices (BMPs) on privately owned lands in contributing areas. The timely implementation of several WERP features, including modification of the Lard Can and Wingate Mill Canals, backfilling the L-28i and L-28i extension canals, and construction of the L-28i weir and plug, depends on achievement of water quality objectives. In the draft PIR, a “numeric planning placeholder” of 17 μg/L TP was used “for the area influenced by the WERP . . . West Feeder Project components,” assessed areawide as an annual geometric mean that must be met at least 2 of every 3 years. The PIR estimates that concentrations of 31–34 μg/L TP at the West Weir (Figure 2-24) would be sufficient to reach this 17 μg/L TP placeholder target in Big Cypress National Preserve, although additional studies are ongoing to establish baseline conditions, investigate appropriate targets, and determine the probable natural treatment likely to be afforded as the water travels through Kissimmee Billie Slough. By comparison, annual flow-weighted mean TP concentrations over the past 10 years at the West Weir have generally ranged between 40 μg/L and 90 μg/L (Figure 2-25; Wang and Mahmoudi, 2024). The proposed implementation schedule estimates a 7-year time frame for non-CERP water quality initiatives to meet these levels (USACE and SFWMD, 2023a).
In essence, much of the implementation of WERP features depends upon achievement of water quality objectives, with a 3- to 7-year time frame for non-WERP efforts to achieve their objectives before WERP implementation is delayed,
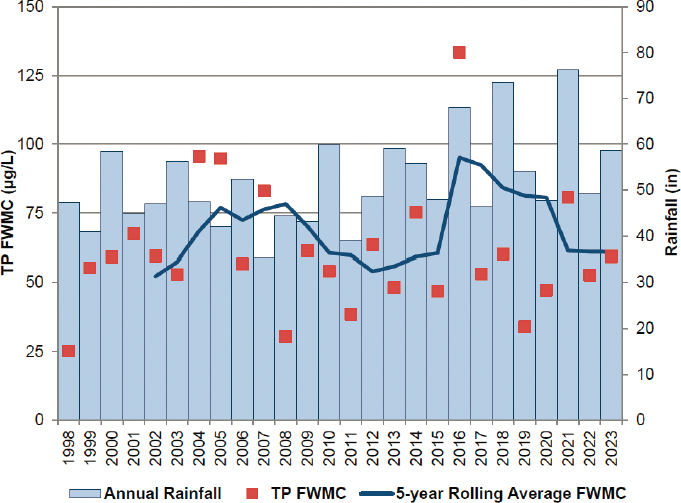
SOURCE: Wang and Mahmoudi, 2024.
depending on the WERP feature in question. An inherent assumption of this component is that BMP implementation will be accomplished as envisioned and as scheduled. Julian and Davis (2024) show potential reductions of 25-51 percent in flow-weighted mean TP concentrations associated with BMP implementation in the region compared to up to 73 percent reduction if an STA were included. However, the effectiveness of BMPs can vary substantially based on a variety of factors and with time (Ator et al., 2020; Gitau et al., 2005). Furthermore, BMP implementation often relies on a voluntary process, although Florida has regulatory processes that could be implemented if necessary. Initial voluntary and regulatory efforts will be reviewed approximately 3 years into the project with the plan to refine existing source control projects, initiate new projects, and/or move toward mandatory source control, if needed. A mandatory state source control program would incorporate water quality monitoring, data collection and analysis protocols, and compliance inspection, in addition to BMP selection, and its development is expected to take 3 to 5 years. Because of this dependence on the BMP component, there is the need to closely monitor BMP implementation and functionality, and consider alternate solutions as needed, to ensure timely WERP implementation.
Operation of gated culvert S-223 on Kissimmee Billie Slough.
As part of WERP features in Region 2 (Figure 2-24), a 180-cfs culvert (S-223) will be constructed and used to direct and control flows from the Kissimmee Billie Slough into the Seminole Big Cypress Reservation Native Area. The Seminole Tribe requested inclusion of gates in this structure, as well as to control structure operations using Indigenous Knowledge (Osceola, 2022; see also Chapter 3). Osceola (2022) explained:
Allowing Seminole Tribe ITEK [Indigenous Traditional Ecological Knowledge] to govern the operation of the gates will ensure that WERP provides environmental benefits in the Native Area. If the Seminole Tribe determines the water is fit to introduce to the Native Area, opening the gates will provide much needed restorative hydration. Alternatively, if the Seminole Tribe determines the water is unfit for the Native Area, closing the gates will provide environmental benefits by preventing potential harm to the Native Area.
Thus, the success of this part of this part of WERP will depend on water quality in the Western Basin. The WERP adaptive management plan includes a review of gate operations if the desired conditions are not met considering prevailing gate operations.4
Other issues that may impact progress.
There is concern that WERP-related increases in water levels will negatively impact areas occupied by endangered and threatened species, particularly the Florida panther (Puma concolor coryl). Although it historically occupied a vast area of the southern United States, stretching from Arkansas to the Carolinas, the panther now only exists as a single breeding/reproductive population, located south of the Caloosahatchee River. However, there has been recent documentation of panther activity north of the Caloosahatchee River, which could potentially signify population expansion north of the river (FWS, 2020). According to the draft PIR (USACE and SFWMD, 2023a), the North Feeder STA (Figure 2-24) will increase water levels in areas that are important to the Florida panther, including currently occupied areas and contiguous areas necessary for its long-term viability and persistence. The USACE Biological Assessment included in the draft PIR concluded that the project will not intersect any travel corridors and will, thus, not limit panther movement between areas south and north of the Caloosahatchee River. The 2024 Biological Opinion (FWS, 2024) outlined a plan for the USACE to use habitat units from the CERP Picayune Strand Panther Conservation Bank to offset losses due to the North Feeder STA with an anticipated 24,831 units needed. Concerns have also been raised about potential impacts on the panther’s primary prey, the white-tailed deer (Odocoileus virginianus) (FWS, 2020), whose survival is greatly impacted by water levels in the wet prairies (Bled et al., 2022;
___________________
4 A correction was made after the report was released to clarify the Seminole Tribe’s approach to gate operations.
MacDonald-Beyers and Labisky, 2005). MacDonald-Beyers and Labisky (2005) recommend that water rise no higher than 0.5 m (1.6 ft) to reduce deer mortality and improve its viability. Expected water levels fall within this recommended threshold. Analyses in the Biological Assessment (USACE and SFWMD, 2023a, Annex A) show that concerns about potential water level increases in the Wingate Mill and Lard Can Canal areas due to proposed canal modifications have been alleviated, and no adverse impacts are expected to the Florida Panther Conservation Bank as a result of WERP.
Risk of increased flooding due to WERP has been identified in the Feeder Canal and L-28 Gap basins. The Savings Clause (WRDA 2000, Section 601) requires that CERP projects maintain existing levels of flood protection (relative to time of CERP enactment) or work with affected landowners to mitigate the impacts of flooding. For western areas along L-28i, upstream of canal modifications, simulated ponding depths show an up to 70 percent probability of exceedance in wet years attributable to WERP. Model results suggest increased risk of flooding in areas immediately west of L-28i, including the Looneyville community (USACE and SFWMD, 2023a). Unless the plan is modified, this increase in flooding would necessitate solutions such as the raising of structures, perpetual flowage easements, or land acquisitions for impacted privately owned properties. More localized assessments will be conducted in the pre-construction engineering and design phase to better delineate areas and structures that might be impacted.
Lake Okeechobee Watershed Restoration Project
Located north of the lake, the LOWRP was designed to capture, store, and redistribute water entering the northern part of Lake Okeechobee. Its goals are to “improve water levels in Lake Okeechobee; improve the quantity and timing of discharges to the St. Lucie and Caloosahatchee estuaries; improve water supply for existing legal users of the Lake Okeechobee Service Area (LOSA); and increase the spatial extent and functionality of wetlands” (USACE, 2023b).
LOWRP planning has been actively ongoing since 2016. In November 2020 a revised final PIR was released with a draft report of the Chief of Engineers proposing a 46,000-AF above-ground water storage feature (termed “wetland attenuation feature”), 80 ASR wells, and approximately 4,800 acres of wetland restoration.5 Under a new administration, this plan was not approved by USACE headquarters “due in part to concerns raised by the Seminole Tribe of Florida” (USACE, 2024f) (see Chapter 3); the project was subsequently revised to remove the wetland attenuation feature and reduce the number of ASR wells
___________________
5 This sentence was updated after the report was released to accurately reflect the approximate acreage of wetland restoration.
to 55 (USACE and SFWMD, 2022a), but the wetland restoration component was retained. The 2022 PIR was not approved by USACE headquarters “due to concerns with risks posed by the ASR system and the increase in estimated costs” (USACE, 2024f). The planning team was then advised to reconfigure the tentatively selected plan to consider other storage alternatives, including those previously screened out. The team was also asked to “identify and investigate the feasibility of measures to quantify and mitigate potential health and environmental risks posed by ASR wells” and “specifically focus on determining uncertainties related to (1) well recovery performance, (2) water quality, (3) construction cost, and (4) O&M [operating and maintenance] costs” in coordination with the USACE Engineering Research and Design Center (USACE, 2024f).
In response, as of January 2024, the project was progressing on three fronts: (1) advancement of a draft PIR to authorize only the wetland restoration features of the original tentatively selected plan, (2) ongoing scientific research on ASR by both the USACE and the SFWMD, and (3) independent rescoping of the North of Lake Okeechobee Storage Reservoir by the SFWMD via the Section 203 process. Progress on these three fronts is discussed below.
Wetland restoration features.
In terms of progress on the first front, as of April 2024, no new revised LOWRP PIR has been publicly released that focuses only on the wetland restoration features. Presentations to the committee in January 2024 (Vega-Liriano, 2024) noted that the project team was modeling project benefits from ASR as well as the wetland restoration features for the PIR, even though the authorization would cover only the wetland restoration features. No analysis was being conducted to separate the benefits of the project component seeking authorization. As such, it may be difficult for Congress to evaluate the benefits of the wetland restoration features seeking authorization, especially if USACE headquarters has requested additional research to address ASR uncertainties before it would support full implementation of ASR. The USACE reported it was aiming for WRDA authorization in 2026 (G. Ralph, USACE, personal communication, 2024).6
Research to resolve concerns regarding ASR in the LOWRP.
Both the USACE and the SFWMD are conducting research on ASR to resolve critical uncertainties and inform the design of this storage component north of Lake Okeechobee. The 2021 ASR Science Plan (USACE and SFWMD, 2021) outlines a program of studies intended to inform phased implementation of 55 ASR wells within the LOWRP. This plan provides a comprehensive accounting of the numerous
___________________
6 The preceding paragraphs were updated after the report was released to accurately reflect the status of activities and plans at the time that the report was written.
uncertainties identified by NRC (2015) and summarizes 26 studies involving geochemical measurements, hydrogeophysical characterization, laboratory experiments, field testing of reactivated ASR wells, and clusters of new ASR wells to be located along the northern perimeter of Lake Okeechobee. The studies described in the 2021 ASR Science Plan are expected to be completed in 2030.
The 2022 ASR Science Plan (USACE and SFWMD, 2022b), developed under the guidance of an independent peer-review panel, is intended to serve as an update of the 2021 ASR Plan and was released in draft form in October 2022. The 2022 ASR Science Plan is organized around the following principal uncertainties identified in the 2015 NRC report: (1) project sequencing, (2) future construction and testing to evaluate aquifer properties, (3) understanding phosphorus reduction potential, (4) operations to maximize stored-water recovery, (5) disinfection and treatment of recharge and recovered waters, (6) ecotoxicology and ecological risk assessment, (7) water quality, and (8) ASR cost-benefit analysis (USACE and SFWMD, 2022b). Progress on the 2022 ASR Science Plan is discussed in Box 2-2.
North of Lake Okeechobee Storage Reservoir Section 203 study.
In a rapid planning effort started in April 2023 and led by the SFWMD, three above-ground storage alternatives, including previous and newly developed alternatives, were analyzed. By October 2023, a tentatively selected plan was identified for the North of Lake Okeechobee Storage Reservoir (also known as the Lake Okeechobee Component A Reservoir [LOCAR]). By February 2024, the SFWMD released the final feasibility study (SFWMD, 2024b), and the USACE released the final EIS (USACE, 2024c). The plan proposes a deep reservoir (average depth = 18 ft) that would add 200,000 AF of above-ground storage north of Lake Okeechobee. The reservoir is adapted from a design that was previously screened out in the LOWRP process (for more details, see Box 3-4; USACE and SFWMD, 2020b). The reservoir would contribute much needed storage to the CERP as described by the University of Florida Water Institute (2015) and NASEM (2016) at an estimated cost of $3.5 billion (SFWMD, 2024b).
Modeling for the project suggests that LOCAR will increase the percent of time that Lake Okeechobee spends within the preferred stage envelope (11.5–15.5 ft NGVD29) and the number of events of optimal flows to the Caloosahatchee and St. Lucie Estuaries. The analysis also showed an increase in the percent of time (to a small degree) when lake water levels are below preferred levels, potentially causing harm to the lake’s littoral zone. However, the comparisons against existing conditions can be difficult to interpret because the existing conditions baseline (ECB) and alternatives are modeled using the most recent LOSOM while the future without (FWO) uses the 2008 Lake Okeechobee Regulation Schedule (LORS); thus, the results are not solely demonstrating the
BOX 2-2
Progress on the 2022 ASR Science Plan
Progress documented within the 2022 ASR Science Plan includes collection of two continuous cores and vertically profiled groundwater samples under way as of October 2022. Analyses of the cores and groundwater are supporting several objectives, including the provision of information needed to develop and parameterize local-scale groundwater flow and solute transport models. These models will be used to inform decisions on well-cluster configuration and cycle testing, as well as improve understanding of water quality responses that occur as recharge water interacts with bedrock and mixes with native groundwater. Other progress has involved evaluation of the L-63N ASR facility for reactivation and refurbishment of the Kissimmee River ASR facility, as well as construction of new exploratory ASR and monitoring wells at C-38S and C-38N. While the L-63N and Kissimmee River ASRs are single-well systems, those constructed at C-38S and C-38N were completed as multi-well clusters. Once operational, hydrological observations from these ASR clusters can be used in conjunction with flow and transport models to evaluate alternative pumping scenarios with respect to their efficacy in maximizing freshwater-recovery efficiencies.
In addition to ASR well refurbishment and construction, a scope of work was developed for flow-through column experiments with portions of cores collected from C-38S and C-38N. The purpose of these experiments is to evaluate biofilm growth and potential for aquifer clogging that may arise from introduction of phosphorus-enriched surface waters. Other work during 2021-2022 focused on evaluation of alternative disinfection technologies. Disinfection is needed to comply with Florida Department of Environmental Protection and Environmental Protection Agency rules that require injected ASR waters to meet primary drinking-water standards. The report describing findings from five pilot-scale treatment trains is forthcoming and will inform selection of the treatment process employed in the initial ASR well clusters. Some attention has also been devoted to lowering uncertainties associated with ecotoxicology and ecological risk, although progress here has been limited to development of a scope of work for a quantitative ecological risk assessment, design of mobile-lab facilities to enable execution of bioaccumulation tests, and planning of ecological monitoring during cycle testing of new ASR wells along the C-38 Canal.
The USACE Engineering Research and Design Center has also been engaged to conduct research on ASR mobilization of hazardous contaminants, as well as develop cost estimates for construction and long-term operation and maintenance.
SOURCES: Caneja, 2024; USACE and SFWMD, 2022b.
effects of additional storage, but rather they illustrate the effects of storage addition coupled with Lake Okeechobee operational changes. Overall, however, the additional storage in the system should have positive effects, assuming reasonable operations (Julian and Reidenbach, 2024). Future studies will need to identify the system operations that work best with LOCAR as it comes online, similar to the LOSOM planning study.
Biscayne Bay and Southeastern Everglades Restoration
The freshwater and coastal wetlands and subtidal habitats of Biscayne Bay and the southeastern Everglades have been affected by over-drainage and by
damaging freshwater releases from canals. Specific problems that restoration goals aim to address include salinization and invasive plant encroachment of freshwater wetlands; reduction in near-shore estuarine habitat quality for aquatic organisms; degraded habitat near canal release points due to unnatural pulsed releases; and expansion of the “White Zone,” a zone of white marl soil, high soil saltiness, and low productivity between the freshwater and saline wetlands. The specific project objectives (USACE and SFWMD, 2020c) are to do the following:
- Improve freshwater wetland water depth, ponding duration, and flow timing within the Model Lands, Southern Glades, and eastern panhandle of Everglades National Park to maintain and improve habitat;
- Improve the quantity, timing, and distribution of freshwater to estuarine and near-shore subtidal areas, including mangrove and seagrass areas of Biscayne National Park, Card Sound, and Barnes Sound, to improve salinity regimes and to reduce damaging pulse releases;
- Improve ecological and hydrological connectivity between Biscayne Bay coastal wetlands, the Model Lands, and Southern Glades; and
- Increase resilience of coastal habitats in southeastern Miami-Dade County to sea-level rise.
The CERP planning constraints include not reducing flood protection (Savings Clause) while maintaining water deliveries to Everglades National Park, including Taylor Slough and Florida Bay.
The broad vision for the project included sourcing available water in the northern portion of the project footprint, conveying water through existing or new canals southeasterly through the center of the project area, and redistributing water to Biscayne Bay and southeastern Everglades wetlands (Figure 2-26). The project team has developed an array of project alternatives and as of May 2024 is in the process of comparing the outcomes with respect to nine performance measures,7 including one that considers coastal ecosystem resilience to sea-level rise (see Chapter 4, Box 4-1). The second and third rounds of alternative evaluations include an intermediate sea-level rise scenario of 1.6 feet over 50 years (USACE, 2019).
As of May 2024, the Project Delivery Team was completing its evaluation of Round 3 Alternatives, and a tentatively selected plan is expected for summer 2024. Key features for a tentatively selected plan include water sourcing from
___________________
6 The BBSEER performance measures are (1) near-shore salinity, (2) wetland porewater salinity, (3) water depth, (4) hydroperiod, (5) vegetation, (6) direct canal releases, (7) timing and distribution of flow sources to Biscayne Bay, (8) adaptive foundational resilience (see Chapter 5), and (9) connectivity between habitats (spatial extent of mangroves).
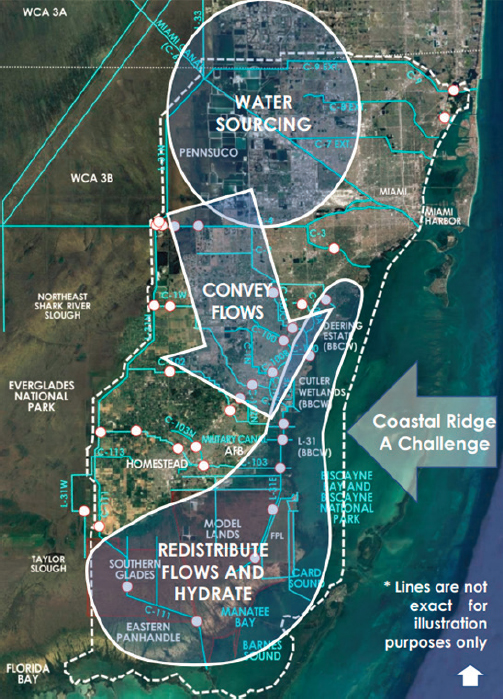
SOURCE: USACE and SFWMD, 2023b.
the northwest area, optimization of water volumes across the coastal ridge, maximum conveyance flexibility, and storage of enough water to rehydrate the largest extent of BBSEER’s target footprint. Because the analyses are ongoing, the committee did not review outcomes or the alternative selection process in detail.
NASEM (2023) noted that several of the performance measures are closely related to each other (e.g., near-shore salinity, wetland salinity, freshwater depth, hydroperiod, and timing and distribution of flow), such that the relative impact of other performance measures such as resilience and connectivity is likely diluted. The committee also recommended a nuanced approach to comparing alternatives including evaluating performance measures for each
habitat type, evaluating trade-offs among habitats, and weighting performance measures based on relative importance (NASEM, 2023). In subsequent analyses, alternatives have been evaluated by indicator regions and zone, which enable a comparison of impact among geographic areas and habitat types. However, it is not evident that performance measure weighting has been incorporated into the evaluation process. At this critical stage of selecting a tentatively selected plan, consideration of these recommendations may help the evaluation of alternatives that will improve ecological outcomes. Additional discussion on the analysis of sediment accretion in the BBSEER planning process is discussed in Chapter 4.
ISSUES THAT MAY IMPACT PROGRESS: WATER QUALITY
As discussed in NASEM (2023), progress in attaining adequate water quality in the STAs has important implications for CERP progress. Because the functioning of the STAs is impacted by upstream water quality, in this section the committee includes a discussion of water quality trends in the northern Everglades and Lake Okeechobee. Additionally, potential CERP effects on phosphorus loading and the ecosystem caused by the redistribution of water and increasing flow rates are discussed.
Water Quality in the Northern Everglades and Lake Okeechobee
TP loads into Lake Okeechobee continue to be highly variable and far in excess of the total maximum daily load (TMDL) target for the lake, with a mean of 518 tons (t) over the past 10 water years (2014–2023), which is 378 t above the 140 t TMDL target (Figure 2-27; Betts et al., 2024). In addition, TP concentrations in the lake water column have continued to remain well above the 40 μg/L goal (Havens and Walker, 2002), having stabilized the past few years at approximately 150 μg/L (Figure 2-28). This very high concentration continues to stimulate algal blooms in the lake, threatening the ecological health and recreational usage of the lake as well as affecting downstream water bodies, as they can “seed” blooms in those systems (Phlips et al., 2020).
The high nutrient concentrations leaving Lake Okeechobee have direct implications for both the STAs and the northern estuaries. In WY 2023, approximately 48 percent of the lake’s TP load discharges were to the south, ultimately reaching the STAs, making it more difficult to reach the stringent STA discharge targets. The Caloosahatchee and St. Lucie Rivers received 34 and 17 percent of the lake’s TP discharges, respectively (Betts et al., 2024). See NASEM (2018) for in-depth discussion of Lake Okeechobee water quality.

SOURCE: Betts et al., 2024.
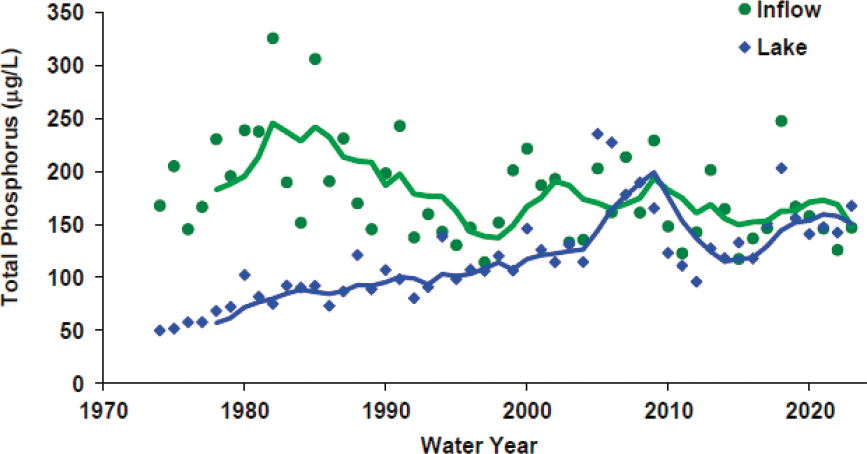
SOURCE: Betts et al., 2024.
A positive development in the monitoring of Lake Okeechobee is the expansion of phytoplankton sampling sites over the past 3 years; the number of fixed phytoplankton monitoring stations was increased from six year-round stations to nine stations during the dry season (November 1–April 30), and to 32 stations during the wet season (May 1–October 31). This expanded coverage has helped fill data gaps in lake response, which is important given the spatial heterogeneity of the lake (Carrick and Steinman, 2001). Because this expanded monitoring period includes only 3 years of monitoring, trend analysis is not appropriate. However, as shown in Figure 2-29, WY 2023 had not only a higher percentage of samples that met bloom conditions (defined as chlorophyll a concentrations > 40 μg/L) but also greater chlorophyll a concentrations than in the prior 2 years. At present, there is no clear evidence of improving water quality conditions in Lake Okeechobee.
Stormwater Treatment Areas
The STAs are critical components of Everglades restoration managed by the SFWMD, and they play major roles in reducing TP concentrations and loads from agricultural and urban runoff and Lake Okeechobee. The Everglades STAs are essentially constructed freshwater treatment wetlands built on acquired agricultural lands located north of the Everglades Protection Area (Figure 2-30). To protect the Everglades ecosystem, the construction and operation of STAs were mandated under the 1992 Consent Decree8 and subsequently by the Everglades Forever Act (Section 373.4592, Florida Statutes). A total of five STAs (STA-1E, -1W, -2, -3/4, and -5/6) with a combined treatment area of 62,000 acres have been built and have been operating over varying periods (Figure 2-30). Using interior levees, each STA is divided into multiple cells dominated by emergent aquatic vegetation (EAV), SAV, or a mixed marsh plant community, which includes both EAV and SAV in the same cell (Armstrong et al., 2023; Chimney, 2024). The STAs are spatially positioned along three flow paths: the Eastern Flow Path (STA-1E and STA-1W), the Central Flow Path (STA-2 and STA-3/4), and the Western Flow Path (STA-5/6) (Figure 2-30).
The Restoration Strategies Plan, launched in 2012, provides for expanding existing STA acreage and additional infrastructure improvements to meet the water quality–based effluent limit (WQBEL). The WQBEL requires that the annual flow-weighted mean outflow TP concentrations from each STA not exceed 13 μg/L in more than 3 out of 5 years (on a rolling basis) and not exceed 19 μg/L in any year (FDEP, 2012a,b). The Restoration Strategies Plan (SFWMD, 2012) included construction of approximately 6,500 acres of additional treatment
___________________
7 United States v. South Florida Water Management District, 847 F. Supp. 1567 (S.D. Fla. 1992).
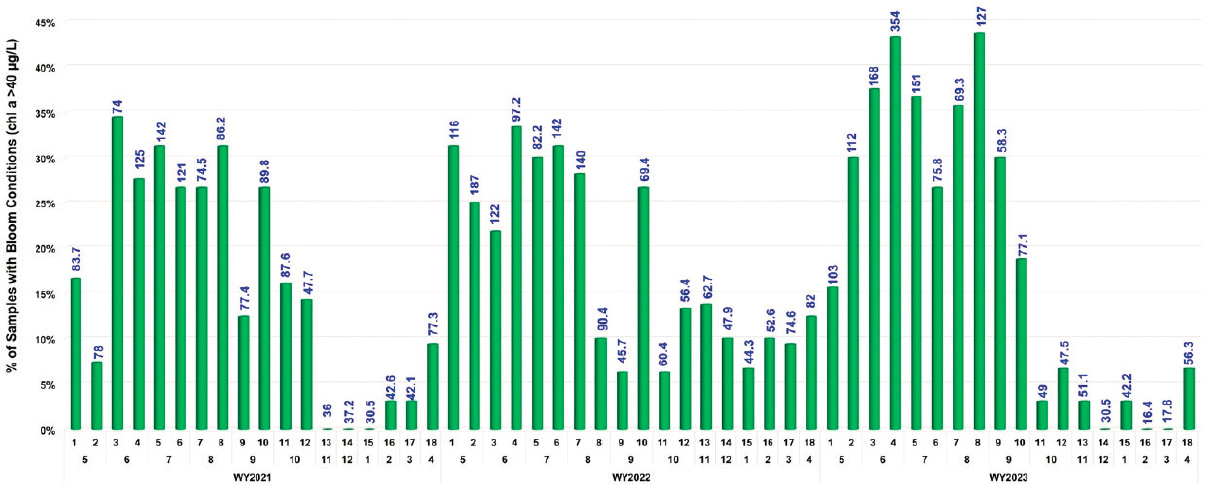
NOTES: Numbers in blue above the bars represent maximum chlorophyll a concentrations recorded during each sampling event. Numbers along the x-axis represent sampling events (1 through 18; top row), months (May–April; middle row), and water years (bottom row).
SOURCE: Betts et al., 2024.
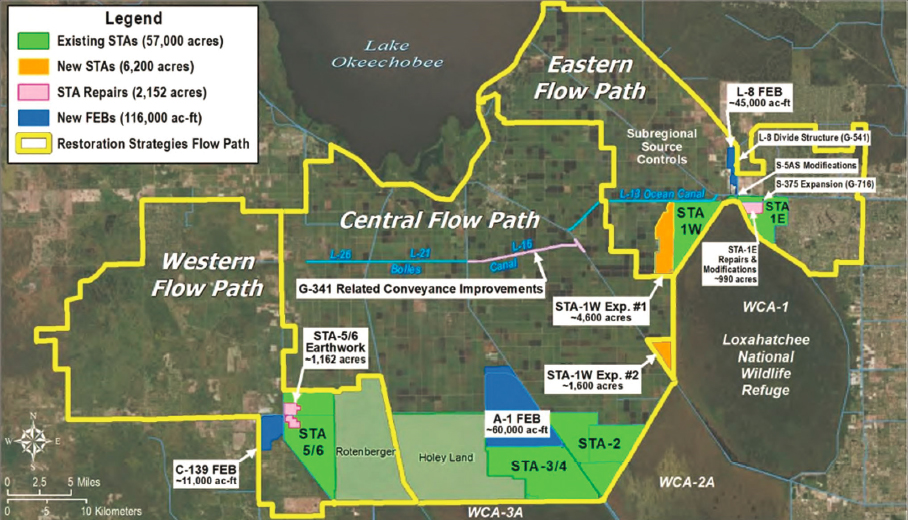
SOURCE: Shuford et al., 2024.
area, repairs to STA-1E and STA-5/6, and three flow equalization basins (FEBs) to moderate low and high flow conditions into the STAs (Figure 2-30). Restoration Strategies Plan projects are expected to be fully implemented and operational by December 31, 2025. The first year of discharge data to be incorporated into assessment of WQBEL attainment begins in WY 2027 (May 2026-April 2027). Progress on implementing the Restoration Strategies Plan is described in Table 2-6. Nearly all components of the original Restoration Strategies Plan have been completed as of early 2024, except the G-341 structure and subregional source controls in the Eastern Flow Path and internal improvements to STA-5/6 and full operation of the C-139 FEB in the Western Flow Path.
In NASEM (2023), the committee presented a detailed data analysis to determine the long-term performance of STAs during the operation period (WY 2004-2022). This analysis showed that high inflow TP concentrations coupled with high phosphorus loading rates are key external drivers of the overall performance and treatment efficiency of STAs. In this section, the committee briefly updates that review based on data focused on the recent 5 water years
TABLE 2-6 Summary Status of Major Restoration Strategies Projects
| Component | Purpose | Status |
|---|---|---|
| Eastern Flow Path | ||
| L-8 FEB | Attenuate flow into STA-1E and STA-1W | Construction completed in 2017, now operational |
| L-8 Divide Structures (G-716, G-541) | Assist movement of inflows and outflows to L-8 FEB | Construction completed in 2016, now operational |
| STA-1E Repairs and Modifications | Improve STA performance | Construction completed in 2022, now operational |
| STA-1W Expansion # 1 (Phase 1) | Increase STA-1W effective treatment area | Construction completed in 2019, now operational |
| STA-1W Expansion # 2 (Phase 2) | Increase STA-1W effective treatment area | Construction in progress. The initial flooding and optimization period will be complete in December 2024 |
| G-341 Related Improvements | Divert flows (600 cfs max) to the west | Construction completion is expected in December 2024 |
| Subregional Source Controls | Reduce inflow loads from hotspots in the basin | Pilot projects completed in 2015 and 2017; conceptual project planning ongoing |
| Central Flow Path | ||
| A-1 FEB | Attenuate flow into STA-2 and STA-3/4 | Construction completed in 2015, now operational |
| STA-2 Expansion: Compartment B | Increase STA-2 effective treatment area | Cells 7 and 8 completed in 2013, now operational |
| Western Flow Path | ||
| STA-5/6 Internal Improvements | Improve the performance of STA-5/6 | Construction completion is expected in December 2024. Initial flooding and optimization are expected to be complete in December 2025 |
| C-139 FEB | Attenuate flow into STA-5/6 | Construction completed in 2024. The operational monitoring and assessment period is expected to be completed by December 2024 |
SOURCES: Data from Chimney, 2024; Shuford et al., 2024.
(WY 2019–2023). During this period, all STAs were affected by extreme events, including hurricanes, regional droughts, and continued changes in the operation and maintenance of STAs.
Status of STAs in WY 2023
NASEM (2023) provided a detailed analysis of STA treatment performance, so this section provides an update based on new information (i.e., WY 2023 data)
since that report was released. In WY 2023, several STA flow-ways were offline for maintenance or refurbishments, reducing the effective treatment areas. For example, in WY 2023, only 59 and 60 percent of STA-1E and STA-3/4 treatment areas were online, respectively (Chimney, 2024), so STA performance should be evaluated in that context.
Table 2-7 provides an overview of STA performance in WY 2023 as well as performance over the period of record. Overall phosphorus concentration-based treatment efficiencies in the STAs were high compared to other constructed wetlands; however, within the STAs, STA-2 (74%) and STA-1E (77%) underperformed compared to the 83 to 90 percent TP treatment efficiencies attained in the other STAs. STA-3/4, with a mean TP outflow concentration of 16 μg/L, was the only STA to meet the upper WQBEL discharge concentration limit (19 μg/L) in WY 2023.
Performance of STAs in the Eastern Flow Path (STA-1E and STA-1W).
Inflows to STAs in the Eastern Flow Path (STA-1E and STA-1W) are derived from C-51, L-8, and S-5A basins and during dry season regulatory releases from Lake Okeechobee (Chimney, 2024). Basin runoff can be stored in the L-8 FEB for a short period and discharged into both STAs.
In recent years, inflow TP concentrations to STA-1E have notably decreased as have TP loading rates (Figures 2-31 and 2-32), although the TP loading rate for WY 2023 (1.5 g/m2-yr) was still 50 percent higher than that of the other STAs (Table 2-7, Figure 2-32). Construction activities in STA-1W previously diverted inflow water to STA-1E starting in WY 2021, which exacerbated TP and hydraulic loading (Figure 2-32; Chimney, 2022). Even though 40 percent of the treatment area of STA-1E was offline during WY 2023, recent reductions in both hydraulic and TP loading rates helped increase the load-based treatment efficiency from 79 percent over the period of record to 82 percent in WY 2023, with an outflow TP concentration of 26 μg/L (Chimney, 2024). Further reductions are expected once refurbishment activities are completed and 100 percent of the treatment area is available, although substantial reductions are needed to meet the 13 μg/L lower WQBEL limit.
In STA-1W, the average inflow TP concentration of 199 μg/L (WY 2023) was 86 percent higher than average inflow TP concentrations of STA-1E, -2, and -3/4 (Table 2-7 and Figure 2-31). STA-1W Expansion #1, which increased the effective treatment area by 4,266 acres (to 10,810 acres), was completed in WY 2021. Since that time, TP loading rates have decreased to below 1 g/m2-yr, a threshold that has been judged to be important to support effective STA performance (NASEM, 2023; see Figure 2-32). Over the same time, outflow TP concentration steadily decreased from 38 μg/L (WY 2021) to 20 μg/L (WY 2023), indicating a positive trajectory toward meeting water quality goals with an impressive
TABLE 2-7 Select Water Quality Parameters for Five STAs During the Operation Period of WY 2023 (May 1, 2022 to April 30, 2023) and the Period of Record of Operation
| Parameters | Eastern Flow Path | Central Flow Path | Western Flow Path | ||
|---|---|---|---|---|---|
| STA-1E | STA-1W | STA-2 | STA-3/4 | STA-5/6 | |
| Total area, acres (adjusted treatment area, acres) | 4,994 | 10,810 | 15,495 | 16,327 | 14,388 |
| (2,980) | (10,810) | (13,121) | (9,851) | (13,728) | |
| Treatment cells per STA | 8 | 10 | 8 | 6 | 14 |
| % of treatment area online in WY 2023 | 59 | 100 | 85 | 60 | 96 |
| Inflow, WY 2023 | |||||
| Water volume (x1,000 AF) | 124 | 152 | 327 | 327 | 153 |
| Hydraulic loading rate (cm/day) | 3.5 | 1.2 | 2.1 | 2.8 | 0.9 |
| TP FWM concentration (μg/L) | 115 | 199 | 113 | 93 | 288 |
| TP loading rate (g/m2-yr) | 1.5 | 0.9 | 0.9 | 0.9 | 1.0 |
| TP load (t) | 18 | 37 | 45 | 38 | 54 |
| Outflow, WY 2023 | |||||
| Water volume (x1,000 AF) | 101 | 158 | 349 | 307 | 148 |
| TP FWM concentration (μg/L) | 26 | 20 | 29 | 16 | 40 |
| Phosphorus discharge rate (g/m2-yr) | 0.3 | 0.1 | 0.3 | 0.1 | 0.1 |
| TP load (t) | 3 | 4 | 13 | 6 | 7 |
| Treatment Efficiency, WY 2023 | |||||
| Treatment efficiency (%) (TP concentration basis) | 77% | 90% | 74% | 83% | 86% |
| Treatment efficiency (%) (TP load basis) | 82% | 89% | 72% | 84% | 87% |
| Period of Record | |||||
| STA start date | Sept. 2004 | Oct. 1994 | June 1999 | Oct. 2003 | Dec. 1997 |
| Approximate years of operation | 19 | 29 | 24 | 20 | 25 |
| Inflow TP FWM concentration (μg/L) | 160 | 181 | 101 | 101 | 200 |
| Outflow TP FWM concentration (μg/L) | 37 | 44 | 22 | 15 | 63 |
| Treatment efficiency (%) (TP concentration basis) | 77% | 76% | 78% | 85% | 69% |
| Long-term TP inflow loads (t) | 491 | 1,108 | 856 | 1,069 | 842 |
| Long-term TP outflow loads (t) | 104 | 277 | 196 | 163 | 245 |
| Long-term TP retention (t) | 387 | 831 | 660 | 907 | 597 |
| TP treatment efficiency (%) (TP load basis) | 79% | 75% | 77% | 85% | 71% |
NOTES: FWM = flow-weighted mean. Conversion factors are 1 acre = 0.4047 hectares (4,047 m2); 1 AF = 1,234 m3; 1 metric ton = 1,000 kg; 1 cm per day = 0.3937 inches per day.
SOURCE: Modified from Chimney, 2024, with additional analysis of treatment efficiency from the committee.
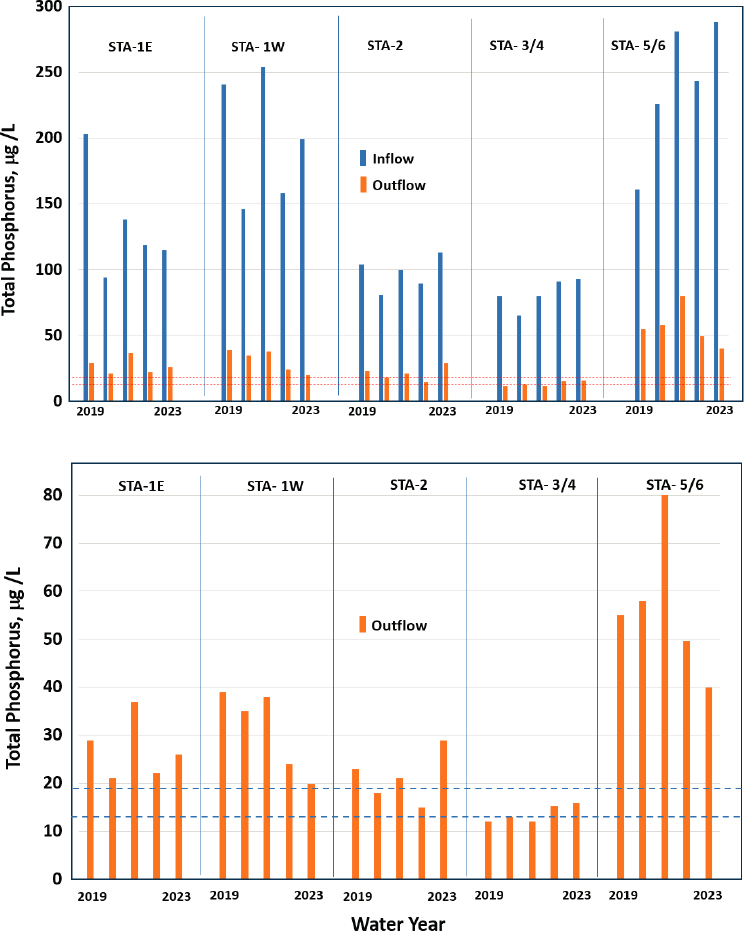
NOTE: Red dashed lines represent lower (13 mg/L) and upper (19 mg/L) TP concentration limits set by the WQBEL.
SOURCES: Data from Chimney, 2020, 2021, 2022, 2023, 2024.
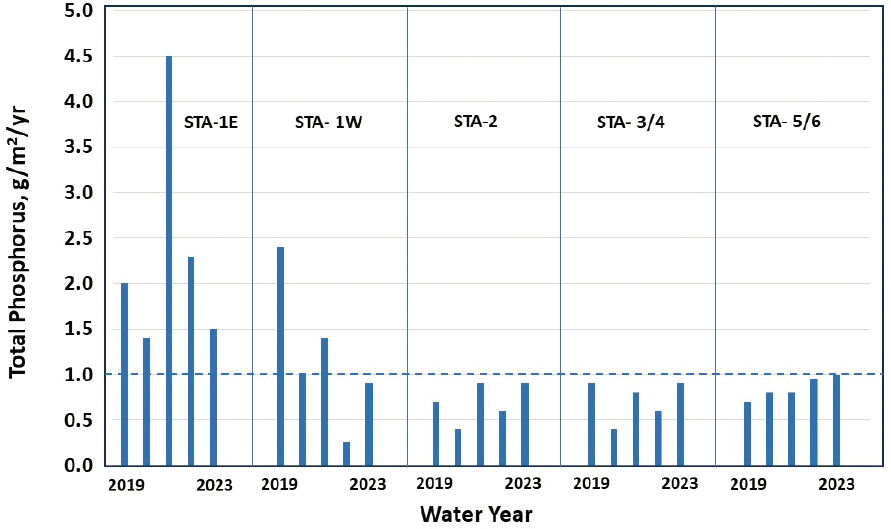
SOURCES: Data from Chimney, 2020, 2021, 2022, 2023, 2024.
89 percent load-based treatment efficiency (Figure 2-31; Table 2-7). The addition of STA-1W Expansion #2, which will provide an additional 1,600 acres of treatment area (Shuford et al., 2024), is expected to decrease outflow TP concentrations further and bring STA-1W closer to meeting WQBEL requirements.
Performance of STAs in the Central Flow Path (STA-2 and STA-3/4).
STA-2 and STA-3/4 receive agriculture runoff from EAA basins and releases from Lake Okeechobee. Inflow TP concentrations to STA-2 and STA-3/4 have been significantly lower than those to the other STAs, both recently and over the period of record (Chimney, 2024), which eases the challenge of attaining the WQBEL. The Restoration Strategies Plan in the Central Flow Path included the A-1 FEB and STA-2 Expansion (see Table 2-6; Shuford et al., 2024).
Substantial refurbishment and vegetation management was under way in STA-2 during WY 2023, with one of five flow-ways (equal to 15 percent of the treatment area) offline the entire year. Despite a low TP loading rate (0.9 g/m2-yr), outflow TP concentrations increased from 15 μg/L to 29 μg/L from WY 2022 to
WY 2023 (Figure 2-31 and Figure 2-32), and load-based treatment efficiency decreased to 71 percent compared to its long-term average of 77 percent; this increase may be due to short-term effects of disturbance in the flow-ways, but it is important to understand the causative factors to mitigate these effects in the future if necessary.
STA-3/4 maintained ultra-low outflow TP concentrations (12 to 16 μg/L) during the recent 5 water years (WY 2019–2023) and met the WQBEL requirements during this period. During WY 2019 to WY 2021, STA-3/4 maintained outflow TP concentrations of 12 to 13 μg/L. In the most recent 2 years, outflow TP concentrations increased to 15 to 16 μg/L, likely because 40 percent of STA-3/4 was offline during WY 2022 and WY 2023 for vegetation management, but STA outflows remained within WQBEL requirements (Figure 2-31; Chimney, 2024).
The low inflow TP concentrations and phosphorus loading rates for STA-2 and STA-3/4, combined with vegetation rehabilitation in both STAs, should help improve performance and maintain low outflow TP concentrations. In addition, A-1 FEB benefits both STAs with short-term storage of runoff water and attenuation of peak inflows to improve overall treatment efficiency.
Performance of STAs in the Western Flow Path (STA-5/6).
Throughout the period of record, STA-5/6 has received inflows with extremely high TP concentrations; inflow TP concentrations in WY 2023 were 170 percent higher than average inflow TP concentrations of STA-1E, -2, and -3/4 (Figure 2-31). STA-5/6 also has the lowest load-based treatment efficiency (71 percent) over the period of record (Table 2-7). During the past 5 water years, this STA has had a TP loading rate at or below 1.0 g/m2-yr, and outflow concentrations have been declining over the latest 3 years but remain well above the target WQBEL concentrations (Figures 2-31 and 2-32). Elevated outflow TP concentrations, in spite of low phosphorus loading rates, suggest that legacy phosphorus offsets a portion of phosphorus removal occurring in the system, likely during periods of drydown and reflooding. During the past 5 years, STA-5/6 has functioned at a concentration-based treatment efficiency that ranged from 66 percent in WY 2019 to 86 percent in WY 2023.
Restoration Strategies projects for STA-5/6 include the C-139 FEB completed in 2024 with capacity to store 11,000 AF of water and internal improvements (Table 2-6; Shuford et al., 2024). The C-139 FEB, when fully operational, can provide additional water to hydrate STA-5/6 and reduce dry conditions. Additionally, as part of STA refurbishment efforts, the SFWMD is planning to develop a project that includes infrastructure to move Lake Okeechobee water to STA-5/6. This project is currently in design phase and, when completed, will move up to 300 cfs as part of regulatory releases from Lake Okeechobee to the STAs, which will help to rehydrate during dry conditions and improve treatment performance
(T. Piccone, SFWMD, personal communication, 2024). Implementing these strategies should help reduce outflow TP concentrations.
Overall Assessment and Path Forward
The SFWMD has clearly made important strides in the cumulative performance of the STAs during the recent 5-year period, with efforts to reduce the average phosphorus and hydraulic loading rates of the STAs to improve performance. The recent 5-year average outflow TP concentration of STA-3/4 is already meeting the WQBEL. All other STAs are moving in a positive trajectory through Restoration Strategies actions to reduce outflow TP concentrations. Attaining the WQBEL for outflow TP concentration depends on how well these STAs respond to Restoration Strategies, ongoing vegetation management, and soil management (as needed), to reduce TP concentrations. NASEM (2023) highlighted the importance of timely attainment of the WQBEL in order to avoid delay of restoration benefits from the CEPP. Benefits that depend on STA performance include full water deliveries from the EAA Reservoir. NASEM (2023) also noted the challenges associated with attaining and maintaining the WQBEL over time in all STAs and recommended the best available science and monitoring in an adaptive management framework to address these challenges.
In 2012 the SFWMD developed the Restoration Strategies Science Plan and updated it in 2018 in collaboration with outside consultants, governmental agencies, and universities (James et al., 2024a). Research conducted under the Restoration Strategies Science Plan was extensively published in reports and peer-reviewed journals, including an Everglades STAs special issue published in 2024 in the journal Ecological Engineering (Chimney, 2024; James et al., 2024b; Reddy et al., 2024). Many of these studies are useful in understanding the role of external and internal drivers in regulating hydrologic and biogeochemical processes that influence outflow TP concentrations in the STAs.
NASEM (2023) provided several recommendations on science to support STA management and decision making, related to, for example, monitoring, setting near-term milestones, assessment, modeling, research, and synthesis. It is important to extract management-specific information from the Restoration Strategies Science Plan and other new studies for possible immediate applications to support WQBEL attainment and to guide each STA in improving long-term sustainability. The committee reemphasizes the need for cell-by-cell monitoring of TP concentrations to better understand treatment efficiency. It is well known that phosphorus removed in STAs is retained in soils (long term) and in vegetation (short term). Soil and organic matter accretion and its physical and biogeochemical stability need to be determined under different biogeochemical
and hydrologic conditions to understand the long-term sustainability of STAs and their capacity to provide steady performance (NASEM, 2023).
Biogeochemical Dynamics with Increased Flow in the Everglades
The structure and function of the Everglades ecosystem is predicated on oligotrophic conditions. Nutrient management in the Everglades Protection Area has been focused on meeting the phosphorus criteria established in 2003, including 10 μg/L as a long-term geometric mean.9 With CERP restoration activities, a critical question is “How will the Everglades ecosystem and its biogeochemical processes respond to increasing flows and hydroperiods?” A suite of interrelated processes could affect ecosystem conditions: (1) increased TP loading associated with increases in flows, regardless of TP concentrations (i.e., including <10 ppb); (2) increased sheet-flow velocities leading to enhanced suspension and transport of sediment-associated phosphorus; (3) new canal-to-marsh pathways that could exacerbate phosphorus loading into unimpacted marsh areas via scour and transport of stored sediments; and (4) mobilization of legacy phosphorus in wetland soils associated with increases in reducing conditions. Characterization and quantification of changes in the transport and processing of nutrients following restoration efforts will be an important endeavor to mitigate against undesirable consequences. Several of these potential mechanisms are highlighted in the recent developments discussed in this section.
Changing Water Quality Dynamics in the Central Everglades
In general, there is a north-to-south gradient in TP concentrations in the Everglades Protection Area that results from an elevated supply of phosphorus from waters draining the EAA and urban areas followed by transport and removal by sedimentation, sorption, and assimilation within the wetlands. The spatial pattern is also characterized by higher TP concentrations along canals and lower concentrations in the interior marsh. Of the interior marsh sites, 85 percent
___________________
8 Florida has a narrative surface-water quality criterion to ensure that nutrient concentrations will not be altered as to cause an imbalance in natural populations of aquatic flora or fauna. The narrative nutrient criterion was numerically interpreted for phosphorus in the Everglades in FAC §§62-302.530 (see also Rizzardi, 2001). For Class III waters in the Everglades Protection Area, a four-part test is used to assess compliance with the numeric phosphorus criterion following four provisions: (1) 5-year geometric mean is less than or equal to 10 ppb, (2) annual geometric mean averaged across all stations is less than or equal to 11 ppb, (3) annual geometric mean averaged across all stations is less than or equal to 10 ppb for 3 of 5 years, and (4) annual geometric mean at individual stations is less than or equal to 15 ppb (FAC §§62.302.540). Achievement of the criterion in Everglades National Park is governed by methods in Appendix A of the 1992 Consent Decree (see SFWMD [2009] for details).
exhibited annual geometric mean TP concentrations of 10 μg/L or less (Lopez et al., 2024). The spatial and temporal patterns of changing TP concentrations along the gradient from north to south are highlighted in Figure 2-33. The period of record has seen marked decreases in TP concentrations in inflow waters to the WCAs and within the interior marsh sites of the Everglades Protection Areas. Over the more recent interval (WY 2005-2023), TP concentrations have continued to decrease in inflows to Arthur R. Marshall Loxahatchee National Wildlife Refuge and WCA-2, but over the past 10 years, inflow concentrations appear to have increased slightly to WCA-3 and Everglades National Park. Increases in flow volumes over the past decade have also resulted in notable increases in TP loadings to Everglades National Park and slight increases in TP loadings to WCA-3A (Figure 2-33; statistical significance not available for this time frame).10
Recent observations indicate that processes beyond increases in the quantity of water discharge contribute to increases in TP loading and availability. The COP EIS (USACE, 2020a) presented concerns that TP concentrations increase at lower water stages (<9.2 ft), affecting concentrations and loads delivered to Everglades National Park (Figures 2-34 and 2-35). The increases in annual TP load delivered to Shark River Slough through the S-333s at lower water stages compared to past operational plans are evident in Figure 2-35. This pattern has become particularly pronounced since 2018 (Figures 2-33 and 2-35) under COP operations and the incremental testing period, which has been coincident with multiple exceedances of the Consent Decree Appendix A compliance long-term limit (Mo et al., 2022, 2024). The S-333 Working Group (2023) noted that as water levels in the marsh decrease during the dry season, water transport toward the S-333 becomes canal-dominated, “with higher TP concentrations than those observed in the marsh.”
In response to concerns by the Consent Decree principals that the observed increases in TP concentrations to Shark River Slough resulted from local sources and phenomena, the S-333 Working Group was established to evaluate this condition and recommend approaches to decrease TP loading. The S-333 Working Group (2023) found that more than 10,500 cubic yards of phosphorus-laden sediments have accumulated in the canals immediately upstream of S-333, and this material could be an important source of phosphorus if entrained and transported downstream (Figure 2-36). Hydrodynamic modeling suggested that flow velocities could become high enough to entrain surface sediments in the L-29 and L-67 Canals and enhance TP transport to Everglades National Park. In response to this analysis, the Consent Decree principals proposed dredging 1,500 linear ft of L-29 and L-67 Canal sediments immediately upstream of the
___________________
9 A correction was made after the report was released to clarify the data considered in this assessment of trends and to correct the magnitude of trends observed.
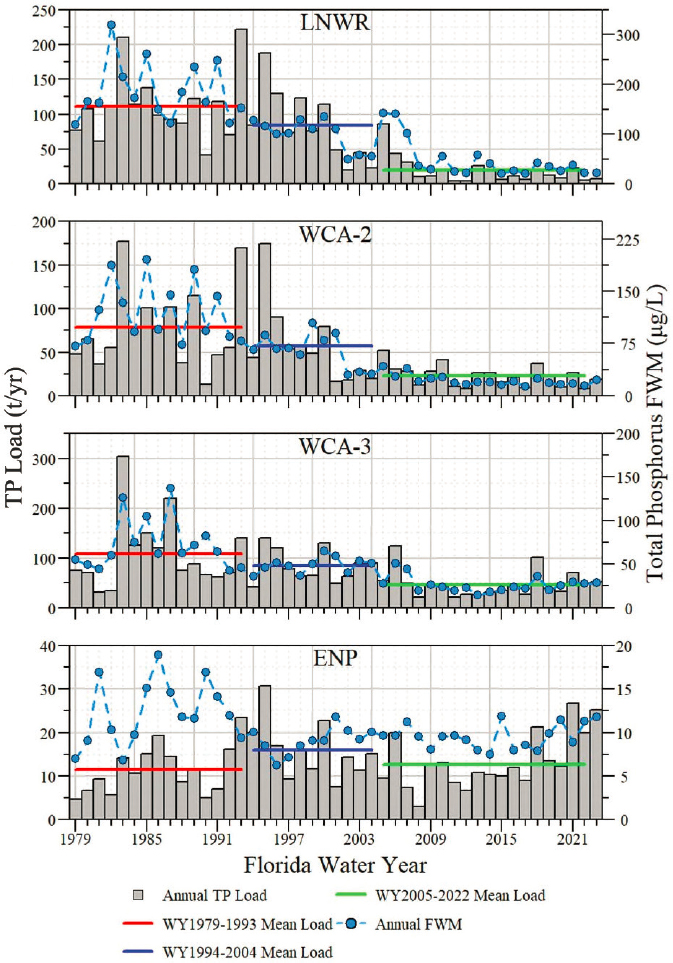
NOTE: The horizontal lines indicate the mean annual loads for the Baseline (WY 1979–1993), Phase I (WY 1994–2004), and Phase II (WY 2005–2022) periods.
SOURCE: Lopez et al., 2024.
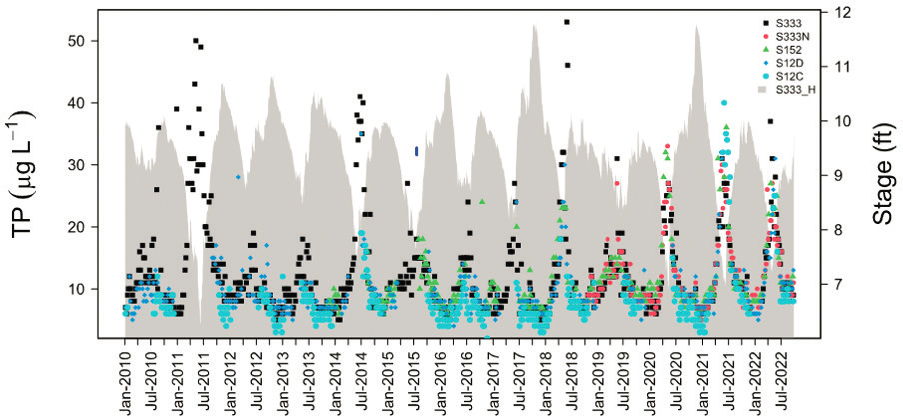
NOTES: Data were secured from DBHYDRO, the environmental corporate database of the SFWMD. Concentrations of TP increase with low flow conditions.
SOURCE: S-333 Working Group, 2023.
S-333 complex and installing low-sill weirs upstream of the S-333s to reduce canal velocities and bedload transport. Completion of this project is estimated for 2026 (Hutchins, 2024). Monitoring will be conducted to evaluate the effectiveness of these actions, identify opportunities to continue to mitigate TP loading to Everglades National Park, and inform future management actions (Bartlett et al., 2023). Depending on the results of these initial actions, the S-333 Working Group (2023) noted that further work could be warranted, including a comprehensive study of an expanded portion of the canals and marsh within WCA-3A area upstream of the S-333s to determine the dominant sources (sediment, floc, and suspended in the water column) of phosphorus and the mechanisms by which these materials are contributing to TP loading to Everglades National Park.
Biogeochemical Dynamics in the Decomp Physical Model and CEPP South
The potential for enhanced transport of previously deposited phosphorus along canals or in wetland sediments has been illuminated from work in the Decomp Physical Model (DPM), with important implications for CEPP South.

NOTE: Top graph shows the distribution of all data, while the bottom graph shows the distribution of TP loads by stage bins.
SOURCE: D. Surratt, National Park Service, personal communication, 2024.
One of several unanticipated outcomes of DPM was that high velocity inflows with low surface-water concentrations of TP (i.e., ≤10 μg/L TP) produced phosphorus-impacted conditions downstream because of transport of phosphorus-enriched sediments and increased loads to the previously unimpacted area. This change resulted in the loss of the slough periphyton community and invasion of cattails (Saunders, 2020; Saunders et al., 2016, 2021; Sklar, 2020). Cattails continue to spread downstream within WCA-3B toward the L-29 Canal and Everglades National Park at a rate of 100 m/yr (Saunders and Newman, 2023). Ongoing work to address this issue in an adaptive management framework is discussed in more detail in Chapter 5.
Long-Term Monitoring Trends and Data Issues
Observations of TP concentrations from the Florida Coastal Everglades Long-Term Ecological Research program (FCE LTER) may yield important insight on
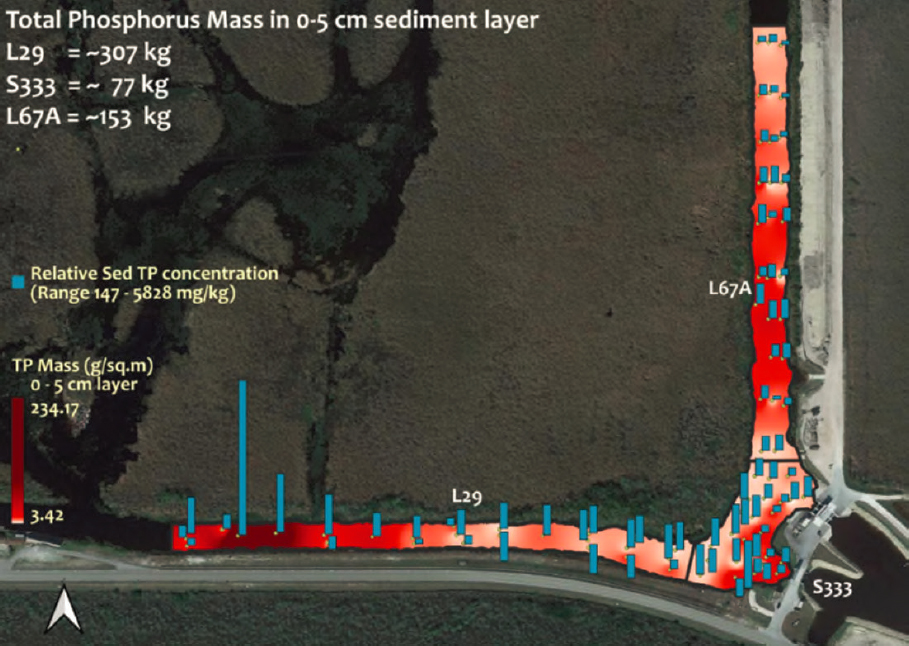
NOTES: The height of each bar represents relative TP concentration for the sampling location in grams per square meter (g/m). TP mass (kg) contained in sediment surface (0-5 cm) in the L-29 Canal, near the S-333 structure, and the L-67A Canal are also indicated. Note the elevated concentrations of TP in sediments, particularly in the L-29 Canal.
SOURCE: S-333 Working Group, 2023.
phosphorus dynamics in the Everglades in response to increases in discharge. The FCE LTER has established long-term monitoring stations in Shark River Slough and Taylor Slough along transects from the headwater reaches of Everglades National Park through the mangroves and into Florida Bay. The FCE LTER observed increasing trends in TP concentrations over the past decade in wetlands in Shark River Slough and Taylor Slough. However, this pattern of increasing TP concentrations in water grab samples is inconsistent with observations reported for nearby sites by the SFWMD, which do not show temporal trends (Gaiser, 2023; Figure 2-37).
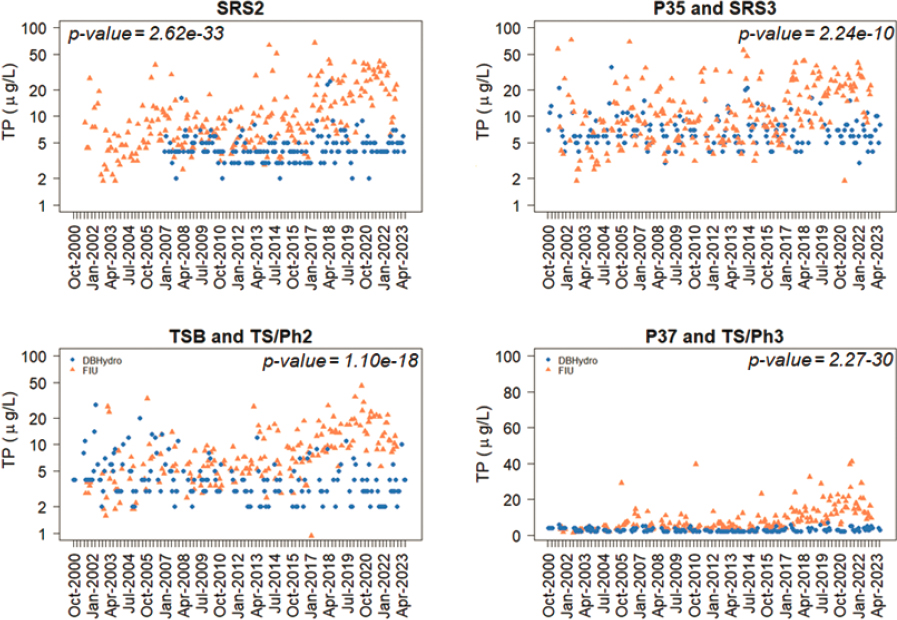
NOTE: The FCE LTER observations show an increase in TP concentrations in recent years, while the SFWMD samples do not.
SOURCE: C. Gauthier, NPS, personal communication, 2024.
The FCE LTER and Everglades National Park are collaborating to understand the reason for this discrepancy in temporal trends. They have collected and analyzed paired samples using their standard methods and compared results, which show no differences due to sample collection procedures or analytical methods. They continue to investigate whether this discrepancy is due to differences in locations or daily timing of sample collections or methods of preservation.
The FCE LTER has also been collecting two types of water samples since the early 2000s: 3- to 6-day integrated, diurnal sequential samples and daytime grab samples. Interestingly, TP concentrations in diurnal composite samples are considerably greater than values in grab samples. The reason for this discrepancy between the two sampling approaches is not clear but could potentially
indicate potential night-time mobilization of phosphorus under fluctuating redox conditions. FCE LTER personnel are examining potential diurnal patterns in phosphorus in Everglades National Park to better understand the reason for different results from differences in sampling or processing approaches.
Implications for Research
Although the patterns of TP concentrations need to be fully understood and verified given the inconsistency between FCE LTER and SFWMD observations, the temporal pattern of increasing phosphorus observed in Shark River Slough and Taylor Slough coupled with the S-333 Working Group and DPM observations may suggest an emerging pattern of changes in phosphorus dynamics. Such findings necessitate additional observation and research on how a changing flow regime will influence nutrient pattern and processing in the Everglades ecosystem. The committee recommends that several of the S-333 Working Group’s (2023) recommended Phase II research and modeling initiatives should proceed immediately rather than after completion of the Phase 1 activities and subsequent assessment. These proposed activities include new hydrodynamic modeling and a comprehensive study of an expanded portion of the canals and marsh within the WCA-3A area upstream of S-333 to determine the dominant sources (sediment, floc, and suspended in the water column) of TP to Everglades National Park and the mechanisms by which these materials are contributing to TP inflows. The committee also recommends a rigorous comparison of sampling methods of TP and other related analytes between the FCE LTER and the SFWMD to determine the reason for the differences in observed long-term temporal patterns and further evaluate the potential for recent TP mobilization associated with increases in discharge. Expanded monitoring efforts (e.g., all forms of TP fractions, particularly total dissolved phosphorus) would help characterize suspended and organic phosphorus fractions to better understand the mechanisms driving changes in phosphorus cycling under a shifting hydrologic regime. Such information is necessary to develop optimal strategies to mitigate against mobilization of legacy phosphorus. Ongoing work by the FCE LTER to interpret differences in TP concentrations between diurnal and grab samples, including TP, dissolved oxygen, and ferrous iron, will advance understanding of potential mechanisms of phosphorus mobilization from Everglades sediments.
CONCLUSIONS AND RECOMMENDATIONS
The pace of restoration implementation has reached historic levels, based on record state and federal investments in FY 2022 and FY 2023. Six CERP projects are under construction (Picayune Strand, C-43 Reservoir, IRL-South, Biscayne Bay Coastal Wetlands, Broward County WPAs, and the CEPP), one
CERP project (Melaleuca Eradication) and two major project components (CEPP New Water, C-44 Reservoir and STA) have been completed, and one additional project (C-111 Spreader Canal Western project) is essentially complete. The CEPP continues to progress rapidly, as befits the project that is the keystone to restoring the central heart of the Everglades. Maintaining this pace of progress requires both continued construction funding and support for other agencies responsible for facilitating restoration implementation (e.g., permitting, monitoring). With so many projects under construction, if future funding levels fall short of those used for planning, difficult decisions will need to be made as to whether to delay all projects equally or, preferably, to expedite those with the greatest near-term benefits.
Sizable restoration benefits are evident from recent progress on CEPP New Water, Picayune Strand, and the Melaleuca Eradication projects. The recent completion of CEPP New Water is a restoration milestone. It is already evident that the combined effect of the recently constructed seepage barriers—CEPP New Water and a separate project constructed by the SFWMD—will greatly reduce, and perhaps even eliminate, flood control constraints imposed by the 8.5 Square Mile Area within the CEPP footprint. Prior to the COP, these constraints completely stymied every attempt over decades to restore the historic distribution of flow between Northeastern and Western Shark River Slough. However, with the addition of these new seepage barriers, no such constraints have affected operations since WY 2022. Restoration of hydrology in Picayune Strand appears to be generating benefits to the local flora and fauna, with vegetation and macroinvertebrate communities responding favorably. Additional longitudinal monitoring will be needed to continue documentation of recovery, especially given the magnitude of seasonal and inter-annual variation. Sampling methods for some species (e.g., amphibians) need to evolve to generate a clearer picture of what species are responding to restored hydrology. CERP investments in invasive species biological control efforts have contributed to a 75 percent reduction in area dominated by Melaleuca and have largely controlled air potato reproduction to the extent that air potato is no longer a priority invasive species.
Initial monitoring results indicate that the COP has been a restoration success, generally meeting expectations in achieving hydrological and ecological restoration objectives and improving conditions in the central Everglades relative to previous water management. The rehydration of Northeast Shark River Slough in Everglades National Park represents the largest step yet toward restoring the hydrology and ecology of the central Everglades. However, achieving complex objectives that involve creating fairly precise hydrologic conditions over extended periods of time—for example, optimal recession rates and water levels during the nesting season for threatened and endangered species—has
been more challenging. Like any system operations plan, the COP likely lacks the capacity to adjust sufficiently to meet the restoration targets under all rainfall regimes. Thus, the COP is proving to be what it was intended to be, not a complete solution but rather the first major step toward restoring the central heart of the Everglades. The changes wrought by the COP have revealed some issues with water quality and confirmed anticipated adverse effects on endangered Cape Sable seaside sparrows. The latter issue requires creative solutions, sooner rather than later.
Information on natural system restoration progress relative to expectations and project objectives remains difficult to find and interpret. The CERP lacks a mechanism for centralized multi-agency reporting of project-level restoration outcomes. Data, when available, are often presented in permit reports produced by a single agency or in monitoring reports produced by contractors. Increased attention to multi-agency data synthesis and interpretation is needed to support assessment and learning. The COP Biennial Report is an example of effective multi-agency analysis of extensive monitoring data on hydrologic, water quality, and ecological conditions in support of learning and adaptive management. Simplified and straightforward analyses of key metrics using geographic information system–based dashboards and easy-to-read graphics will provide increased transparency of restoration outcomes to the public and Congress.
WERP as proposed offers important benefits to the western Everglades, but implementation progress largely depends on non-CERP source control implemented by private landowners, which could lead to large delays without implementation and performance requirements. In general, WERP features, if implemented as planned, should improve hydration, hydrologic and ecological connectivity, and water quality, which have been longstanding concerns in the WERP study area. Yet, issues regarding flood risk of the Looneyville community still need to be addressed to meet Savings Clause requirements.
Downward trends in TP concentrations in STA outflow reflect extensive recent Restoration Strategies efforts, but timely attainment of the stringent WQBEL requirements will depend on how effectively the STAs respond to these efforts and the extent to which data collection (including cell-by-cell monitoring), data analysis, modeling, and synthesis are rigorously applied to inform adaptive management decisions. As noted in NASEM (2023), CERP progress and the timely delivery of restoration benefits, particularly for CEPP North and the EAA Reservoir, depend upon meeting the WQBEL in all STAs. High TP concentrations in Lake Okeechobee further the challenge of STA performance given the future plans to move more lake water south. The cumulative performance of STAs during the recent 5-year period is impressive and generally trending in the right direction, but only STA-3/4 currently meets the WQBEL. Maintaining low phosphorus and hydraulic loading rates should improve STA treatment efficiency,
but high inflow concentrations in the Western and Eastern Flow Paths could pose particular challenges for WQBEL attainment.
Additional research is recommended to explore the potential biogeochemical effects from the CERP through increased flows, flow velocities, canal-to-marsh interactions, and other factors that may mobilize legacy phosphorus and impact periphyton and plant communities. The S-333 Working Group identified sediment mobilization in the L-29 Canal as a key driver of increasing concentrations and loads into Everglades National Park with recent increased flows during the dry season, and agencies are implementing strategies to reduce sediment mobilization. Research through the DPM and FCE LTER has also illuminated potential connections between increased flows and increased TP loading and/ or vegetation impacts, although discrepancies between the SFWMD and FCE LTER data need to be resolved. The potential of ecological effects from increased CERP flows also merits further study. Specifically, research should examine the dominant TP sources (e.g., sediment, floc, suspended) to Everglades National Park and WCA-3B, determine the mechanisms by which these concentrations and loads may be exacerbated under the CERP through increased flows and/or canal-to-marsh interactions, and, if necessary, identify approaches to mitigate phosphorus impacts.


