Bus Operator Barrier Design: Guidelines and Considerations (2024)
Chapter: 3 Findings

CHAPTER 3
Findings
Survey Results
The data captured with this survey were intended to inform the transit industry and its stakeholders about the current use of bus operator barriers and to inform future guidelines and barrier designs, including the bus operator barriers being designed as part of this project. Survey respondents were not required to answer all questions. Respondents may have chosen to skip certain questions because they lacked data or knowledge on that topic, and some questions directed the respondents to skip questions based on their responses to another question. In those cases, there were fewer total responses per question than the total number of respondents who started the survey.
Survey Demographics
A total of 77 respondents submitted survey results from across North America. The survey was distributed from fall 2022 through winter 2023. Forty-nine (49) respondents identified their organization or agency affiliation. Seven respondents left the question field empty and did not identify their affiliation. Other respondents skipped this question. Out of the 49 who identified, two of the survey respondents were from Canada, while the other 47 were from across the United States. Table 3 provides a list of transit agencies and organizations represented in the survey.
Survey respondents were asked to provide their current job title, role, and position at their transit agency of employment. Job roles were broken into four basic categories with each category having different job titles or positions for respondents to choose from. The four basic job role categories were
- Administration, Upper Management, and Executive Leadership (Agency Level);
- Maintenance Operations (Depot, Division, Department Level);
- Transportation Operations (Depot, Division, Department Level); and
- Engineering, Procurement, and Non-operations (Agency Level).
Figure 15 provides the breakdown of the 77 survey respondents by job title, role, or position within their respective transit agencies.
Across 53 survey respondents, the average years of experience in their current job title, role, or position was 9.7, with a high of 34 years and a low of 1 year. Table 4 breaks out average years of experience by job category. Additionally, among 45 survey respondents, 11 (24%) identified as being a union representative.
Table 3. Transit agencies completing bus operator barrier survey (n = 56).
| Agency | Surveys Completed |
|---|---|
| ABC | 1 |
| Broward County Transit (Florida) | 1 |
| Central Ohio Transit Authority | 1 |
| Central Virginia Alliance for Community Living | 1 |
| Chicago Transit Authority | 1 |
| DC Metro | 2 |
| Detroit Department of Transportation | 2 |
| El Dorado County Transit | 1 |
| Fairfax County Department of Transportation (Virginia) | 2 |
| First Transit Inc. | 1 |
| Greater Peoria Mass Transit | 2 |
| JTRAN (City of Jackson, MS) | 1 |
| Lake Erie Transportation Commission (Monroe, MI) | 1 |
| Lane Transit District (Lane County, OR) | 12 |
| Lowell Regional Transit Authority (Massachusetts) | 1 |
| MARTA (Atlanta, GA) | 1 |
| New York City Transit | 3 |
| Omnitrans (San Bernadino, CA) | 2 |
| Pierce Transit (Pierce County, WS) | 1 |
| Pittsburgh Regional Transit | 2 |
| Regional Transportation Agency of Central Maryland | 1 |
| SABIC | 1 |
| San Diego Metropolitan Transit System | 1 |
| San Francisco Municipal Transit Agency | 1 |
| SEPTA (Philadelphia, PA) | 1 |
| Toronto Transit Commission | 2 |
| Transit Workers Union | 2 |
| TriMet (Portland, OR) | 1 |
| No organization listed | 7 |
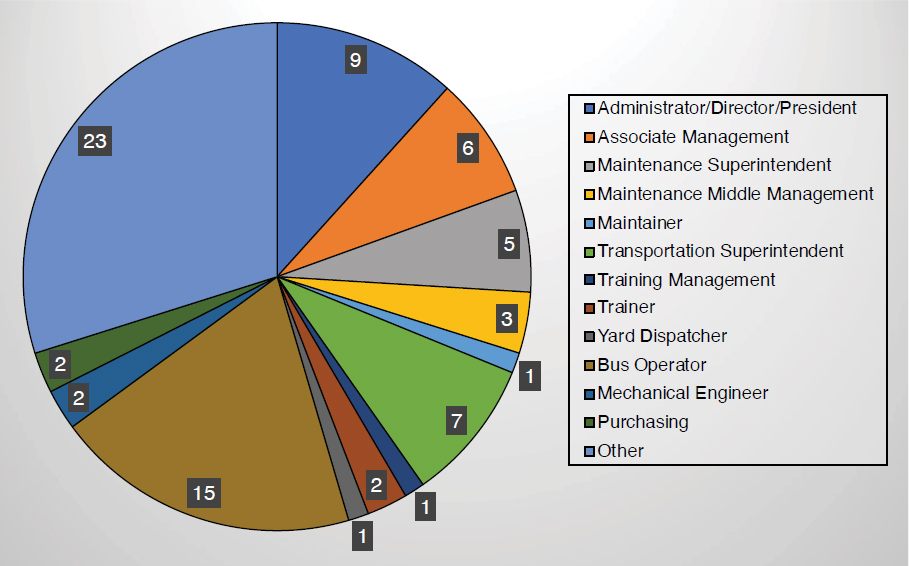
Table 4. Average years of experience by job category (n = 53).
| Job Category | Average Years of Experience |
|---|---|
| Administration, Upper Management, and Executive Leadership | 8.4 |
| Maintenance Operations | 6.3 |
| Transportation Operations | 14.7 |
| Engineering, Procurement, and Non-operations | 3.5 |
Agency Barrier Use
The next set of survey questions captured overall use of bus operator barriers, the main purpose of the bus operator barrier for each transit agency, and whether barrier use would continue as the COVID-19 pandemic wanes.
The results among 54 respondents showed that 52 (96%) of these respondents indicated their transit agency was currently using bus operator barriers. Among 51 respondents, only 16 (31%) indicated their transit agency was using bus operator barriers before the COVID-19 pandemic. As a follow-up question for transit agencies using bus operator barriers before the COVID-19 pandemic, these respondents were asked to identify the primary reason for their use. Table 5 provides a breakdown of bus operator barrier use factors among 16 respondents.
Among respondents indicating their transit agency did not use bus operator barriers before the COVID-19 pandemic, all 34 indicated their agency planned to continue using the bus operator barriers even as the COVID-19 pandemic wanes and restrictions are lifted.
Requirements may vary between transit agencies on required use of the bus operator barriers by their operators. To assess this requirement, survey respondents were asked to indicate whether bus operators were required to actively use the barrier during revenue-generating operations. A total of 50 respondents chose to answer this question, with 46 (92%) reporting they are required to actively use the bus operator barrier during revenue-generating runs, while four (8%) were not required to actively use the barrier.
Finally, for the four respondents who indicated their transit agency is not currently using bus operator barriers, three reported that their agency has either considered or is currently considering the use of bus operator barriers. The primary reasons respondents gave for why these agencies have not implemented bus operator barriers were
- No record of assaults,
- Concern for emergency evacuation of the operator, and
- Need for more research to determine the quality and effectiveness of barriers.
Barrier Design and Process
The survey requested information about the design elements of bus operator barriers currently in use, including selection and evaluation, redesign, continued use, ADA compliance, and
Table 5. Bus operator barrier use factors before COVID-19 pandemic (n = 16).
| Primary Reason for Bus Operator Barrier | Total Responses |
|---|---|
| Prevention of physical assault | 11 |
| Bus operator health (e.g., sneeze guard) | 1 |
| Both | 2 |
| Other | 2 |
emergency egress. Survey respondents were asked to describe the type of barriers in use by their respective transit agencies. A wide range of barrier materials and designs were provided:
- Vinyl shower curtain,
- Full plexiglass enclosure,
- Full polycarbonate enclosure,
- Steel half barrier door,
- Full barrier with steel lower half and sliding plexiglass upper half,
- Full barrier with steel lower and glass upper half with powered windows and separate fan controls, and
- Upper half that can open separately from the lower half.
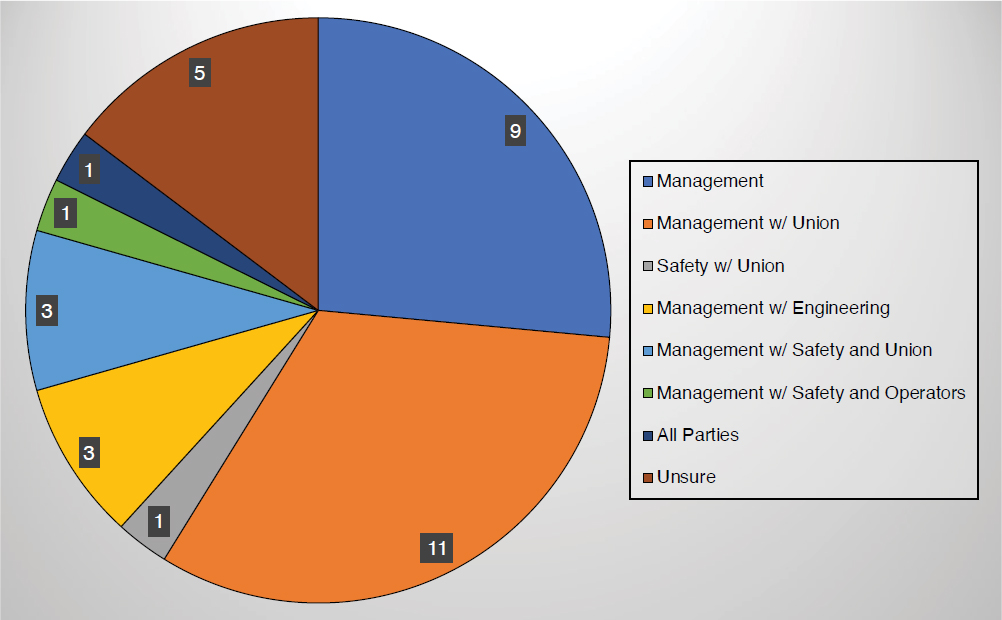
Various personnel are often involved in the selection and evaluation of bus operator barriers. A total of 34 respondents answered this question. Figure 16 provides a breakdown of the categories of responses for personnel involved in the selection and evaluation of their transit agency’s bus operator barrier.
More detail on the barriers was provided by respondents. Among 37 respondents, 15 (41%) indicated there had been a redesign since the initial installation of their bus operator barriers. Among 39 respondents, 38 (97%) indicated that bus operator barriers are still in use at their respective transit agencies.
Interestingly, one respondent out of 38 indicated their bus operator barrier had automated opening and closing while a second respondent indicated their barriers were both manual and automated. All other respondents indicated manual operation of their barriers.
All but one respondent out of 38 indicated that the front passenger doors are still operable and accessible by passengers without disabilities; however, 29 (74%) of 39 respondents indicated their bus operator barrier was ADA compliant in terms of allowing passenger flow and mobility
devices through front door access. Nine of the 39 respondents did not know whether the barrier was compliant.
Two factors important to the bus operators themselves were emergency egress and visibility or glare concerns. Only 23 (59%) out of 39 respondents indicated their bus operator barrier had emergency egress, while 16 (41%) reported there was no emergency egress. As for the visibility and glare concerns, a slight majority, 21 (54%) out of 39 respondents, indicated that their bus operator barrier did take into consideration their visibility and glare concerns, while 18 (46%) indicated that their barrier did not consider these factors.
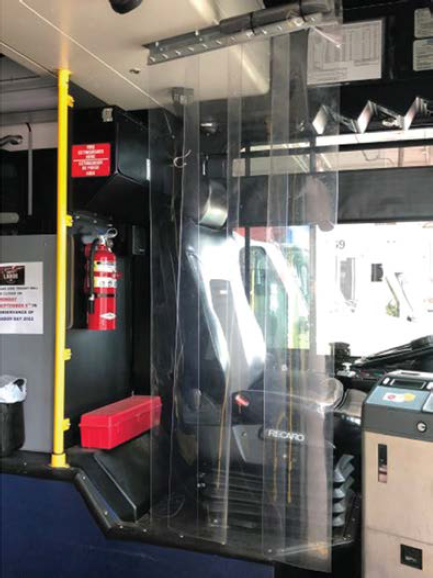
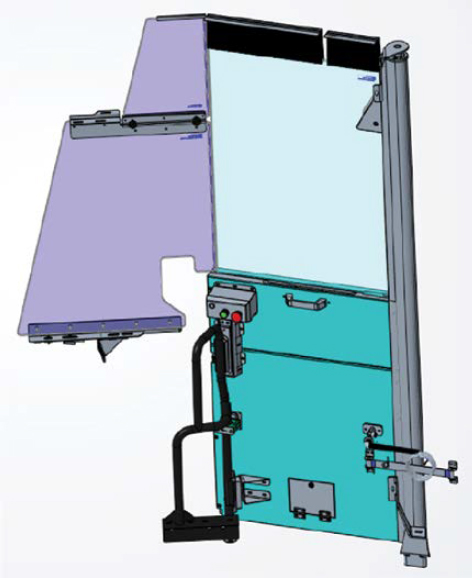
Barrier Samples
Respondents of the survey were asked to share images of their barriers for reference in the study. Only two respondents chose to upload images. One response showed that transparent vinyl sheets were hung above the standee line between the passenger compartment and the passenger front entryway (Figure 17). The second image was a CAD model rendering demonstrating a complex pneumatically powered bus operator barrier door with panels that can be adjusted by the bus operator (Figure 18).
Maintenance
To ensure bus operator barriers are functioning correctly, proper maintenance is critical. Survey respondents were asked to indicate the maintenance cycles, if known, of the bus operator barriers in use at their agency. A total of 37 responses were received for this question. Table 6 provides the reported maintenance cycles.
Survey respondents were provided with an open-ended opportunity to describe the most common types of required maintenance conducted on their bus operator barriers. Thirty-one (31) respondents described maintenance needs. Figure 19 provides categories among those maintenance needs for bus operator barriers.
Costs
Respondents were asked to provide the initial cost of bus operator barriers, average yearly maintenance costs per bus operator barrier, average life cycle of the barriers, and whether the bus operator barriers were designed in house, by the bus manufacturer, or by a third-party vendor.
Twenty (20) respondents out of the 31 indicated they did not know or were unsure of the initial costs per bus operator barrier. Of the 11 respondents who provided a cost estimate, retrofit barrier costs ranged from $25 (i.e., shower curtain) to $7,000 per barrier, while factory-installed barriers on new buses ranged from $3,000 to $7,500 per barrier.
Respondents also provided information on the design of the bus operator barriers. Among the 33 responses received, eight (24%) reported the barriers were designed in house, 13 (39%) reported the barriers were designed by a third-party vendor, six (18%) reported the barriers were designed by some combination of both in-house and third-party technicians, and six (18%) reported being unsure.
The survey also sought information regarding the average yearly maintenance cost per bus operator barrier as well as the average life cycle of these barriers. Of the 29 respondents, 19 (66%) indicated they did not know the average yearly maintenance cost per barrier; however, 10 (34%) respondents reported average maintenance costs ranging from $0 to $1,000 per barrier per year. Similarly, for the average life cycle of bus operator barriers, 22 out of 30 respondents were unsure.
Table 6. Bus operator barrier maintenance cycle (n = 37).
| Maintenance Cycle | Total Responses |
|---|---|
| 1 time per year | 3 |
| 2–3 times per year | 8 |
| 4 or more times per year | 5 |
| Never | 1 |
| I don’t know | 20 |

Of the eight respondents providing estimates of the average life cycle, the life cycle ranged from 1 to 13 years with four respondents reporting the bus operator barrier lasts the life of the bus.
Effectiveness and Desired Features
Respondents were asked to report any challenges they encountered when implementing the bus operator barriers and then to describe their ideal bus operator barrier, considering personal experience and lessons learned.
Effectiveness
Respondents could indicate they encountered more than one challenge when implementing bus operator barriers. A total of 30 respondents answered this question with 39 responses. Figure 20 provides a breakdown of the implementation challenges.
When it came to training on the use of the bus operator barrier, a total of 33 respondents answered this question. Slightly less than half of respondents indicated training was provided to bus operators regarding barrier use and maintenance. Fourteen (14) respondents indicated having no training and three did not know. A follow-up to this question asked respondents to describe this training. No responses were received.
Thirty-one (31) respondents reported on benefits and outcomes, with the largest benefit and positive outcome being a reduction in assaults, as reported 10 (32%) times. Some respondents reported multiple benefits. Improved operator protection or confidence was reported six (19%) times. Other reported benefits included reduced operator sick days, reduced operator injury, general benefits, and containment of airborne pathogens. Negative responses included increased assaults and increased workers’ compensation, while six responses of unknown and five responses of no benefits were also reported.
Among 33 respondents, 22 indicated that bus operators did complain about barriers, and 11 responded that the operators did not complain. As to passengers, two of the 33 respondents
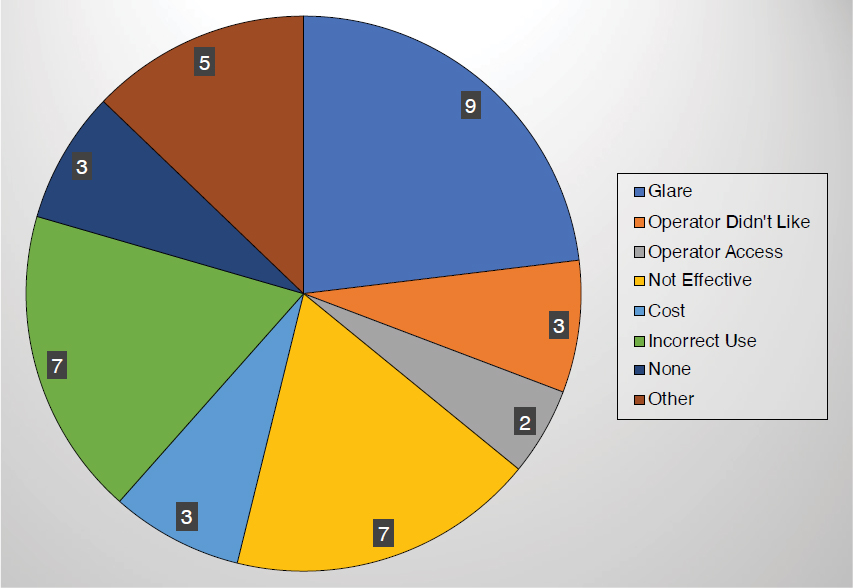
NOTE: Respondents could indicate more than one challenge. Thirty (30) respondents provided 39 barrier implementation challenge responses.
reported passengers complaining about bus operator barriers. Although both of these questions asked for descriptions explaining the complaints, no responses were provided.
Return on investment (ROI) is often a critical factor for implementation. Of the 28 respondents to this question, 20 indicated they did not know whether there was an ROI on the use of the barriers and three indicated it was not applicable. Among respondents who described ROI factors, responses included reduced assaults, reduced workers’ compensation claims, and prevention of operator sickness as factors that would calculate into their transit agency’s ROI calculation.
On the overall success of bus operator barriers, 12 of 31 respondents indicated that barrier use had been successful, 13 indicated barrier use was partly successful, and six indicated barrier use was unsuccessful for their organization. An overwhelming majority, 32 of 33 respondents, reported their organization plans to continue using bus operator barriers, while the remaining one indicated their organization would not continue using bus operator barriers.
Desired Features
Eleven (11) of the 25 respondents who described their ideal bus operator barrier said that their most desired feature was full operator barrier/protection. Some respondents provided multiple attributes. Other responses included anti-glare coatings, better ventilation or air movement, a full/partial open/protection option/auto lock barrier, adjustable window slider, temperature control, original equipment manufacturer build and install, emergency latch for emergency escape, and an intercom for communication between operator and passengers. One respondent commented that because visibility was more important than a false sense of safety, not using a barrier would be ideal. Responses also included “none,” “unknown,” and “not applicable,” which were reported by one respondent each.
Barrier Designs
Three bus operator barrier designs were developed on the basis of issues present in the North American transit bus industry today and the range of preferences and needs identified by the survey. The designs seek to address the risk mitigation targets defined in the approach. The three concept designs are illustrated in this section.
As demonstrated in Figure 21, Concept A was based on an existing bus operator barrier design framework used today in New York City (see the section on previous research). Data collected from multiple bus and barrier configurations were considered in this design. Concept A was modeled in an existing battery electric low-floor transit bus provided by Gillig LLC to demonstrate the size, scale, and feasibility of the concept in a current production bus. This barrier concept was not developed by Gillig LLC and cannot be considered a final assembly that could be immediately manufactured or installed in any specific bus configuration.
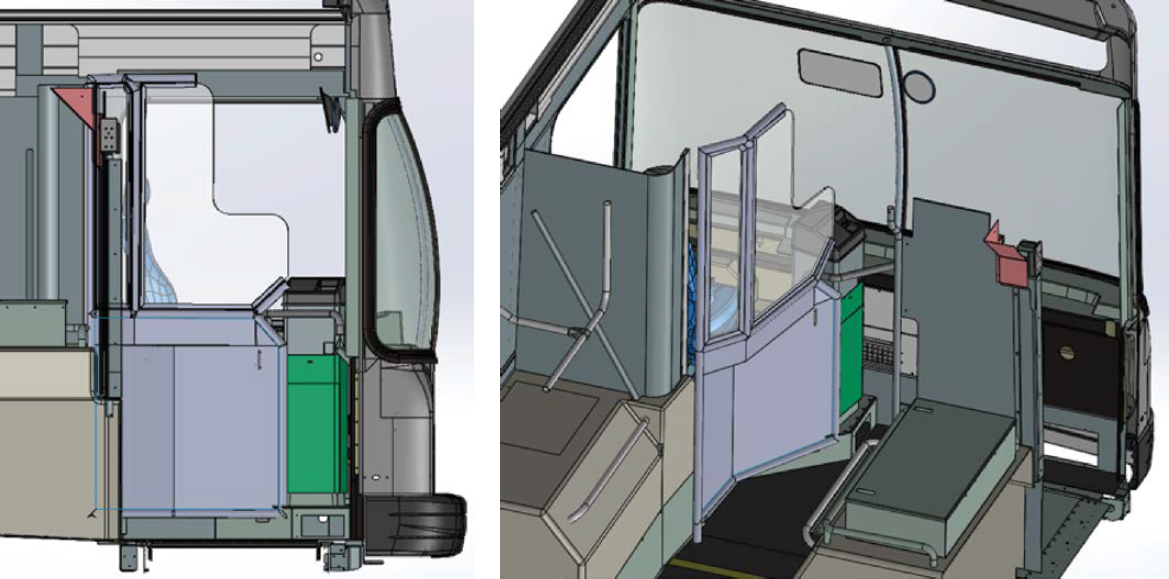
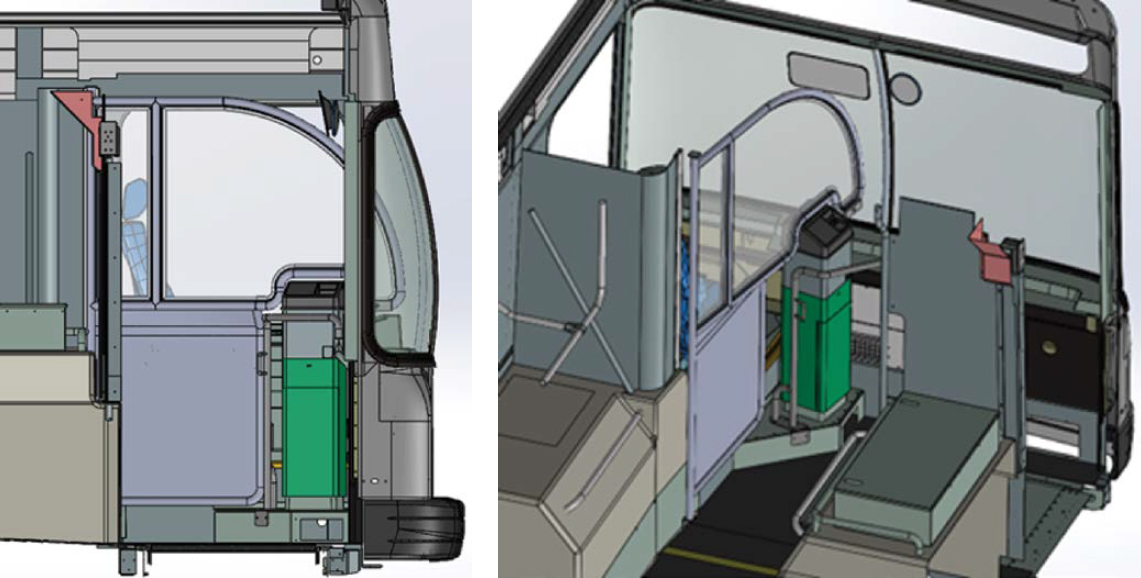
As demonstrated in Figure 22, Concept B was based on a novel idea to maximize the barrier size between the bus operator and the passenger front entryway with the intention that the bus barrier door would move with the front entry door at every stop. The transparent glazing would provide the bus operator protection while stopped and an unobstructed view while driving, after the passenger front entry door was closed. Concept B was modeled in an existing battery electric low-floor transit bus provided by Gillig LLC to demonstrate the size, scale, and feasibility of the concept in a current production bus. This barrier concept was not developed by Gillig LLC and is not to be considered a final assembly that could be immediately manufactured or installed in any specific bus configuration.
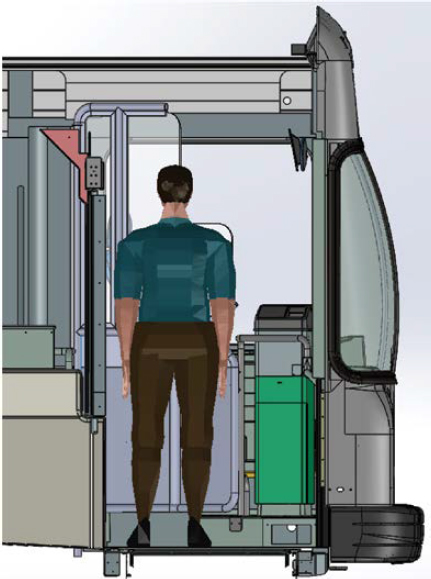
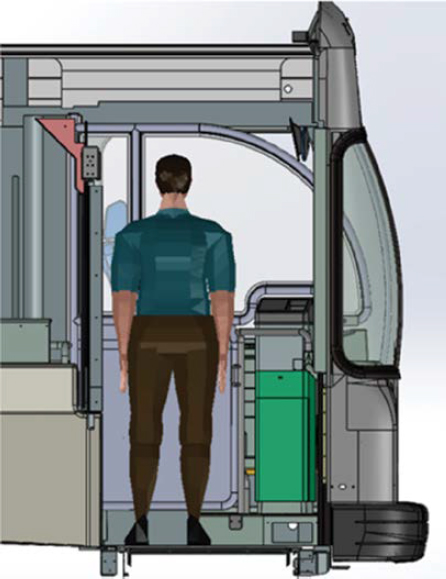
As demonstrated in Figure 23, Concept C was based on a novel barrier and bus body/chassis idea to completely separate the bus operator from the passenger front entryway and passenger compartment, with the intention that the bus barrier door would move automatically with the front entry door at every stop (like Concept B), provide protection for the bus operator while
stopped, and provide an unobstructed view for driving after the passenger front entry door was closed. Concept C was modeled inside a Van Hool low-floor transit bus that is no longer in production to demonstrate the size, scale, and feasibility of the concept in a realistic low-floor transit bus vehicle architecture. This barrier concept and the bus operator workstation model would require further bus body and chassis prototype development before the Concept C bus operator barrier could be developed for full production.
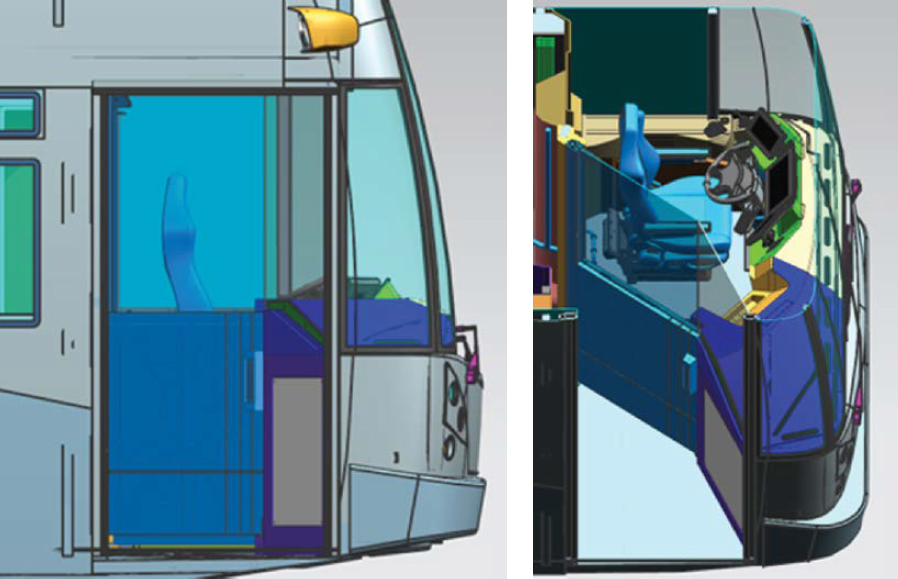
Figure 23. Concept C bus operator barrier.
Requirement Matrix Concept Status
Design criteria that pertain to bus operator barriers were organized according to component/area variables and feature variables as described in the section on design criteria. The full criteria list is provided in the requirement matrix in Appendix A. During the development of the bus operator barrier by the research team, these criteria were applied to guide the attributes of Concepts A and B. The design effort in the Bus of the Future project occurred before the collection of criteria for this project was complete. However, draft versions of the requirement matrix were shared with the Bus of the Future research team.
The application of the requirement matrix included two steps for each bus barrier concept. First, each criterion was evaluated against each concept. If a criterion applied to the concept (i.e., A, B, C) then that concept was identified with that criterion. For example, the feature variable “Glare, General” in the variable “Driver’s Area” references a criterion from APTA that the glare should be “minimize[d] to the extent possible.” This criterion applies to Concept A because even though glazing was designed to avoid interference from the bus operator’s vision with the curbside rearview exterior mirror, the glazing is fixed during bus driving and may interfere or collect glare over the view of the passenger front entry door used to see that side of the bus for driving. However, the Concept B bus operator barrier is intended to automatically adjust position to latch against the passenger compartment partition and will not interfere with the bus operator’s view of the mirror or passenger entry door. For this example, Concept C was also included as a priority for this criterion in case the bus operator chooses to keep the barrier door latched near the bus operator workstation, which could interfere with the bus operator’s view of the passenger entryway door and collect glare.
The second step in the application of the requirement matrix was to define the status or anticipated satisfaction of that criterion on the basis of the final design of each bus operator barrier concept. Using the same example, the status for the feature variable “Glare, General” for Concept A was, “Potential issue, material selection is crucial.” The status for this feature variable for Concept B was “Alleviated by closing [barrier door] to rear (open to driver) for driving.” The status for this feature variable for Concept C was “Barrier glazing can be lowered to reduce glaring. Glare from the barrier can be alleviated by closing to rear (open to driver). Fixed glazing is parallel to the line of sight to minimize obstruction. It should reach to vehicle ‘B’ post to ensure a direct view to the windshield and side window.” Status and descriptions for each criterion and concept bus operator barrier are provided in the requirement matrix for use by designers and implementers.
Risk Mitigation Evaluation
Each of the bus operator barrier concepts was evaluated against the target risk mitigation attributes. The findings of this evaluation are organized by concept and risk attribute.
Concept A Risk Mitigation
Physical, Spitting, and Other Attacks
As demonstrated in Figure 24, Concept A was estimated to provide high mitigation of direct physical contact by limiting reach by passengers, low mitigation of an attack by shooting a weapon around the barrier, and low mitigation of spitting around or over the barrier. Passengers may be able to reach around the door and release the operator-side latch.
Air Quality
As demonstrated in Figure 25, Concept A was estimated to provide no mitigation of coughing/sneezing risk and no mitigation of air quality risk.
Temperature
Concept A was estimated to provide low mitigation of cold temperatures, as the barrier may reduce cold gusts through the passenger entryway door but not change temperature and humidity. The gap between the barrier and windshield may limit the potential benefit.
ADA
As demonstrated in Figure 26, Concept A was estimated to pass clearance for passengers with disabilities on the basis of the minimal dimensions for the ADA clearance box. This concept maintains the current common configuration for the front entry ramp.
Usability
Concept A was estimated to provide medium mitigation of risk to bus operator reach and repetition, as the door does not have to be moved at every stop for driving visibility. The barrier door
is operated manually and does not change on the basis of the state of the front entry door. The bus operator may latch or release the barrier under normal operation to perform passenger service or for emergency egress.
Visibility
As demonstrated in Figure 27, Concept A was estimated to provide high mitigation of obstruction/glare for visibility of exterior mirrors and interior passenger mirrors; however, obstruction/glare from the barrier may exist when the bus operator looks at the passenger front entry door. The barrier door is not intended to latch in the open position, except optionally at a mechanical position for service and maintenance outside revenue activities.
Concept B Risk Mitigation
Physical, Spitting, and Other Attacks
As demonstrated in Figure 28, Concept B was estimated to eliminate direct physical attack by passenger reach. Concept B was estimated to provide medium mitigation of attack by shooting a weapon around the barrier. It was estimated to provide high mitigation of spitting, as passengers cannot lean around the barrier, but potential exists for spitting over the top of the barrier. The passenger cannot easily reach around the barrier door and release the latch. The emergency egress hinge release is not reachable by a passenger.
Air Quality
As demonstrated in Figure 29, the size of the Concept B barrier was estimated to provide medium mitigation of coughing/sneezing risk. It was estimated to provide medium mitigation of air quality risk, depending on implementation of additional partitions between front entry and passenger compartments to limit gaps and increase pressure on the front side of the barrier. The targeted gaps of 1 in. were not achieved without modifications and additions to the passenger compartment partition. The pressure differential is also dependent on the use of external bus openings (e.g., windows and hatches) that may reduce potential airflow benefits. Filtered fresh air inlets in the bus HVAC, defrosting system, or bus operator workstation may increase these potential benefits by mixing fresh air with internal air.
Temperature
Concept B was estimated to provide medium mitigation of cold temperatures. The barrier may reduce cold gusts through the passenger entry door, but there would be no change to temperature and humidity. The extended length of the barrier toward the windshield may increase the potential benefit compared with Concept A.
ADA
As demonstrated in Figure 30, Concept B was estimated to pass the clearance for passengers with disabilities on the basis of the minimal dimensions for the ADA clearance box. The concept maintains the current common configuration for a front entry ramp.
Usability
As demonstrated in Figure 31, Concept B was estimated to be implemented with automatic operation based on passenger front entry door state and using a powered pneumatic armature and electromagnetic latches (Figure 32) at both positions for boarding and driving. A power override would allow the bus operator to perform passenger service under normal operation. The concept includes a physical hinge release for non-powered emergency egress.
Visibility
As demonstrated in Figure 33, Concept B was estimated to provide high mitigation of obstruction/glare risk for visibility of exterior mirrors and interior passenger mirrors because the barrier latching position is open when the bus is in motion. This concept was also estimated to provide high mitigation of risk for obstruction/glare when an operator is looking at the passenger front entry door, as the barrier door automatically latches open while driving.
Concept C Risk Mitigation
Physical, Spitting, and Other Attacks
As demonstrated in Figure 34, Concept C was estimated to eliminate direct physical attack by creating a separate floor-to-ceiling bus operator workstation compartment. The concept may convey the appearance that attackers cannot access the workstation, potentially mitigating attack by shooting a weapon. The concept eliminates spitting attack. The door release would not be accessible by passengers.


Air Quality
As demonstrated in Figure 35, Concept C was estimated to eliminate coughing/sneezing risk by incorporating a separate bus operator workstation compartment. The concept was estimated to provide high mitigation of air quality risk, assuming positive pressure can be created on the bus operator workstation side.
Temperature
Concept C was estimated to eliminate cold temperature risk. The risk caused by hot temperatures and humidity may not be mitigated and may be increased because the separate compartment creates the need for a separate bus operator workstation HVAC system and additional defrosting/defogging vents near the additional barrier door and barrier stationary glazing surfaces.
ADA
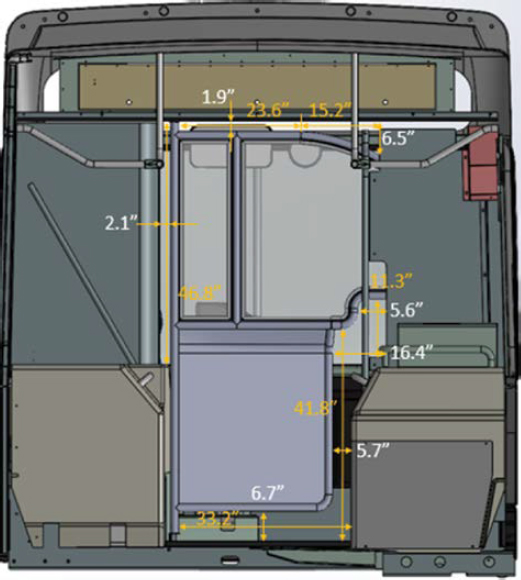
Concept C was estimated not to pass clearance for passengers with disabilities on the basis of the minimal dimensions for ADA clearance in the passenger front entryway. The existing bus architecture used by the Bus of the Future team was not designed for ADA passenger front door entry. However, Concept C passes clearance for passengers with disabilities on the basis of the dimensions for the ADA clearance box in the mid/rear door entry, as seen in Figure 36. Assuming the bus can dock for mid-entry and the bus would be equipped with a mid-entry ramp, this approach could accommodate devices that exceed the minimum ADA clearance box today.
Usability
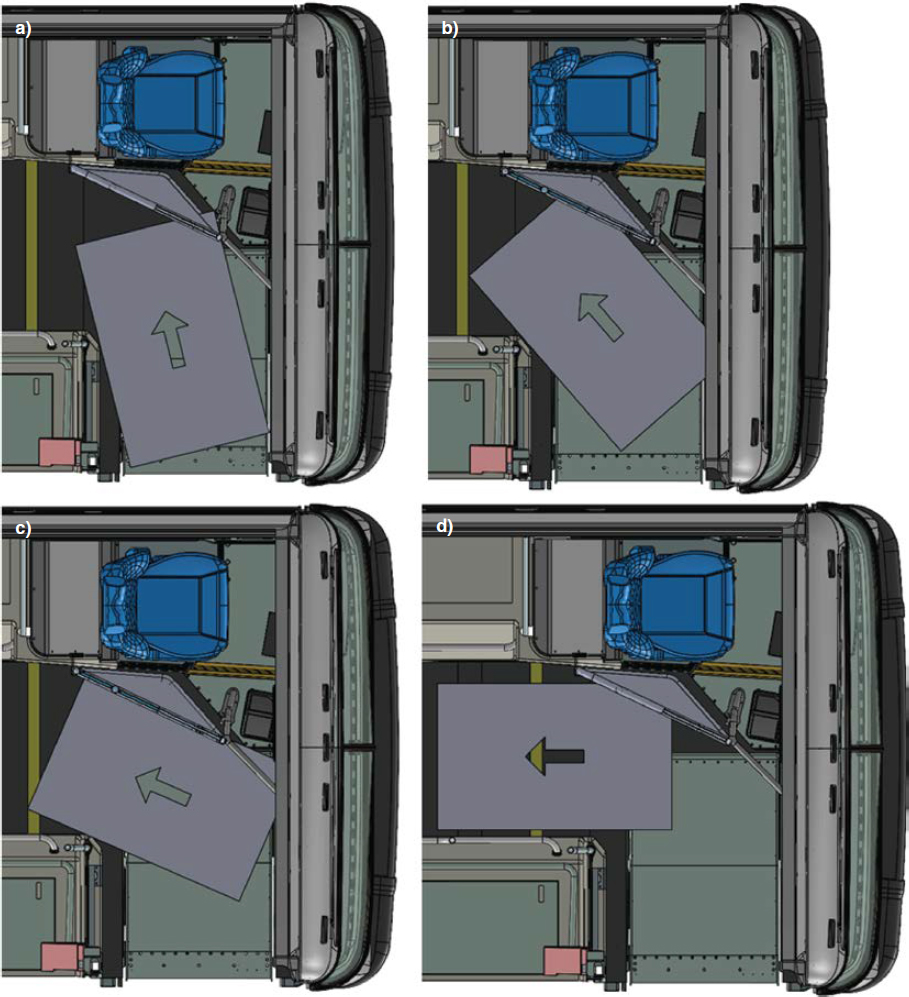
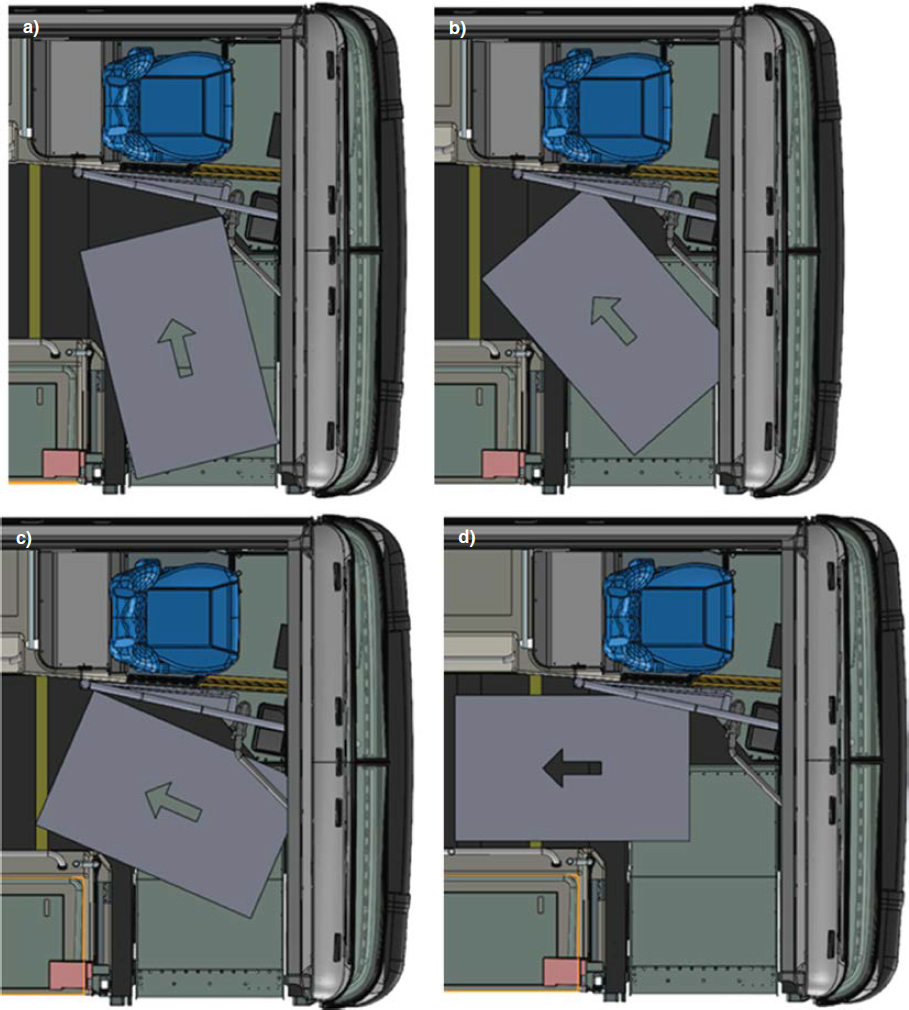
As demonstrated in Figure 37, Concept C was estimated to be implemented with automatic operation based on the state of the passenger front entryway door, using a pneumatically powered armature and electromagnetic latches (Figure 38) at both positions for boarding and driving.
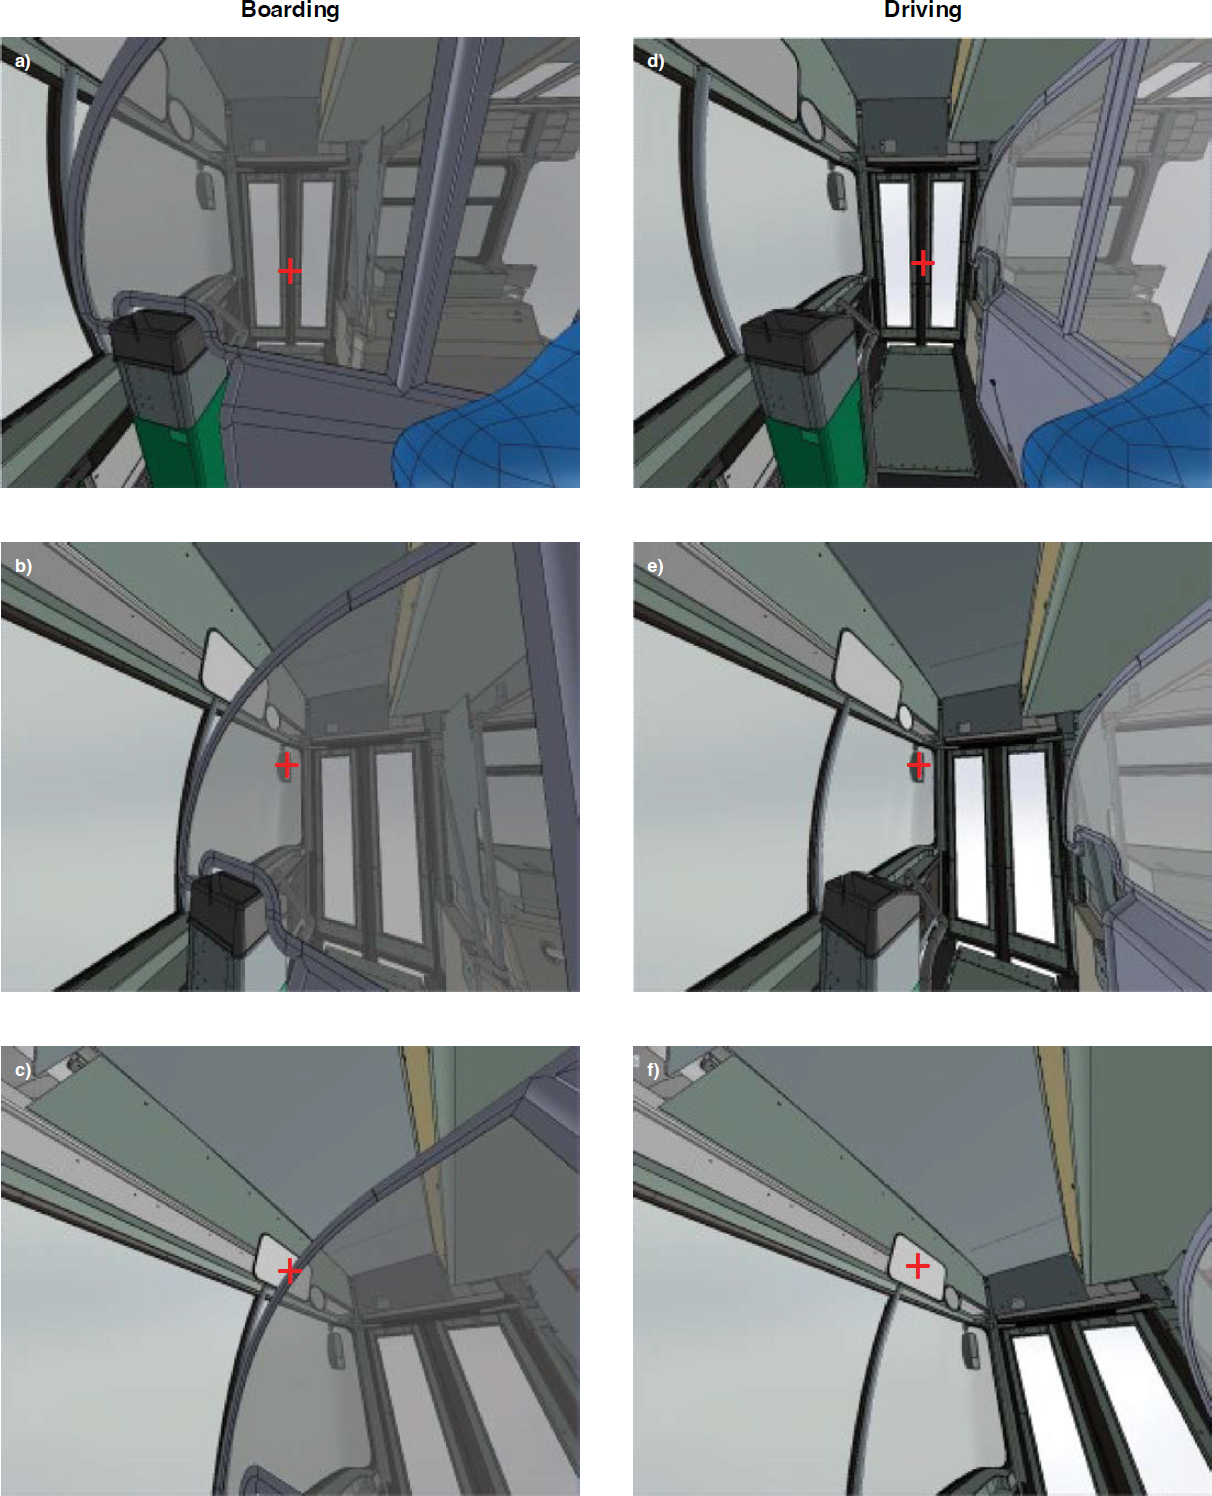
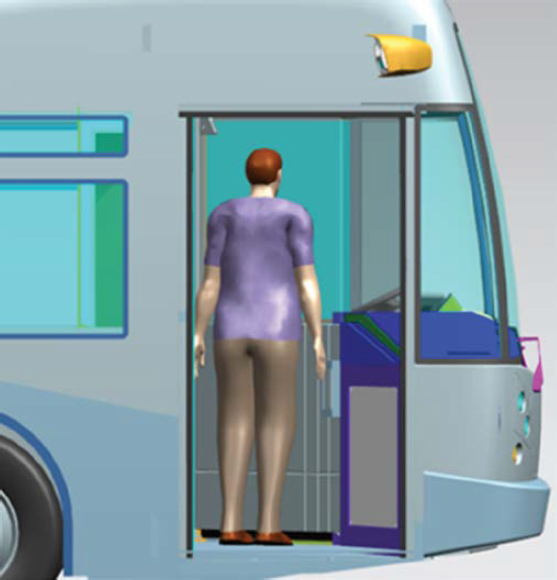
Figure 34. Side view of a large male standing next to Concept C bus operator barrier.
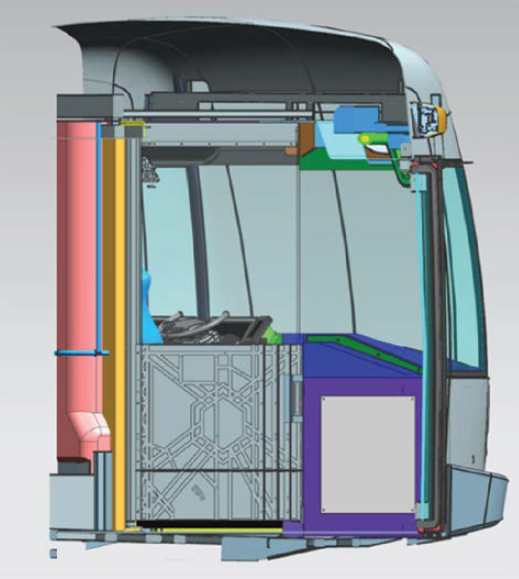
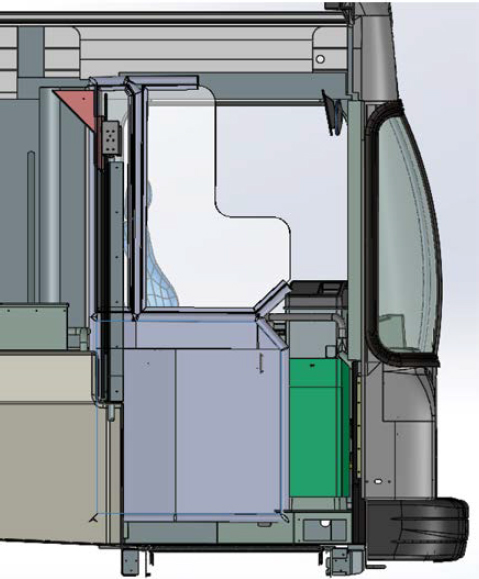
Figure 35. Side view of Concept C bus operator barrier latched at bus operator workstation and demonstrating sealed closure with stationary barrier and no air exchange.
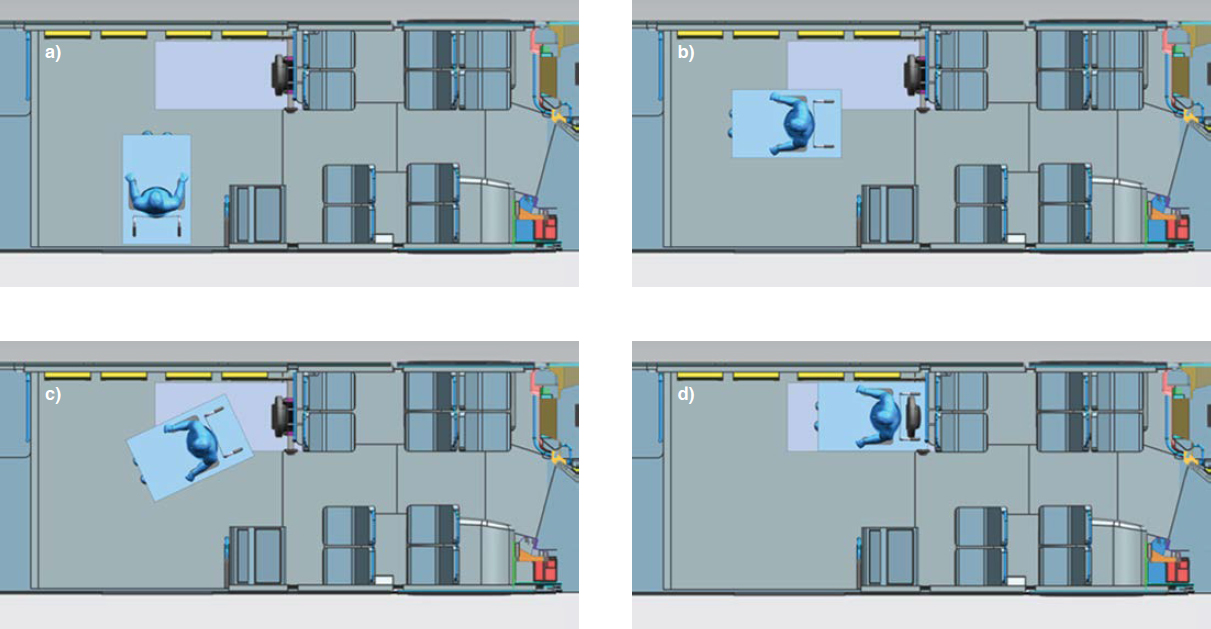
Figure 36. Top view of minimum ADA wheelchair clearance demonstrated on Concept C at mid/rear door entry at multiple entry stages.
For this concept, a manual bus operator switch is another option for the barrier door. A power override would allow the bus operator to perform passenger service under normal operation. The concept includes a physical hinge release for non-powered emergency egress.
Visibility
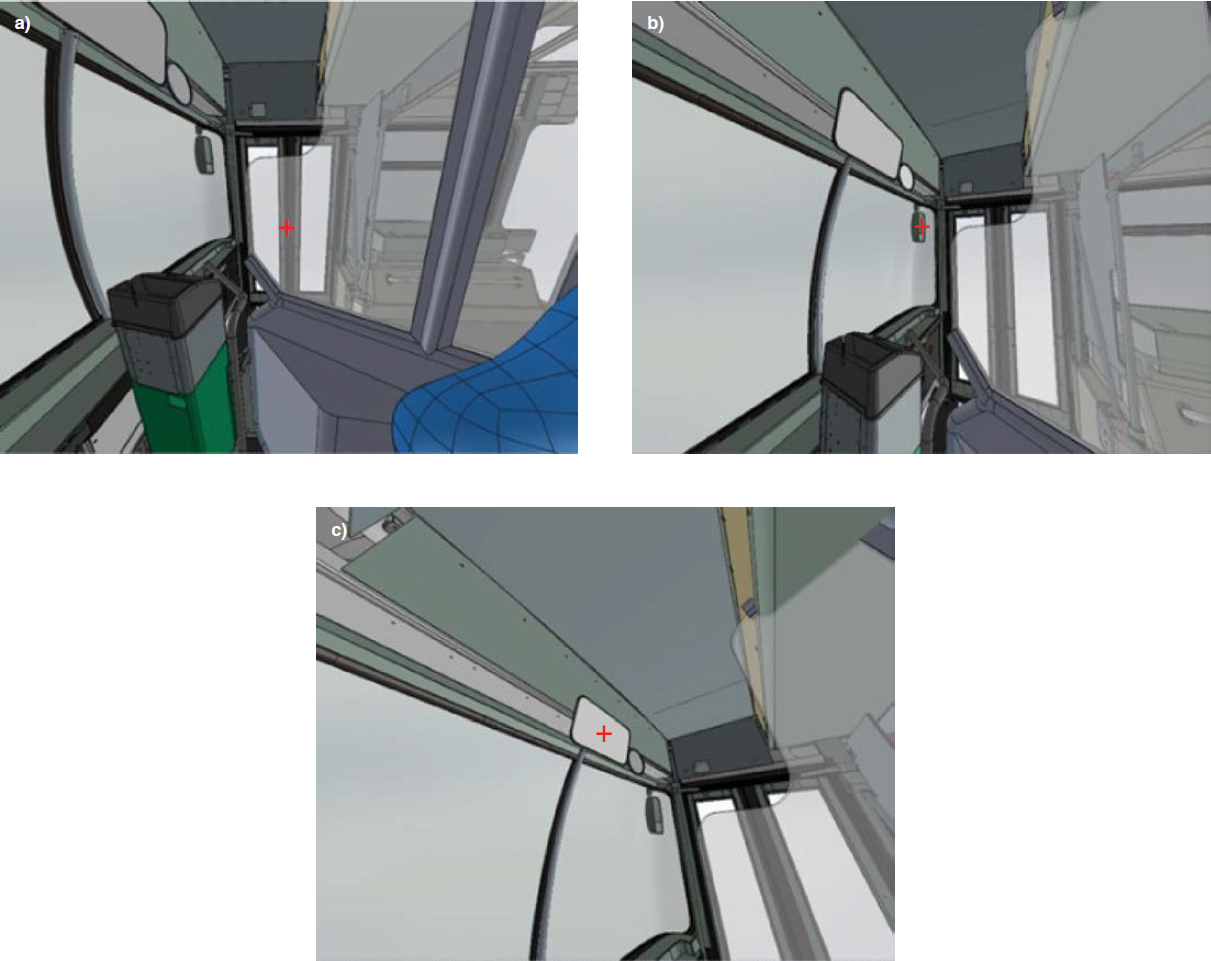
As demonstrated in Figure 39, Concept C was estimated to provide high mitigation of obstruction/glare risk for visibility of the curbside exterior mirror from the orientation of the stationary barrier, which does not interfere with the bus operator’s view. Another alternative that may provide high mitigation of risk for obstruction/glare over exterior mirrors is the use of cameras and displays to replace rearview mirrors. Regarding the risk for obstruction/glare over the passenger front entry door, Concept C was estimated to provide high mitigation because the barrier door could automatically latch open during driving or the glass could be lowered in the barrier door, as seen in Figure 40.
Stakeholder Feedback and Considerations
The bus operator barrier designs and requirements were shared with representatives on the TCRP panel and others in the industry who have a stake in the design of bus operator barriers. Representatives included those in the roles of operations, HVAC manufacturing, glazing supply, and bus manufacturing. Comments and feedback have been generalized and listed in this section.
Concept B Operations Feedback
- Consider more support for the upper portion of the bus operator barrier to prevent vibration and to provide structure for latching and durability.

Figure 37. Demonstration of two positions for Concept C at boarding position in (a) side view and (b) rear view and at driving position in (c) side view and (d) rear view.
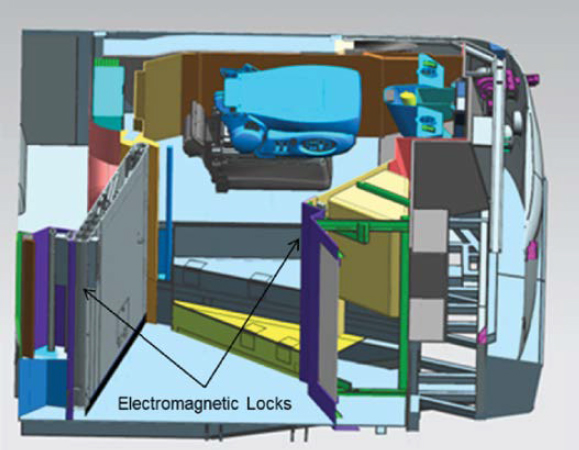
Figure 38. Demonstration of the pneumatically powered door mechanism and electromagnetic lock at optional driving position.
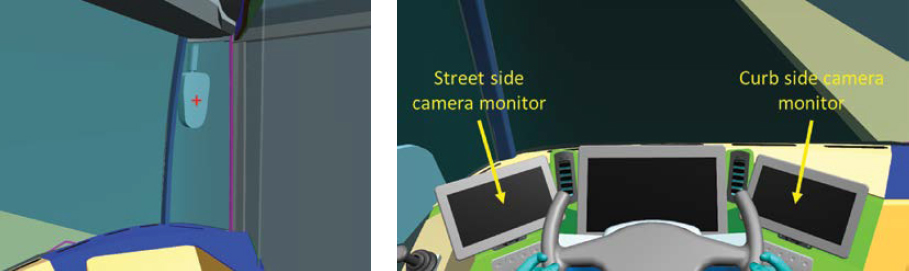
Figure 39. Bus operator perspective view with Concept C while looking at the optional curbside rearview mirror (left) and the alternative bus operator workstation rearview camera displays (right).
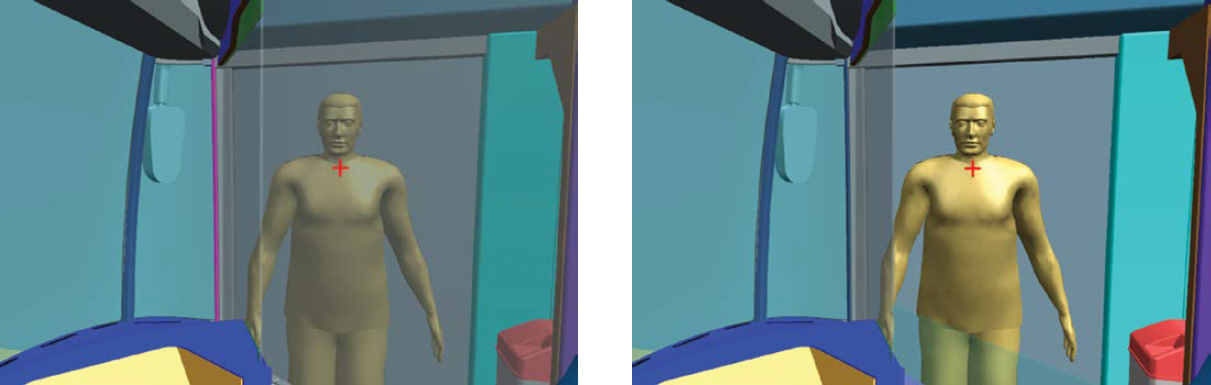
Figure 40. Bus operator perspective view while looking at the passenger front entry door with Concept C at boarding position, with barrier glazing up (left) and with barrier glazing down (right).
Concept C Operations Feedback
- The mechanical interface between the barrier and stationary transparent structure at the windshield end is not clear.
- Where is the farebox?
- Did this configuration consider visibility with the driver’s seat in full forward and aft positions?
- With a fully separate air/temperature supply, the designers should consider condensation on the bus operator barrier glass.
- Front door use may be limited to bus operators in future applications. Some passengers report a preference for boarding and disembarking at the rear doorway.
Concept B HVAC Manufacturer Feedback
- The main HVAC could be used with extra ducting to get at least 100 cubic feet per minute (cfm) to the driver for comfort with this design, allowing for air return and circulation.
- Testing may be required, but additional cooling for the driver could be accomplished with an in-duct damper.
Concept C HVAC Manufacturer Feedback
- A sealed cockpit will necessitate a method for depressurizing the enclosure to let in new conditioned air, meaning there will need to be some sort of return pathway.
- There may be an opportunity or need for a separate HVAC. This could be a stand-alone electric system or could be tied into the main HVAC.
- There may be a need to consider independent cooling and dehumidification for comfort; consider the effects of a well-sealed compartment with large amounts of glass.
- Consider that battery electric may require a glycol system for heat.
- Regarding air quality, consider the negative effects of some alternative air purifying solutions on passengers and interior components. Consider MERV-rated filters but be cautious about additional pressure on motors and remember regular maintenance.
General, Glazing Supplier Feedback
- Reflection on panels can be a major concern for implementing barriers on large fixed-route buses.
- Solutions to prevent glare are limited or non-existent for polycarbonate barrier materials, and therefore some larger agencies will use glass that offers some amount of anti-reflection but comes at a significant weight and expense.
- For operators of mid-size or smaller buses, using glass in barriers may not be recommended because the driver is sitting lower and the door may extend above their head.
- Following the FMVSS No. 205 standard is important for barrier strength and safety.
- For glazing to be bullet resistant it must be laminated, which would add significant weight to the door panel and would need to be part of a total redesign of the operator doors. Bullet resistance may be impractical on small to mid-size buses.
General, Bus Manufacturer Feedback
- It is important that implementers of bus operator barriers check compliance with ADA throughout the design process, from concept development to simulation to integration and installation, to make sure that the bus operator barrier does not interfere with handholds for ambulatory impaired passengers and that sufficient clearance is provided for passengers with mobility devices (e.g., wheelchairs).
- Inferior designs such as shower curtains or transparent vinyl sheets do not support the industry’s needs and are not relevant to bus operator barrier designs.
- Regulatory implications are important to consider when implementing bus operator barriers.
- Implementers need to carefully consider the types of materials used in bus operator barriers before making design decisions.
Concept A Bus Manufacturer Feedback
- Bus operator barrier designs developed for first-purchase buses can also be incorporated into existing buses as aftermarket.
Concept B Bus Manufacturer Feedback
- Clearances to handholds must be maintained at all positions of the bus operator barrier door.
- All positions and modes of the bus operator barrier door must be carefully considered in light of best engineering practices to identify possible part and component failures, effects, likelihood, and design mitigation (i.e., design failure mode and effects analysis).
- It is recommended that manufacturers consider designing this concept barrier and door on separate planes to ensure clearance for ADA wheelchairs and handholds.
Concept C Bus Manufacturer Feedback
- Concept C would require major vehicle redesign.
- The separate bus operator workstation compartment may require a smaller stand-alone HVAC unit over the bus operator.
- The replacement of mirrors with cameras has not been performed at any scale or been tested in the broader North American transit bus industry.
- The clearance at the front entryway may be insufficient for ramp and wheelchair access. If the front entryway is used for any passengers, handholds need to be provided for passengers.
- Transitioning to mid/rear door entry for passengers with disabilities may increase the required interaction with the bus operator instead of reducing it. The task of docking and loading required for ADA necessitates further study with stakeholders before the transit bus industry can move to a mid/rear door entry concept.
- The application of electronic fares at mid/rear door entry would be required for this concept.
- Emergency egress capability for bus operators in the event of a crash is an important feature.


