Incorporating Environmental Justice and Equity Principles: A Toolkit for Airports (2024)
Chapter: 3 Equity in Action: How-To Modules
CHAPTER 3
Equity in Action: How-To Modules
INSIGHT WARM-UP
![]() Key Themes and Content
Key Themes and Content
The content is organized into four modules: Self-Assess Equity Practice (Module 1), Seek Meaningful Stakeholder and Community Engagement (Module 2), Use Spatial Data, Methods, and Tools to Assess Environmental Justice and Equity (Module 3), and Embed and Institutionalize Equity (Module 4).
![]() Reference Materials
Reference Materials
A List of Resources is provided for each module. These resources offer a background, context, tools, and frameworks for incorporating equity and environmental justice data and principles into airport decision-making. The list of resources is intended to support decision-making, but the reader can use their own critical analysis to identify which tools fit the context of their specific decision-making process. The List of Resources provides additional sources and references beyond the works cited related to the module content.
An Appendix provides one-page summary tables that describe the browser-based mapping tools that can be used to evaluate environmental justice and equity. The Appendix is available separately on the National Academies Press website (nap.nationalacademies.org) by searching for ACRP Research Report 265.
![]() Self-Assess
Self-Assess
What data and information do you think is important to collect to better understand equity and environmental justice? What current planning frameworks or tools are you aware of that directly address equity and environmental justice? Have you seen any examples of these practices at airports?
LEARNING GOALS
Chapter 3 presents the Equity in Action: How-To-Modules, including four modules that provide actionable resources for airports. Readers will learn about current frameworks, tools, and approaches that address equity and environmental justice. Readers will also consider ways to incorporate them into airport decision-making.
The Toolkit contains four modules for incorporating environmental justice and equity into airport decision-making. The modular approach acknowledges the reality that airports of varying sizes and types have varying levels of staff and resource availability to conduct this work. The modules can function either independently or as a successive framework for considering various aspects of environmental justice and equity more holistically. It enables practitioners to identify and focus on the resources most applicable to their role and work, including airport staff of all experience levels.
Each module follows a similar general structure to provide continuity and anchoring points for the reader. The modules cover the following:
- What is the approach?
- Why is this approach important?
- What tools, frameworks, or strategies exist to accomplish the objectives?
- What are some limitations to the strategies?
- What are common pitfalls or challenges to implementing the strategies?
The four modules are organized as follows:
Module 1: Self-Assess Equity Practice suggests ways to develop airport decision-making processes that include input from impacted groups, improve institutional capacity to address equity gaps, and drive positive outcomes. | |
Module 2: Seek Meaningful Stakeholder and Community Engagement suggests ways to ensure airport stakeholder and community engagement processes meet community members where they are, share influence with community members as a part of the decision-making process, and acknowledge and reduce past and ongoing harm derived from inequitable decisions in transportation and airport planning. | |
Module 3: Use Spatial Data, Methods, and Tools to Assess Environmental Justice and Equity suggests ways for airport practitioners to use spatial data, methods, and tools to inform equity-centered decision-making. | |
Module 4: Embed and Institutionalize Equity suggests ways for airport practitioners to incorporate equity into airport plans and actions in a holistic manner by evaluating the organization’s values and governance systems, organizational structure, and decision-making processes. |
3.1 Module 1: Self-Assess Equity Practice
Equity self-assessments can be a valuable tool for airports looking to discover and resolve equity gaps both internally and externally. An equity self-assessment can range from inventory-building processes that simply identify equity gaps to strategy-building exercises for long-term interventions to address known equity gaps.
![]() Module 1 Focus
Module 1 Focus
Provide information to develop airport decision-making processes that include input from impacted groups and improve institutional capacity to address equity gaps and drive positive outcomes.
This section suggests techniques to incorporate input from underrepresented and oppressed groups of people. It discusses why airports should consider conducting equity assessments to prevent ongoing harm to environments and airport-impacted communities. It includes information about the economic sustainability implications associated with equity assessments. It includes recommended tools, processes, and evaluative strategies that can be deployed through airport planning.
3.1.1 What Is a Self-Assessment of Equity Practice?
As an initial step for evaluating existing conditions at an airport, a self-assessment could help identify where the airport currently stands and whether the organizational culture is conducive
to equitable outcomes. This information for implementing self-assessments for equity practices will provide a baseline from which airports can situate and frame ongoing and future equity outcomes. Self-assessing equity practices could help organizations determine the nature of decisions being made, key decision-making roles, and whether certain departments or individuals have agency when it comes to implementing changes. These items are critical for setting the groundwork to determine how to better incorporate environmental justice and equity into airport decision-making at various levels.
An organizational self-assessment of equity is a systematic evaluation of an organization’s practices, policies, and culture to determine the extent to which it promotes and achieves equitable outcomes for the workforce as well as the populations it serves. Organizational self-assessments involve examining various components within the organization and identifying areas that need improvement to achieve inclusive and equitable outcomes. A self-assessment of equity should always include an evaluation of the following:
- Impact of Policies and Procedures: Reviewing existing policies and procedures to assess if they inhibit or promote equitable outcomes. An internal assessment may include examining recruitment, hiring, promotion, and disciplinary practices to ensure fairness and minimize biases. An external assessment may include an examination of how equity has been defined, the nature of past and present community engagement, disparities resolved or exacerbated by organizational efforts, evaluative measures, and the extent to which community feedback has been incorporated into key decisions (Shields and Jennings 2013).
- Workforce Representation: Analyzing the diversity and representation within the organization, including employees at all levels, leadership positions, and decision-making bodies. This involves assessing whether traditionally underrepresented groups are adequately represented and if there are any barriers to their inclusion and agency (Clark and Kaehler 2006).
- Training and Development: Reviewing training programs and opportunities for skill development to ensure professional development leads to a workforce that can apply critical analysis to equity-related issues to achieve desired equity outcomes (Pun 2002).
3.1.2 Why Is a Self-Assessment of Equity Practice Important for an Airport Organization?
Airport owners self-assess equity in their planning, development, and operations practices for several reasons. First, assessing equity ensures that airports, as public-serving organizations, are committed to fairness and social justice. Transportation systems are essential to the public for accessing employment, education, health care, joy, commerce, and other opportunities. Many communities continue to experience disparities resulting from legacies of inequity and discrimination in transportation. Assessing equity builds institutional knowledge of the unique needs and challenges of underrepresented and negatively impacted communities and provides a structure to identify, address, and mitigate disparities. An equity framework helps ensure the redistribution of resources and investments that are necessary to reduce disparities and promote equitable outcomes. As discussed in Section 2.4, government agencies are also bound by regulatory requirements that mandate equity considerations in transportation planning (Collareno 2023). Conducting equity assessments ensures compliance with such regulations and helps prevent discrimination.
In addition to moral and regulatory reasons, self-assessment of equity enables risk management. Equity assessments provide an opportunity for agencies to deploy enhanced decision-making tactics that are rooted in a comprehensive understanding of how transportation decisions can impact different communities. Assessments help identify potential risks, such as unintended consequences or negative impacts, enabling agencies to make informed decisions that minimize
harm and promote positive outcomes. Another risk relates to the business case for transportation in general as the cost of travel is increasing, and positive public perceptions of travel experiences continue to wane. Because prioritizing equity in transportation planning demonstrates a commitment to serving the needs of all individuals within a community, effective equity assessments can assist with improving public perception and trust between airports, travelers, and the neighborhoods where airports are located.
3.1.2.1 The Risks Associated with Foregoing an Equity Self-Assessment
The failure of a public entity to plan for and assess equity can cause severe and irreparable harm to individuals. In the absence of equity planning and assessment, systemic inequities are, at best, tacitly accepted and unintentionally reinforced or, at worst, openly accepted and intentionally reinforced. For example, airports run the risk of perpetuating cycles of poverty through land use choices that deepen environmental harm and induce a decline in residential quality. Broadly speaking, land use and the built environment have long-term effects that can influence outcomes for multiple generations of families, notably perpetuating poverty and limiting socioeconomic mobility. It is now widely studied and known that low-wealth communities and neighborhoods inhabited by racialized people often bear the brunt of negative environmental impacts, such as air pollution, noise pollution, and lack of green spaces (Roberts et al. 2022). These communities may experience higher rates of respiratory illnesses, reduced quality of life, and decreased life expectancy. Inadequate consideration of equity perpetuates these disparities, leading to irreparable harm to public health and well-being.
To this end, perhaps one of the most harmful outcomes of inadequate equity planning is the overall breakdown and disruption of the social fabric of communities that rely on the functionality and economies associated with airports. When airports neglect equity in planning, it can lead to the fragmentation of communities. Lack of equity in planning decisions, hiring practices, and travel policies can isolate neighborhoods, stifle access to financial stability, and impede social connections. These disconnections can weaken the social fabric of a community, diminishing social cohesion and limiting opportunities for community engagement, cultural exchange, and mutual support. The resulting disintegration of social networks can have lasting negative effects on the public’s overall quality of life.
3.1.2.2 Environmental Justice Impacts Resulting from the Absence of Equity Assessments
Airport decision-making has had significant implications for environmental justice in past and present contexts. Racialized and low-wealth communities bear the brunt of these adverse impacts. For example, the decision to build Chicago’s O’Hare International Airport resulted in the displacement of thousands of families, primarily from predominately Black neighborhoods such as the Woodlawn community (Forbes 2017). These communities experienced severe economic and social dislocation as a consequence of this decision. Similarly, the expansion of Los Angeles International Airport in the 1960s and 1980s had adverse effects on neighboring communities, particularly those with a high proportion of racialized and low-wealth residents (Westerdahl et al. 2008). The expansion led to increased air and noise pollution, negatively impacting the health and well-being of residents in areas such as Lennox, Inglewood, and Westchester. Moreover, airport decision-making has often neglected the humanity and interests of Indigenous communities. The construction of Denver International Airport in the 1990s displaced the Indigenous community of Adams County, Colorado, disrupting their cultural and historical ties to the land (Goetz and Szyliowicz 1997). In New York City, the expansion of John F. Kennedy International Airport has had adverse effects on communities such as South Ozone Park and Howard Beach (Bloom 2015). These predominantly low-wealth neighborhoods have experienced increased noise pollution and air quality degradation due to airport operations.
In Atlanta, the expansion of Hartsfield-Jackson Atlanta International Airport has disproportionately affected communities such as College Park and East Point (Rissman et al. 2013). These predominantly Black communities have experienced increased noise pollution, displacement, and economic disinvestment because of the airport’s growth.
To avoid such impacts on environmental justice, future airport planning could prioritize assessing the extent to which surrounding communities are already experiencing environmental injustices, and those assessments could inform mitigation measures to reduce typical impacts, such as noise and air pollution, while also addressing the unique challenges that can amount from having multiple city and transportation planning processes converge on a single community at one time. For example, an equity assessment may reveal a community’s disproportionate exposure to transportation noise that could be mitigated through measures such as noise barriers, sound insulation programs, and aircraft noise abatement procedures. These measures are intended to help alleviate the effects of noise pollution derived from transit and airports on nearby communities. If an equity assessment reveals disproportionate exposure to transportation noise or air emissions from multiple transportation modes, the airport can collaborate with other relevant agencies to share information so that nonaviation sources of environmental injustice can also be addressed.
Additionally, equity assessments could lead key decision makers to consider alternative energy sources and sustainable infrastructure that can help minimize environmental harm and contribute to a more equitable distribution of benefits. Such interventions could involve investing in renewable energy projects, electric ground transportation systems, green stormwater infrastructure, and green building practices within and around airport facilities.
To ensure environmental justice in the future, airport decision-making must also recognize and respect the rights and interests of Indigenous communities. To this end, equity assessments are an essential step within a broader process that involves Indigenous communities in the planning process, respecting their traditional knowledge and establishing partnerships that prioritize their well-being to help rectify past injustices and prevent further harm.
3.1.2.3 The Business Case for Airport Equity Assessments
Airports play a critical role in facilitating global connectivity and driving economic growth. Given the importance of having an accessible and optimally functioning global airport system, the aviation industry is beginning to explore the extent to which addressing environmental impacts and concerns over equity and social justice would enhance the economic vitality of the aviation sector. Furthermore, even amid multiple economic crises over the past several decades, air transport has doubled in size every 15 years (Åkerman 2005). The continued growth of air transport means key airport stakeholders are looking to maintain the benefits of the positive trend in ways that are sustainable and resilient to frequently changing sociopolitical and economic dynamics. The growth trend has also heightened awareness and apprehension among communities near airports regarding the likelihood that social inequities may be exacerbated by rapid growth in air transport. To that end, environmental and equity assessments enable airports to identify and mitigate potential risks while capitalizing on opportunities for sustainable development.
By proactively considering environmental and equity factors, airports can align their operations with societal and stakeholder expectations. For example, San Francisco International Airport has demonstrated the economic benefits of environmental and equity assessments through various initiatives (Greer et al. 2020). By implementing energy-efficient technologies, waste management programs, and sustainable transportation options, the airport has achieved substantial cost savings and operational efficiency improvements. Additionally, the airport’s commitment
to equity considerations has led to enhanced community relations and stakeholder engagement. These efforts have bolstered San Francisco International Airport’s reputation, attracting airlines and passengers while contributing to the local economy. More specifically, airports are likely to see increased economic stability as a result of equity assessments. Economic sustainability is achieved when revenue and the allocation of resources happen efficiently and when the benefit of an endeavor outweighs the costs associated with it. Such benefits can be measured as monetary resources and nonrenewable resources, like environmental benefits and benefits to human interaction (also known as social capital). Hockerts (1999) theorized there are three components of corporate sustainability: economic, environmental, and social. Hockerts’s theory purports that to focus solely on economic sustainability may yield immediate-term benefits, but environmental capital and social capital are equally important for long-term sustainability.
3.1.3 What Tools or Frameworks Can My Airport Use to Assess Equity Practice?
A myriad of tools and frameworks can be used to assess cultural relevance and institutional capacity to address equity issues and drive improved outcomes. Through an airport-centric framework of typical functions, processes, and decisions that currently exist in the airport environment, this module provides suggestions for incorporating environmental justice and equity principles and data into airport decision-making. In particular, this subsection outlines assessment tools organizations across the United States are currently using to understand and build capacity for advancing equity through their planning efforts. The tools are organized into tables that highlight the limitations and gaps inherent in the tools; the tables are organized into five areas of focus:
- Practices that lead to equitable outcomes;
- Frameworks for improving capacity for diversity, equity, and inclusion (DEI);
- Developing equity plans;
- Tools for identifying inequities; and
- Selecting and using the appropriate tool, including designing an equity self-assessment and the fuzzy expert system.
Each tool defines and measures equity differently, but there are some similarities among factors that agencies consider to develop the metrics that define success.
3.1.3.1 Practices That Lead to Equitable Outcomes
The tools and frameworks presented in this section and summarized in Table 3-1 are examples of approaches to developing and evaluating practices that lead to equitable outcomes.
The Healthy Airport Regions conceptual framework and Minnesota Department of Transportation (MnDOT) Equity Lens Framework provide practical guidance that can be adapted at scale for airports of various capacities. The Evaluation of Corporate Social Responsibility Performance in Air Transport Enterprise offers a social responsibility framework that is not firmly rooted in equity or transportation justice but still provides a viable first step in the direction of equity for jurisdictions that are still adapting to equity as a concept (Dimitriou 2020). The U.S. DOT’s Next Generation Scenario Planning Report uses scenarios to help agencies apply real-world examples to their equity-related decision-making processes (Ange et al. 2017).
Many transportation agencies have begun to create their own equity action plans. Such plans tend to include high-level values that agencies purport to superimpose across decisions being made throughout the organization’s operations and planning processes. Some focus on improving health impacts, while others focus on preventing widely discussed noise pollution. Health and
Table 3-1. Examples of self-assessment tools that lead to equitable outcomes.
| TOOL TITLE | ORGANIZATION | FEATURES | DESCRIPTION |
|---|---|---|---|
| Healthy Airport Regions – A Conceptual Framework (de Leeuw et al. 2018) | Centre for Health Equity Training, Research and Evaluation | Criteria for “Urban Health Settings;” Dimensions of a Healthy Airport | Purpose: Conceptual framework that “identifies twelve dimensions across seven geospatial levels to drive the development of airports as engines of health.” The framework is inspired by the World Health Organization’s “Healthy Settings” and “Social Determinants of Health” frameworks. The framework emphasizes engagement of all stakeholders, including “travelers, visitors, fly-in-fly-out staff, local communities, stationary workers, and aviation personnel.” |
| Evaluation of Corporate Social Responsibility Performance in Air Transport Enterprise (Dimitriou 2020) | Democritus University of Thrace | Examples of social goals; sample criteria for stakeholder perspectives; evaluation framework | Purpose: Tool that can be used to help balance the “triple bottom line” by analyzing “how the company has integrated perception of its position in society through a balanced relationship with the 3Ps concept”a as well as by assessing the effectiveness of long-term sustainability plans. |
| Applying the Equity Lens Framework (MnDOT, n.d.) | Minnesota Department of Transportation | Guided principles; targeted questions; key terms | Purpose: Framework that provides a “starting point to guide planning and development discussions” regarding equity. The framework should be supported with agency-wide dialogue in order to be optimally effective. |
| ACRP Report 147: Climate Change Adaptation Planning: Risk Assessment for Airports (Dewberry et al. 2015) | Transportation Research Board | Data analysis support | Purpose: Report that supports airports with evaluating the potential risks of climate change and sea level rise. |
| The Next Generation Scenario Planning Report: A Transportation Practitioner’s Guide (Ange et al. 2017) | U.S. DOT, Federal Highway Administration | Sample scenarios; decision-making guide | Purpose: Guidance on how to “scope and design a scenario planning process to best meet the needs or challenges of a community or organization.” This guide can help airport decision makers think more holistically, break from past trends, and work with stakeholders and the community collaboratively to identify goals and needs that can lead to more equitable outcomes. |
| Multicriteria Decision Support Methodology for Evaluating Airport Expansion Plans (Vreeker et al. 2002) | The Tinbergen Institute | Decision-making methodology | Purpose: Methodology that provides “a systematic and polyvalent multicriteria approach to many actual planning issues, such as land use or transportation.” |
| IATA Toolkit on Airport Governance (Reece and Robinson 2020) | International Air Transport Association | Best practices guide | Purpose: Tool “to create value for the aviation industry and the communities it serves through a clear framework and decision-making tools for airport governance that are robust and actionable.” |
aThe triple bottom line includes social, environmental, and financial aspects of accounting, otherwise known as the 3Ps–people, plant, and profit.
environmental impacts are certainly equity-related concerns; however, it is important that the processes and tools being used also consider broader impacts to the lived experiences of nearby residents. Additionally, the absence of equity-related tools geared toward improving the travel and lived experiences of people with disabilities and transgender people is a large gap in the equity framework that is currently taking root in the transportation sector. Without such assessments, progress toward equitable outcomes is futile.
There are several tools and frameworks that do not particularly center equity but could allow agencies to better understand the impacts of their policies and procedures. However, such tools often rely on a net-positive framing, which reproduces marginality. Net-positive framing emphasizes the positive outcomes, benefits, or impacts of a particular action, policy, or project. It involves highlighting the potential gains, advantages, or added value that can result from a given initiative. Such an approach comes at the expense of identifying negative impacts or costs. For example, in the context of sustainability, net-positive framing may involve highlighting the environmental benefits of a company’s activities rather than solely focusing on reducing its ecological footprint. Examples of tools that can be incorporated into a self-assessment to evaluate the degree of equity in outcomes are offered in Table 3-1.
3.1.3.2 Building Capacity for Diversity, Equity, and Inclusion
DEI provides a baseline framework for achieving equitable outcomes, often with respect to an organization’s workforce. Building organizational capacity for DEI allows key decision makers to set a foundation upon which social justice and racial justice goals can be built and achieved. While DEI efforts are crucial for promoting fairness and representation within transportation agencies, they alone are not sufficient to achieve truly equitable outcomes. Because DEI efforts often focus on addressing individual biases and ensuring representation, DEI training and development programs often fall short of addressing or improving the transportation inequities that stem from deep-rooted structural issues, such as historical discrimination, systemic racism, and socioeconomic disparities. Additionally, merely diversifying the workforce or including underrepresented voices does not automatically challenge power dynamics within transportation agencies. True equity necessitates addressing and transforming organizational structures, decision-making processes, and power imbalances that perpetuate inequities.
Finally, to ensure progress toward equity, transportation agencies must establish mechanisms for ongoing monitoring, evaluation, and accountability. Metrics and indicators are needed that go beyond diversity numbers and include measures that capture equity outcomes, such as accessibility improvements, reduced disparities, and increased community satisfaction. To that end, transparency and reporting on progress are essential to internal accountability and self-assessments regarding equity. Examples of frameworks for improving capacity for DEI are offered in Table 3-2.
The AWC [Association of Washington Cities] Equity Resource Guide is a tool to support transportation agencies with their efforts to improve internal capacity for DEI (AWC 2021). The guide offers case studies that inspire strategies for building capacity for DEI and is supplemented by a resource guide that practitioners can keep on hand to refresh their memories regarding core DEI concepts.
TCRP Research Report 228: Resource Guide for Improving Diversity and Inclusion Programs for the Public Transportation Industry was developed by independent researchers for the Transit Cooperative Research Program (TCRP) (Keen et al. 2021). The report includes a Toolkit and an Implementation Guide that can be used by airport decision makers to expand and evaluate the capacity for DEI. It is important to note that the nature of DEI is fluid and ever-evolving. So, while TCRP Research Report 228 was published in 2021, it is likely that some of the concepts and recommendations require nuanced consideration to ensure they are still contextually relevant in the present sociopolitical climate.
Table 3-2. Examples of frameworks for improving capacity for DEI.
| TOOL TITLE | ORGANIZATION | FEATURES | DESCRIPTION |
|---|---|---|---|
| AWC Equity Resource Guide: Tools and Case Studies for Washington Cities (AWC 2021) | Association of Washington Cities | Case studies; resource guide | Purpose: Guide that provides planning practitioners with a baseline understanding of success metrics for DEI and the historical context from which the concepts derive. |
| TCRP Research Report 228: Resource Guide for Improving Diversity and Inclusion Programs for the Public Transportation Industry (Keen et al. 2021) | Transportation Research Board | Diversity and inclusion toolkit and recommendations; guidance for implementation of diversity and inclusion programs | Purpose: Report that provides an overview of “how diversity programs at transit agencies have evolved; how inclusion has been incorporated; and what policies, plans, and practices have been successfully implemented within the industry.” The report also includes “a resource guide to assist the public transportation industry as transit agencies of different types and sizes implement or improve diversity and inclusion programs.” |
| ACRP Research Report 217: Guidance for Diversity in Airport Business Contracting and Workforce Programs (Krop et al. 2020) | Transportation Research Board | Resource includes the guidebook, Airport Diversity Contracting Tool, and a Tool Users Guide | Purpose: Report that “provides guidelines to assist airport operators and various stakeholders at airports of all types and sizes to identify and quantify the benefits, costs, and regional economic impact of diversity contracting for airport businesses.” |
ACRP has also published two guidebooks to assist airports to develop or improve DEI in their contracting and concessions programs. The more recent publication is listed in Table 3-2.
3.1.3.3 Developing Equity Plans
Racial equity plans can serve as self-assessment instruments that offer results-based accountability framing for airport agencies. Examples of racial equity plans are offered in Table 3-3.
The Wilmington Area Planning Council (WILMAPCO)Transportation Justice Plan combines environmental equity with accessibility and racial equity considerations to inform a set of planning and prioritization recommendations (WILMAPCO 2019). One notable consideration is the emphasis the plan places on language access. Language access plays a vital role in airport planning as it ensures equitable and inclusive services for individuals who do not speak or understand the dominant language. By prioritizing language access, airports can provide clear and effective communication through multilingual signage, announcements, and customer service support.
The San Francisco International Airport (SFO) Racial Equity Action Plan is unique because it is derived from a local mandate (as opposed to an agency-derived objective) (SFO 2020). Often, practitioners speculate that racial equity work is difficult to plan and implement from within their agencies because equity-related work is viewed as a nontechnical, nonessential component of the work. The SFO plan provides helpful insight into the depth of planning that can go into an agency’s racial equity plan when the work is motivated by a mandate. Similarly, the Atlanta Resilient Cities report was motivated and resourced by an external partner (City of Atlanta, n.d.). The Atlanta Resilient Cities framework provides another example of the depth of planning that can be undertaken when the work itself is resourced and guided by an entity that is especially working in the interest of achieving equity.
Table 3-3. Examples of equity planning frameworks.
| TOOL TITLE | ORGANIZATION | FEATURES | DESCRIPTION |
|---|---|---|---|
| 2019 Transportation Justice Plan: A Title VI, Environmental Justice, Americans with Disabilities Act, and Language Assistance Plan for the WILMAPCO Region (WILMAPCO 2019) | Wilmington Area Planning Council (WILMAPCO) | Progress prioritization process; stakeholder collaboration guidance; urban technology deserts guidance; public participation plan | Purpose: The plan is an example of planning for transportation equity. The plan relies on environmental justice principles and equity contexts that are relevant to the plan’s region. The plan also incorporates Title VI of the Civil Rights Act, Language Assistance, and ADA frameworks. |
| San Francisco International Airport Racial Equity Action Plan Phase 1: Internal Programs and Policies (SFO 2020) | San Francisco International Airport (SFO) | Development process; methodology for identifying focus areas | Purpose: In 2019, the City and County of San Francisco’s Office of Racial Equity (ORE) was created by the San Francisco Board of Supervisors “in response to the City and County of San Francisco’s growing racial disparities.” One of the initial tasks the ORE assigned to City and County agencies was to establish a three-phase racial equity plan. SFO’s Racial Equity Action Plan “provides a blueprint for advancing racial equity in all aspects of the department’s work.” |
| Resilient Atlanta: Actions to Build an Equitable Future (City of Atlanta, n.d.) | The Rockefeller Foundation 100 Resilient Cities, Atlanta Team | City resilience framework; approach to community-driven focus areas | Purpose: The Rockefeller Foundation’s 100 Cities initiative was created to help cities adapt to socioeconomic challenges. Member cities received resources for drafting a resilience strategy. The Atlanta Resilient Cities team “worked with over 7,000 Metro Atlantans to develop a clear, actionable set of initiatives that articulate their aspirations for the city’s future.” This report outlines the strategy, which places a great deal of emphasis on racial and social equity. |
| Pathways to Equity at Scale: A Synthesis of the 2022 Federal Equity Action Plans and Recommendations for 2023 Plans (Balu et al. 2023) | The Urban Institute | Rubric of equity principles; qualitative analysis; recommendations | Purpose: This briefly reviews the commitments made in 24 federal agency equity action plans generated in response to the Biden administration’s 2021 E.O 13985, Advancing Racial Equity and Support for Underserved Communities through the Federal Government. “It categorizes equity commitments into different types of equity concepts and actions, shares agency-specific examples, and proposes recommendations for agencies’ equity planning.” |
Finally, the report produced by the Urban Institute offers a comprehensive analysis of equity plans in federal agencies that were mandated by E.O. 13985 (Balu et al. 2023). The recommendations included in the Urban Institute report can be adapted at the airport agency level to inform an approach to developing a local racial equity plan for airport planning.
3.1.3.4 Identifying Inequities
It is crucial for any airport operator conducting an equity self-assessment to adequately identify inequities to gain a comprehensive understanding of the existing disparities and inequalities within or resulting from their operations, policies, and services. Having such knowledge allows airport decision makers to prioritize and allocate resources effectively and, ultimately, to reevaluate existing policies and practices that contribute to inequities and implement alternative approaches that promote fairness, inclusivity, and equal access. Examples of tools for identifying inequities can be found in Table 3-4.
ACRP Report 221: Measuring Quality of Life in Communities Surrounding Airports lays out a methodology that airports can use to evaluate the quality of life of those who are living near or directly impacted by airport decisions and processes (Preston et al. 2020). Understanding the impacts airport decision-making could have on the quality of life of nearby residents provides airports with the context necessary to proactively implement mitigation measures to minimize negative effects and improve the overall living conditions of nearby residents. Being aware of the impacts on the quality of life also allows airports to engage in meaningful dialogue and collaboration with affected communities. Hauptvogel et al. (2023) provide an example of a methodology that helps identify equity issues as a matter of quality of life. This method situates impacts as stressors and provides a framework for qualitative analysis of quantifiable impacts, such as noise pollution, and the ways those impacts pose equity issues from a subjective standpoint.
Table 3-4. Examples of tools for identifying inequities.
| TOOL TITLE | ORGANIZATION | FEATURES | DESCRIPTION |
|---|---|---|---|
| ACRP Research Report 221: Measuring Quality of Life in Communities Surrounding Airports (Preston et al. 2020) | Transportation Research Board | Methods; sample indicators; scoring mechanism; analysis guidance | Purpose: A method for assessing an airport’s impact on the quality of life in surrounding neighborhoods. This kind of assessment aims to offer a holistic view of the ways airports impact (positively or negatively) the lived experiences of people living nearby. |
| A Fuzzy Expert System for Aviation Risk Assessment (Hadjimichael 2009) | Naval Research Laboratory, Marine Meteorology Division | Risk assessment framework; guidance for drawing inferences; guidance for developing the model | Purpose: This report explains the utility of the Flight Operations Risk Assessment System (FORAS)– “a risk modeling methodology, which represents risk factors and their interrelationships as a fuzzy expert system.” The model allows practitioners to establish a quantitative risk index of the cumulative effects of potential hazards on a single flight operation. FORAS systematizes qualitative knowledge and “automates the process of risk assessment.” Although this framework is intended for assessing risk associated with flights, the methodology itself can also be applied to assess the cumulative equity-related risks derived from airport planning decisions and operations. |
| TOOL TITLE | ORGANIZATION | FEATURES | DESCRIPTION |
|---|---|---|---|
| Being a Fair Neighbor—Towards a Psychometric Inventory to Assess Fairness-Related Perceptions of Airports by Residents—Development and Validation of the Aircraft Noise-Related Fairness Inventory (fAIR-In) (Hauptvogel et al. 2023) | Independent research | Framework for determining fairness; criterion variables to test predictive validity | Purpose: “This paper describes the development of the Aircraft Noise-related Fairness Inventory (fAIR-In) and examines its factorial validity, construct validity, and predictive validity.” The fAIR-In is a psychometric instrument based on a theory that suggests that noise impacts should be viewed and treated as a stress response, and the degree of stress depends on whether those being impacted perceive the noise as something that can be controlled or mitigated (cognitive control). |
| Screening Tool for Equity Analysis of Projects (FHWA, n.d.-b) | FHWA, U.S. DOT | Estimates of socioeconomic dynamics in the project area | Purpose: The “Screening Tool for Equity Analysis of Projects” is an extension of FHWA’s HEPGIS web application that permits rapid screening of potential project locations anywhere in the United States to support Title VI, environment justice, and other socioeconomic data analyses.” Users can specify project locations by selecting existing highway segments and Title VI, and environmental justice summaries will be generated for the project area. |
| Planning and Equity Tool (FHWA, n.d.-a) | FHWA, U.S. DOT | American Community Survey (ACS) datasets from the U.S. Census Bureau | Purpose: “The ‘Planning and Equity Tool’ enables transportation agency users to view their transportation improvement program (TIP) projects with available national, equity-related data sets. The tool is primarily targeted toward users from transportation agencies with little-to-no GIS (geographic information systems) capabilities or resources.” |
| Racial Equity Impact Assessment (Keleher 2009) | Race Forward | Sample questions to inform negative impact prevention measures | Purpose: A systematic assessment of the ways certain racial and ethnic groups will be impacted by an action. The results of this assessment can inform strategies to prevent negative impacts and prevent the reproduction of structural racism. |
The U.S. DOT tools in this section—the “Screening Tool for Equity Analysis of Projects” and the “Planning and Equity Tool” (FHWA, n.d.-b, n.d.-a, respectively)—aggregate equity-related datasets to produce profiles regarding defined project areas to inform awareness of and strategies for addressing equity gaps through land use decision-making. These types of tools provide a baseline snapshot of ongoing and potential impacts, but the findings cannot stand on their own. A critical analysis of the tools’ findings should ultimately inform any decisions in the project area; analyzing root causes, compounding factors, and cultural context should also be elements of an airport planning process. Race Forward’s “Racial Equity Impact Assessment” tool can serve as an additional supplement, providing broader conclusions regarding likely impacts on racialized communities based on the common ways certain racialized groups experience oppression (Keleher 2009).
“A Fuzzy Expert System for Aviation Risk Assessment” provides an example of a methodology that assesses risk factors through their interconnectedness to one another (Hadjimichael 2009). While the report itself discusses in-flight risks, such a methodology serves as a valuable example of a quantitative analysis that produces findings based on cumulative impacts. When it comes to equity gaps, such a methodology would help understand the cumulative impacts of risks airport decisions may pose.
3.1.3.5 Selecting and Using the Appropriate Tool
This section provides a recommended approach to determining which tools to use and when while conducting an equity self-assessment. Prior to identifying equity metrics, decision makers will want to understand the universe of tools that are available and which types of equity-related metrics are most relevant to the planning context at hand. Conducting an equity self-assessment is a very broad intention. Consider narrowing the intention to equity impacts associated with a specific internal or external group; a category of equity impacts such as disability, gender, or race; or the available capacity for responding to the findings that may derive from the equity self-assessment. It is also important to consider who will be conducting the analysis and any capacity gaps or biases that may influence or skew the results of the inquiry.
Table 3-5 offers questions to reflect on while designing an equity self-assessment methodology. The left column provides possible answers for an example scenario. Table 3-6 presents a summary of the Fuzzy Expert System Method and suggests the tools that could be used for the example scenario. This method requires practitioners to have a baseline understanding and familiarity with data analysis and the ability to think critically to apply a novel analysis method to transportation decision-making.
3.1.4 What Are the Limitations of a Self-Assessment?
Equity-related self-assessments are limited to the subjective will of the person(s) responsible for analysis and the organization’s capacity to be responsive to what is identified through the assessment. Limitations include the ethical sense of urgency regarding equity gaps and the need to adopt near-term interventions while long-term solutions are being developed. It is also worth noting that the data used in self-assessments have their own equity gaps and objectivity risks. Last, one major challenge with assessing equity is that agencies often look to quantitative frameworks to address sociological and qualitative dynamics. This could lead to systemic neglect of certain equity issues that are not immediately quantifiable. These limitations mean that the results of an equity self-analysis should be validated through multiple methods/frameworks prior to decisions being derived from the assessments.
3.1.4.1 Institutional Capacity
The capacity to identify, acknowledge, and respond to equity gaps will play a critical role in an airport’s ability to achieve and assess equity goals. Airports and transportation agencies
Table 3-5. Example framework for designing an equity self-assessment.
| REFLECTION PROMPT | EXAMPLE RESPONSE |
|---|---|
| Stage 1: Establish the needs and intentions that are motivating the self-assessment. | |
| Purpose: What type of information are you seeking? What do you want to learn about your impact on equity outcomes? | The airport is concerned about housing instability in the nearby neighborhood following the recent announcement of an airport expansion project. The expansion project is the motivation behind several other planning efforts, which include a new transit station and transit-oriented housing development. A group of older adults are concerned that their homes fall within the path of sought-after right-of-way. Younger residents fear the new housing being built in the area will cause rents to increase drastically over a short period of time. |
| Process: What decision-making or planning process will this assessment influence? | Antidisplacement planning, hiring practices, implementation planning, and interagency coordination. |
| Audience: Who will see this? Who does this assessment serve? | Internal document that may be used in future funding applications. |
| Stage 2: Clarify the scope of self-assessment. | |
| Questions: What type of equity outcomes are you looking to assess? Which group(s) are most likely to be impacted by the equity gaps identified in your assessment? | How will airport expansion influence the nearby housing market? Who will most likely be displaced? What additional equity impacts could be exacerbated by the outcome of this project? |
| Data: What data is needed to answer the questions? | Rent/housing burden data; existing/compounding disparities in the project area; demographic data. |
| Method: What methodological approaches could help answer the questions? | Identifying inequities; developing equity plans; applying practices that lead to equitable outcomes. |
| Stage 3: Document the capacity and resources available to analyze the assessment findings. | |
| Capacity: What resources (time/money/personnel) will be made available to respond to/address the findings derived from the assessment? | No prior engagement with city/county agencies working in housing contexts, funding strictly for implementation and cannot be used to directly benefit nearby residents, limited time available for community engagement. |
| Staff capacity: What ideologies, identities, and perspectives could influence the person(s) responsible for analyzing the assessment findings? | Staff do not live in project area and do not have a meaningful connection to the residents and their experiences. Limited training regarding equity and housing impacts, polarizing political climate. |
embarking on new or innovative community engagement and equity practices could encounter personnel challenges, fiscal considerations, and policies that inhibit the ability to intervene on equity-related issues (Cohen and Shaheen 2024). These potential limitations are not unique to airports. Rather, most organizations taking on new institutional frameworks will experience what theorist Larry Greiner referred to as various crises of growth (Greiner 1997). According to Greiner’s theory, organizations go through different stages of growth, each characterized by a set of challenges and crises. One of these stages, the “lack of autonomy,” is particularly relevant to the limited-capacity scenario. During the lack of autonomy stage, an institution faces limitations
Table 3-6. Summary of a fuzzy expert system method.
| BASIC INFORMATION | |
|---|---|
| Owner | Dr. Lotfi Zadeh introduced the concept of fuzzy logic in the 1960s while employed at the University of California in Berkeley. |
| Purpose of the Tool | The fuzzy expert system is a form of problem-solving using a series of yes or no answers to try and solve a problem. Fuzzy expert systems are not logically rigid and allow for answers that are not as clear-cut as yes or no. Instead, for example, findings within the analysis can be categorized as true, partially true, false, or partially false. |
| Guide | “Characterizing Urban Landscapes Using Fuzzy Sets” (Gopal et al. 2016). |
| METHODOLOGY OVERVIEW | |
| Methodology |
Note that this tool is best suited for use by data analysts. Please consult Gopal et al. 2016 for additional details.
|
in terms of resources, infrastructure, and decision-making authority. These constraints can significantly impede the ability of implementing staff to prioritize and allocate resources toward equity-related goals. Limited funding, staffing, or technological resources may also hinder the implementation of initiatives aimed at promoting equity within the organization or its surrounding communities. Furthermore, the lack of autonomy stage can hinder an airport’s capacity to assess equity-related goals. Insufficient data collection systems, evaluation mechanisms, or analytical tools may prevent the institution from effectively measuring and evaluating the impact of its equity efforts. Without adequate assessment, the institution cannot accurately determine the progress made toward achieving equity-related goals or identify areas requiring improvement. Additionally, the lack of autonomy can result in competing priorities or resource allocation challenges. An airport with limited capacity may find it difficult to balance the demands of day-to-day operations with the long-term commitment to equity. This struggle can lead to a lack of sustained effort, inconsistency, or incomplete implementation of equity-related initiatives, further impeding progress toward achieving equity goals.
To overcome these limitations, airports need to recognize the importance of building capacity specifically focused on equity-related efforts. This may involve securing additional resources, both fiscal and human, to support equity initiatives. Developing robust data collection and assessment systems can provide the necessary information to track progress and identify areas of improvement. Moreover, fostering a culture that values equity and diversity can help ensure that equity-related goals remain a priority within the institution’s decision-making processes. Section 3.4.3 identifies strategies that airports can utilize to embed and institutionalize equity within their organizations.
3.1.4.2 Equity Gaps Inherent in Tools
The assumptions made during the development of equity assessment methodologies and the blind spots in available data used during the implementation of equity assessment methodologies create unavoidable limitations when analyzing the findings derived from equity self-assessments. First, equity assessment tools require establishing specific methodologies to measure and evaluate equity-related indicators. However, these methodologies often rely on assumptions about what constitutes equity and how it can be quantified. Different stakeholders may have varying perspectives on equity, leading to diverse interpretations and potential biases in the tool’s design. Additionally, the tool’s creators may have limited understanding or awareness of the unique contextual factors influencing equity, particularly in the context of airport operations and planning, which can limit the tool’s effectiveness within airport settings. Next, equity assessment tools heavily depend on available data sources, which may have inherent equity gaps or limitations. Data might be incomplete, biased, or lacking in granularity, making it challenging to capture the full complexity of equity issues. Certain underrepresented groups may also be underrepresented in the available data, leading to inaccurate or incomplete assessments. Moreover, data gaps may exist regarding specific dimensions of equity, such as intersectionality, which can hinder a comprehensive understanding of the diverse experiences and needs of different communities.
Even with robust methodologies and data, equity assessment tools are subject to interpretation bias by the evaluators. Evaluators may bring their own biases or assumptions, consciously or unconsciously, when interpreting the assessment results. These biases can influence how equity gaps are identified, prioritized, and addressed. The subjective nature of interpretation can result in inconsistencies or limitations in the tool’s ability to capture the nuances and complexities of equity challenges. Finally, equity is not a static concept but rather a dynamic and evolving process influenced by societal changes, power dynamics, and contextual factors. Equity assessment tools may struggle to capture this dynamic nature, as they often rely on static measures and indicators. The tools may not adequately account for shifts in equity considerations, emerging inequities, or changes in community needs over time.
To mitigate these limitations, it is important to approach equity assessment tools with a critical mindset. Practitioners should recognize that the tools provide valuable insights but are not infallible. Stakeholder engagement, diversity of perspectives, and ongoing dialogue can help address the limitations of assumptions in methodology development. Moreover, understanding the limitations of available data and actively working toward more robust data collection and management efforts can enhance the accuracy and inclusiveness of equity assessments. Regular reviews and updates of assessment methodologies are also necessary to adapt to evolving understandings of equity and address emerging equity gaps.
3.1.4.3 Narrow Quantitative Framing
The narrow quantitative framing commonly found in equity self-assessments can pose limitations for institutions seeking to close equity gaps. By relying solely on quantitative data and metrics, these assessments may overlook important qualitative dimensions of equity and fail to capture the full complexity of inequities and their underlying causes. This narrow framing can hinder a comprehensive understanding of the lived experiences, perspectives, and systemic factors that contribute to inequities.
To overcome this limitation, equity self-assessments can be supplemented with qualitative methods and approaches. Qualitative data collection methods, such as surveys, interviews, focus groups, and community consultations, allow for in-depth exploration of individual experiences, community narratives, and the contextual nuances surrounding equity gaps. These methods provide valuable insights into the social, cultural, and structural factors that perpetuate inequities,
shedding light on the root causes that quantitative data may not fully capture. Moreover, incorporating participatory and collaborative approaches can enhance equity self-assessments. This participatory approach ensures that the assessment reflects the lived experiences and diverse voices of those most impacted by inequities, thus providing a more accurate and inclusive assessment.
In addition to qualitative methods and participatory approaches, it is important to adopt an intersectional lens in equity self-assessments. Intersectionality recognizes that individuals may experience multiple forms of oppression and discrimination simultaneously. By considering the intersectional nature of inequities—such as race, gender, socioeconomic status, ability, and more—in the assessment, airports can emerge from their assessments with a broader perspective and a more comprehensive analysis of equity gaps that can inform targeted strategies to address them.
3.1.5 What Are Common Pitfalls or Challenges to Implementation of a Self-Assessment?
Institutional equity self-assessments can encounter several common pitfalls that hinder their effectiveness. One pitfall is the lack of a well-defined and evaluable baseline notion of equity. Without a clear understanding of what equity means for the institution and how it can be measured, it becomes challenging to track progress and drive organizational change. Establishing a baseline notion of equity provides a benchmark against which to assess current conditions, identify gaps, and set goals for improvement. Another pitfall is the framing of vulnerability in a way that is culturally and geographically irrelevant. It is crucial to avoid villainizing or dehumanizing impacted communities during the analysis. To avoid this, equity assessments should consider the social, cultural, and historical context of the communities being assessed. By framing vulnerability in a sensitive and culturally relevant manner, the assessment acknowledges the systemic factors contributing to inequities without stigmatizing or blaming the affected communities. This approach fosters a more inclusive and respectful analysis and ensures that the assessment process does not perpetuate harm or exacerbate existing power imbalances.
Next, outsourcing equity analyses to external consultants can also be problematic. While consultants can bring valuable expertise, outsourcing can lead to consultant codependence, where institutions become reliant on consultants to conduct equity analyses and manage community harm. This codependence can hinder agencies from developing in-house capacity and sustainable practices for addressing equity issues. Additionally, an overreliance on consultants can perpetuate a planning and budgeting approach in which funding availability determines the prioritization and sustainability of equity initiatives. A reliance on external funding sources or grants may undermine the agency’s ability to respond effectively to community crises and sustainably manage community harm.
To address these pitfalls, institutions have an opportunity to prioritize building internal capacity for equity analyses and developing a shared understanding of equity that aligns with their organizational goals and values. This internal capacity can be nurtured through training, developing staff, and establishing dedicated equity teams or positions within the organization. Additionally, the assessment process should engage and involve community members directly, ensuring their meaningful participation in the analysis and decision-making processes. Furthermore, airports should strive for long-term planning and budgeting that prioritize equity as a core value rather than relying solely on grants and external funding. This involves integrating equity considerations into all aspects of the organization’s operations, policies, and decision-making processes, and establishing sustainable funding mechanisms for equity initiatives.
3.2 Module 2: Seek Meaningful Stakeholder and Community Engagement
Meaningful stakeholder and community engagement is an essential component of equity-driven airport planning. Across the transportation sector, meaningful engagement has evolved from one-step information-sharing outreach to an intentional, ongoing, relationship-building exercise that centers community members and results in planning outcomes that are characterized by the cultures and priorities of impacted groups.
![]() Module 2 Focus
Module 2 Focus
Provide information to ensure airport stakeholder and community engagement processes meet community members where they are, share influence with community members as a part of the decision-making process, and acknowledge and reduce past and ongoing harm derived from inequitable decisions in transportation and airport planning.
This section suggests techniques to center and empower the communities that are impacted by airport planning processes. It discusses why airports should take up meaningful stakeholder and community engagement to yield truly equitable outcomes and to prevent ongoing harm and displacement of residents who live adjacent to or near the airport. It includes information about community-designed participation. It includes recommended tools, processes, and implementation strategies that can be deployed through airport community engagement processes.
3.2.1 What Is Meaningful Stakeholder and Community Engagement?
The term community engagement takes on a different meaning for different individuals, for different agencies, different community members, and at different scales of application. When it comes to an airport context, at minimum, meaningful engagement means actively involving and collaborating with the communities impacted by the airport’s operations, plans, and decisions in a transparent, equitable, and dignifying manner (Zizka et al. 2019). Engagement efforts should go beyond transactional interactions, such as consulting a handful of residents to garner their approval or sharing information solely for project awareness. When an airport can emphasize deliberative dialogue, shared decision-making, and long-term relationship-building, it is more likely to achieve what could be considered meaningful community engagement. Meaningful community engagement requires the airport agency to:
- Empower and fund open, constant communication: Airports can establish open channels of communication with the community by ensuring that information flows in both directions. The airport should proactively seek community input and directly address questions and issues in the engagement process and during project implementation (Elliot et al. 2015).
- Include diverse perspectives: Recognizing diversity within the community, the airport should strive to include and amplify the voices of underrepresented groups. It is important to actively engage with community members from various backgrounds, cultures, languages, socioeconomic statuses, and abilities. This inclusivity ensures that the engagement process reflects the community’s diverse needs, values, and priorities (Doran and Park 2023).
- Collaborate in decision-making: Participatory research and participatory design should be leveraged to ensure key decisions center community perspectives and priorities. Such participatory frameworks allow community members to be directly involved in problem identification, feasibility assessments, and priority setting when compromises need to be made to accommodate resource limitations. This co-creation of strategies and plans ensures that community perspectives and priorities are integrated into the decision-making process, leading to more equitable and community-oriented outcomes (Diana 2022).
- Provide timely and accessible information: Meaningful engagement involves maintaining transparent communication regarding project/policy features, timelines, and limitations. An airport should make information about airport operations, projects, and decision-making
- Establish long-term relationships: Long-term relationship-building facilitates healthy pathways to resolving conflict between the airport and impacted communities. A communicative environment allows airports to build upon institutional knowledge and oral history as opposed to starting from square one every time the airport desires to involve the community in a decision-making process. The airport should demonstrate a genuine commitment to creating dignifying spaces and processes for providing feedback, listening to the community, addressing concerns, building trust, and implementing feedback (Sanchez 2019).
processes readily available, clear, and easily understandable to the adjacent communities. This includes using accessible language, providing multiple communication channels, and using different formats (such as public meetings, online platforms, and written materials) to reach a wide range of community members. Timely and accessible information allows the community to stay informed, engage effectively, and actively participate in the airport’s activities (Heyes et al. 2022).
Meaningful engagement can be defined in many ways and with different intentions, depending on the context of its use and the capacity of the individual or agency using the term. Table 3-7 offers an overview of various definitions derived from multiple disciplines that are relevant to the airport planning context. The tools in this section can be used by airports to inform the development of their own, unique approaches to community engagement. Because community engagement is best tailored to the community itself, relying on examples of frameworks/approaches that are derived from nonairport sources is no less effective than an airport-specific tool would be. In fact, gleaning insight from other disciplines will likely result in a more holistic approach to reaching and connecting with communities. The caveat here is that the definition of “community” would have to be adequately expansive to support the specific needs of an airport’s planning process. To that end, a harm-reductive approach should be used to focus, scale, and phase engagement efforts such that those who are most likely to be negatively impacted by planning decisions are centered in the approach to engagement.
3.2.2 Why Is Meaningful Stakeholder and Community Engagement Important to an Airport?
Airports are essential transportation hubs connecting people and communities around the globe. As airports continue to expand and evolve, it is crucial for airport owners/operators to recognize the vital role that meaningful stakeholder and community engagement plays in shaping their operations. Engaging with local residents, businesses, community organizations, and other stakeholders is not just a box to check off on a list of requirements; it is a strategic imperative. Successful airport operators recognize that stakeholder and community engagement is not a one-time event but an ongoing process that should be integrated into every stage of airport planning, development, and operations. From the early stages of master planning to the design and construction of new infrastructure, and even during day-to-day operations, community engagement should be a continuous effort. This approach allows for the identification and mitigation of potential issues as well as capitalization on opportunities that arise. By maintaining open lines of communication and fostering a culture of engagement, airports can proactively address concerns and build strong, collaborative relationships with the communities they serve.
Finally, meaningful stakeholder and community engagement can be perceived to be a regulatory requirement, as many funding mechanisms linked to regulatory processes require an engagement plan before funding is granted. While official regulations regarding community engagement in the transportation sector have not been established, community outreach is required by NEPA and other state-level environmental review processes. From an ethics standpoint, community engagement should not be limited to what is expressly required through regulations; instead, community engagement activities can be a demonstration of a genuine
Table 3-7. Examples of stakeholder and community engagement definitions.
| TERM | USE CASE | SOURCE | DEFINITION |
|---|---|---|---|
| Community Engagement | Engagement of communities by governments | “Community Engagement: Toward Community as Governance.” (McCabe et al. 2006) | “The participation of communities in the relevant decision-making that is based within community interest and enhancement of community well-being. Engaging community citizens within the decision-making process of public policy provide[s] policymakers with a potential expert source of knowledge.” Effective community engagement requires (1) authority to legitimatize issues and on-the-ground practice; (2) follow-up evaluation to maintain mutual respect and confidence; (3) formal and preset structures, procedures, and relationships; and (4) closely coordinated and clear practical engagement demonstrations. |
| Community-Engaged Research | Research-based community engagement | “Strategies of Community Engagement in Research: Definitions and Classifications.” (Sanders et al. 2021) | Community-engaged research involves (1) Outreach and Education – where the research team develops, implements, and evaluates strategies to reach people; (2) Consultation – where researchers ask community residents for advice on important elements of a project or activity, and the feedback informs the research; (3) Cooperation – where researchers ask the community for advice and help with a project; 4) Collaboration – where community members partner in every aspect of the research, including setting priorities, study design, implementation, analysis/interpretation, and dissemination; and (5) Partnership – where a strong, bidirectional relationship exists regarding every aspect of the research. |
| Meaningful Public Engagement | Transportation planning | Promising Practices for Meaningful Public Involvement in Transportation Decision-Making (U.S. DOT 2022) | “Meaningful public involvement early in the planning process that includes full representation from all communities affected is key to successful project delivery. Equitable access to public involvement opportunities ensures that underserved and overburdened populations are included. This is vital to informing project delivery, including NEPA’s requirement to review and consider effects on environmental justice communities. Therefore, this guide highlights the value of U.S. DOT funding recipients and project sponsors meaningfully, involving communities to develop publicly supported, well-thought-out plans and designs for deployment at the outset.” |
| TERM | USE CASE | SOURCE | DEFINITION |
|---|---|---|---|
| Public Involvement | Metropolitan planning organization | Augusta Regional Transportation Study Public Participation Plan (Augusta Planning and Development Department 2021) | Public involvement is a process that incorporates the aspirations, concerns, needs, and opinions of the public during all stages of the transportation planning process. Public input is used to advance equity in long-range planning, define goals, develop measuring tools, identify and rank issues, and ultimately decide the selection, prioritization, or programming of transportation projects. |
| Community Involvement | Transportation (aviation) planning | Community Involvement Manual (FAA 2016) | “Community involvement is the process of engaging in dialogue and collaboration with communities affected by FAA actions. This manual reaffirms the FAA’s commitment, established in our Community Involvement Policy, to give the public an opportunity to be informed, become involved, and have their concerns and views considered as the FAA makes aviation decisions that might affect them. In some cases, this may mean going beyond legally mandated public participation requirements. Community involvement does not guarantee outcomes that satisfy everyone. However, decisions that take community input into consideration are more likely to reflect the collective public interest, receive broader community acceptance, and experience fewer implementation and post-implementation problems.” |
| Community Collaboration | Community-airport/port collaboration and capacity building |
“Community-Port Collaboration Toolkit” (EPA, n.d.) including:
| “‘The Community-Port Collaboration Toolkit’ is designed to help communities and ports develop collaborative skills and to enhance understanding of stakeholders’ priorities and challenges associated with port-related activities. The Toolkit includes [links to] the Ports Primer for Communities, the Community Action Roadmap, and the Environmental Justice Primer for Ports along with associated training materials and worksheets. The Ports Primer and Community Action Roadmap support enhancement of community skills for building partnerships and effectively engaging in local decision-making. The Environmental Justice Primer supports enhancement of port operators’ capacity for building effective partnerships and collaboratively addressing community needs – especially communities with environmental justice concerns.” |
commitment to transparency, accountability, and shared decision-making. When airports proactively engage with stakeholders, they create a platform for dialogue and collaboration, fostering trust and understanding. This inclusive approach can help mitigate conflicts, prevent misunderstandings, and ensure that decisions reflect the collective interest of the community. By actively seeking input, addressing concerns, and involving stakeholders in shaping the future of the airport, authorities can create a sense of ownership and shared responsibility.
3.2.2.1 The Risk of Irreparable Harm as a Result of a Failure to Meaningfully Engage
The risk of irreparable harm looms large when airports fail to meaningfully engage with their stakeholders and communities. By neglecting to involve those directly affected by airport activities, airport operators run the risk of making decisions that disregard local concerns, values, and aspirations. This failure not only jeopardizes community relationships but also undermines the potential for long-term sustainable development and positive social impact. One of the most significant risks of inadequate engagement is the potential for irreparable harm to community well-being (Sanchez 2019). When communities feel excluded from decision-making processes, their concerns may go unaddressed, leading to negative impacts on quality of life, public health, and social cohesion. A failure to meaningfully engage can also result in missed opportunities for innovative solutions and sustainable development. By not tapping into the wealth of knowledge, expertise, and creative ideas present within the community, airports may overlook would-be outcomes that balance economic growth with social and environmental benefits. The failure to harness local insights can impede progress toward a more resilient and inclusive airport community, leading to missed opportunities for positive change.
To protect the health, well-being, and resilience of racialized communities, meaningful community engagement and policy protections must be prioritized within transportation planning and the aviation industry. There is a long history of planning bodies failing to equitably engage impacted communities. Commonly used community engagement practices have been accused of tokenism and general failure to address resident fears, which can lead to further mistrust and contention between impacted communities and decision-making bodies (Parker and Murray 2012). Studies have shown that a comprehensive and inclusive community engagement strategy can predict the worst impacts and increase equitable outcomes for community members (Hanoon et al. 2022). Lastly, meaningful stakeholder and community engagement affords airports the opportunity to identify, acknowledge, and make efforts to redress past and ongoing harm experienced by communities. Such redress can only happen when practitioners are grounded in the historical contexts that produced the inequities that persist today (refer to ACRP Web-Only Document 60 for historical context). The populations that have experienced the most harm should be prioritized to prevent further wrongdoings. It is necessary to intentionally design planning processes that balance the power dynamics of the process itself, with specific regard for community representation, participation, and empowerment.
Financial implications further emphasize the risk of irreparable harm stemming from a lack of meaningful engagement. When airports ignore community concerns and fail to build trust, they may face significant opposition and legal challenges that can disrupt project timelines and increase costs. The expenses associated with legal battles, public relations campaigns, and community remediation efforts can be substantial, diverting resources that could have been invested in enhancing the airport’s facilities or supporting community development initiatives.
Social license to operate is another critical factor at stake. When an airport fails to meaningfully engage with communities, it risks losing the social license necessary to operate effectively. Community opposition can manifest in protests, activism, and public pressure, leading to disruptions in operations and increased regulatory scrutiny. The erosion of social license can
have severe consequences, potentially jeopardizing the airport’s long-term viability and impeding future growth opportunities. Ultimately, the risk of irreparable harm resulting from a failure to meaningfully engage is not solely a matter of community impact but also a reflection of an airport’s commitment to sustainability, social responsibility, and long-term success.
3.2.2.2 The Multisector Basis for Meaningful Community Engagement
Meaningful community engagement in aviation planning requires a broader transportation planning focus and a multisector approach that involves various stakeholders and sectors to ensure comprehensive and inclusive processes. Collaboration among different sectors brings diverse perspectives, expertise, and resources, which are vital for addressing the complex and interconnected issues associated with aviation planning. The aviation industry itself plays a central role in community engagement. Airports, airlines, and other aviation entities bring valuable knowledge of operational challenges, safety regulations, and industry best practices. Their participation ensures that community engagement aligns with industry standards and fosters sustainable aviation practices. Similarly, government agencies at the local, regional, and national levels are essential partners in community engagement. These agencies bring regulatory expertise, legal frameworks, and governance structures that guide aviation planning decisions. Collaboration with government agencies ensures compliance with regulations and facilitates the integration of community concerns into policymaking processes.
Meaningful community engagement involves engaging community-based organizations and maintaining long-term relationships with them as a critical path component. Nonprofit organizations, community associations, and advocacy groups represent the interests and concerns of specific communities or demographic groups. Engaging with these organizations ensures that community voices are heard and that the planning process addresses the unique needs and aspirations of diverse populations. In addition to community-based organizations, environmental organizations play a crucial role in aviation planning by advocating for sustainable practices and biodiversity conservation and minimizing environmental impacts. Collaborating with these organizations helps ensure that aviation planning incorporates environmental considerations and mitigates potential harm to natural ecosystems.
Meaningful community engagement also enables identifying and understanding community public health needs and concerns. By actively involving community members in decision-making processes, planners can gather valuable insights that inform strategies to improve public health outcomes. This collaborative approach promotes equity, fosters trust, ensures that health interventions are tailored to the specific needs and priorities of the community, and enhances the effectiveness of emergency response measures. For example, meaningful community engagement is crucial in the context of preparedness to respond to public health emergencies, such as disease outbreaks or natural disasters. Some airports’ emergency operations centers serve the surrounding communities in addition to the airport. In other cases, the airport may serve as a staging ground for emergency vehicles or utility crews responding to a disaster. By involving the community in emergency preparedness planning and response efforts, airport operators can ensure that response plans are aligned with the community’s needs and priorities.
Social services, another aspect of public health, benefit from meaningful community engagement. Social service organizations provide critical insights into social determinants of health, vulnerable populations, and community well-being. For example, Hartsfield-Jackson Atlanta International Airport allows a local social services agency, HOPE Atlanta, to staff an Airport Outreach Case Manager who is tasked with “[providing] Outreach, Engagement, Linkage, and Housing Location to individuals/families who are experiencing homelessness, coping with mental health, medical and substance use issues within Hartsfield-Jackson Atlanta International Airport and the City of Atlanta” (HOPE Atlanta, n.d.). Collaborating with these organizations
ensures that aviation planning considers social equity, access to services, and the unique needs of oppressed communities.
3.2.3 What Tools or Frameworks Can My Airport Use to Facilitate Meaningful Stakeholder and Community Engagement?
Several tools and strategies can be leveraged by airport planning practitioners looking to implement meaningful stakeholder and community engagement. This module outlines these strategies while also providing descriptions of their ideal use context. Examples of participatory methods, various low-stakes engagement actions, decision-making tools, result-based accountability frameworks, and approaches to operationalizing meaningful stakeholder and community engagement are presented. The tools and strategies are organized into tables that highlight the limitations and gaps inherent in the tools; the tables are organized into three areas of focus:
- Community-designed participation,
- Accessibility-driven engagement, and
- Public process design.
Each tool defines engagement differently, but there are valuable characteristics inherent in each approach.
3.2.3.1 Community-Designed Participation
Table 3-8 provides tools for community-designed participation. The tools and frameworks presented in this section are examples of community-based airport planning exercises that can fortify an airport’s goal of achieving equitable outcomes. The tools listed can be adapted to the airport context and were intentionally included because they were not designed with a specific case-use in mind. Bearing this in mind, the tools themselves will not achieve equity. Rather, these tools can support a broader, equitable approach to community-based engagement. All these frameworks are context-sensitive, requiring expertise and judgment from people designing the strategies. Because there is no established legacy of meaningful engagement in transportation, examples have been provided from sectors outside of transportation.
Participatory three-dimensional modelling (P3DM) has been used to combine the qualitative spatial knowledge of Indigenous elders with technical spatial analysis to develop 3D models that are gifted to (and remain with) communities while supporting the conceptual development phase of planning processes. Similarly, the Better Block Project installs tangible, digital fabrications of community visions for street-level changes so that communities have an opportunity to inform design through a physical, malleable component located directly in the community. The Asset-Based Community Development Institute created its Toolkit to conduct community-based energy planning (Asset-Based Community Development Institute, n.d.). Additionally, the Monitoring and Evaluation Of Participatory Planning Processes (MEPPP) Framework offers a method for ensuring participatory planning efforts are truly equitable (Hassenforder et al. 2016).
While community engagement is receiving increased focus and resources from planning agencies in general, such practices are still grossly underfunded and rarely include community-based or community-led methods. Agencies looking to embark on community-based planning exercises should focus their initial efforts on identifying effective tools to enhance and encourage sustained civic engagement. The use of kinesthetic materials—such as hands-on mapping, adaptive displays, and interactive graphics—promotes meaningful community-based planning. It is also important to select tools and methods that are widely accessible or sufficiently staffed to eradicate technology and language barriers. Agencies should work to establish a menu of
Table 3-8. Examples of frameworks for community-designed participation.
| TOOL TITLE | ORGANIZATION | FEATURES | DESCRIPTION |
|---|---|---|---|
| Participatory 3-Dimensional Modelling: Guiding Principles and Applications (Rambaldi and Piccolella 2016) | weAdapt | Hands-on components, emphasis on qualitative data, community resource | Purpose: “Participatory three-dimensional modelling (P3DM) is a participatory mapping method integrating Indigenous spatial knowledge with data on elevation of the land and depth of the sea to produce stand-alone, scaled, and geo-referenced 3D models. Based on recollections from memory, land use and cover and other features are depicted on the model by using push pins for points, yarns for lines, and paints for polygons. On completion, a scaled and geo-referenced grid is applied to facilitate data extraction or importation.” |
| Better Block Project (The Better Block Foundation 2023) | The Better Block Foundation | Hands-on components, temporary built elements, route to permanency | Purpose: “A hands-on approach that sidesteps the lengthy process of city planning and implementation by putting the power back into the communities’ hands through rapid and temporary placemaking.” Leverages the support of artists, government officials, small business owners, and residents. |
| Tool Kit (Asset-Based Community Development Institute, n.d.) | DePaul University | Talking points, asset mapping tools, facilitation tools | Purpose: A justice-oriented approach to community-led action, building relationships for mutual support to implement an equitable community planning exercise. |
| Monitoring and Evaluation of Participatory Planning Processes (MEPPP) Framework (Hassenforder et al. 2016) | Independent research | Guidance | Purpose: A guide to monitoring government-run participatory planning efforts. |
tactics that take into consideration that those being engaged will come from various cultural backgrounds and will have a wide range of preferences in terms of how they desire to participate. Some community members may thrive in group exercises, while others may prefer a more intimate format of engagement.
3.2.3.2 Accessibility-Driven Engagement
The tools and frameworks presented in this section are examples of accessibility-driven engagement efforts that can ensure an airport’s engagement strategy is accessible and also result in outcomes that promote accessibility. Table 3-9 provides tools for accessibility-driven engagement. Each of the tools listed applies directly to transportation planning contexts, and several of the tools are specifically geared toward airport planning. Still, this list is only a sampling of what airports can do to ensure an accessible engagement process and an accessible project overall.
“Community Engagement Strategies for Crowdsourcing Accessibility Information: Paper, Wheelmap-Tags and Mapillary-Walks” offers a comprehensive list of strategies and tools that
Table 3-9. Examples of accessibility-driven engagement.
| TOOL TITLE | ORGANIZATION | FEATURES | DESCRIPTION |
|---|---|---|---|
| Community Engagement Strategies for Crowdsourcing Accessibility Information: Paper, Wheelmap-Tags and Mapillary-Walks (Voigt et al. 2016) | Independent research | Case study review of existing crowdsourcing tools | Purpose: An exploration of crowdsourcing mechanisms for assessing accessibility “as a form of social innovation, requiring adequate engagement strategies that fit the skills of the intended group of volunteers.” |
| My Family’s Accessibility and Community Engagement (My FACE) (Bourke-Taylor et al. 2021) | Independent research | Likert scale tool for assessing experiences of youth with disabilities | Purpose: “Measures parental perceptions of community accessibility and engagement of families raising a child with a disability.” |
| Facilitating the Inclusion of Adults with Intellectual Disability as Direct Respondents in Research (McDonald et al. 2022) | Independent research | Validated methodology | Purpose: “Multi-phased process, inclusive of community engagement, to develop a self-report survey for adults with intellectual disability and share findings from an institutional ethnography conducted to identify strategies for facilitating inclusion. We also assessed indicators of the quality of these strategies.” |
| Airport Accessibility and Navigation Assistance for People with Visual Impairments (Guerreiro et al. 2019) | Academic research | Case studies, video presentations | Purpose: “This study presents the first systematic revaluation posing BLE [Bluetooth Low Energy] technology as a strong approach to increase the independence of visually impaired people in airports.” |
| A Review of Airport Accessibility Programs for Individuals Diagnosed with Autism Spectrum Disorders: Recommendations for the Development of a Program at Portland International Airport (Skillicorn 2013) | Master’s thesis | Case studies, recommendations | Purpose: “Review available literature on airport assistance programs as well as the types of common difficulties likely to be encountered by a child with ASD [autism spectrum disorder] who is attempting air travel. Specific air travel support programs were also presented and compared to identify commonalities and areas of strength.” |
can be used to collect community input regarding accessibility within a project area (Voigt et al. 2016). “My Family’s Accessibility and Community Engagement (My FACE)” is a tool that captures perceptions of community accessibility and engagement among mothers in families raising children with disabilities (Bourke-Taylor et al. 2021). “Facilitating the Inclusion of Adults with Intellectual Disability as Direct Respondents in Research” provides a methodology for engaging people with cognitive disabilities (McDonald et al. 2022). “Airport Accessibility and Navigation Assistance for People with Visual Impairments” provides an example of an engagement process that specifically sought to ascertain the unique experiences of people with disabilities in the airport setting (Guerreiro et al. 2019). A Review of Airport Accessibility Programs for Individuals Diagnosed with Autism Spectrum Disorders lays out the available frameworks for airports looking to improve travel for people with cognitive differences (Skillicorn 2013). For another example, refer to “Case Study Example 1: The Disabilities Advisory Committee at the Minneapolis-St. Paul International Airport” found in Section 4.4.2 in Case Studies, available on the National Academies Press website (nap.nationalacademies.org) by searching for ACRP Research Report 265.
Accessibility is by far one of the most underresourced and culturally erased aspects of equity in the transportation sector. Even when projects are expressly meant to intervene on inaccessibility in public spaces, the engagement processes that inform those planning processes rarely include accessible engagement methods. Offering alternative means for kinesthetic activities, leveraging storytelling from those impacted by inaccessibility, and providing opportunities for dignified interactions and disability-specific interventions are promising methods for improving accessibility in airport planning. Disability and accessibility deserve hyper-specific research exercises and resources that are separate from the already limited engagement budgets. However, accessibility can also be an anticipated expense and incorporated into project budgets. What is undeniable is that accessibility is necessary and required by law.
3.2.3.3 Public Process Design
The tools and frameworks presented in this section are examples of strategies and approaches municipal agencies have used to design engagement plans to promote equitable outcomes. Table 3-10 provides tools for public process design. The tools listed are examples of approaches that have been structured to meet the specific needs of specific populations. Rather than being a comprehensive list of “acceptable tools,” this list demonstrates the type of out-of-the-box thinking that is possible within a community engagement strategy.
“Community Engagement Process for Vacant Land in Declining Cities” offers a valuable overview of methods for planning underutilized or vacant land without compromising community engagement as a step in the planning process (Kim et al. 2020). “Integrating Community Engagement and Children’s Voices” speaks to methods for engaging an often-disregarded group–youth—in a manner that legitimizes youth perspectives in the planning and design process (Derr 2015). Similarly, Community Engagement in Rural Communities puts forth an “organizing framework” for meeting the specific, unique needs of residents living in rural areas (Uddin et al. 2021). “Using Sentiment Analysis to Reinforce Learning” speaks to the qualitative value of community perceptions when designing a community engagement or public information campaign (Diana 2022). Finally, “Performative versus Authentic Equity Work” explores the ways “equity” planning and community engagement can produce negative outcomes if such planning is implemented in unauthentic ways (McCullough and Erasmus 2023).
Most public agencies, including airports, are aware of the widely referred to (and standard) approach to a phased community engagement process created by the International Association for Public Participation Spectrum (IAP2, n.d.). While this framework is useful for configuring an approach to community engagement, it is important that the actual engagement methods are customized to meet the needs of the community in the specific project area.
Table 3-10. Examples of frameworks for public process design.
| TOOL TITLE | ORGANIZATION | FEATURES | DESCRIPTION |
|---|---|---|---|
| Community Engagement Process for Vacant Land in Declining Cities (Kim et al. 2020) | Independent research | Case study analysis of multiple methods | Purpose: “Reviews what plans, policies, implementation methods, and community engagement processes were developed to overcome barriers and challenges to vacant land projects.” |
| Integrating Community Engagement and Children’s Voices into Design and Planning Education (Derr 2015) | City of Boulder | Analytical review of city/community engagement process | Purpose: The participatory process was “designed to inform the City of Boulder’s Comprehensive Housing Strategy” and this paper/research “was designed to understand how the participation of young people influenced undergraduate design education.” |
| Community Engagement in Rural Communities (Uddin et al. 2021) | East Tennessee State University; Tennessee Department of Transportation Long Range Planning | Report on outcomes of engagement process | Purpose: To identify “technological, cultural, social, and economic factors . . . of rural communities that impact the ways in which they engage with State agencies.” And to develop “an organizing framework for identifying various effective practices, tools, and techniques for rural engagement.” |
| Using Sentiment Analysis to Reinforce Learning: The Case of Airport Community Engagement (Diana 2022) | Independent research | Case study on sentiment analysis framework | Purpose: Through a case study on a large hub airport in the Northeast of the United States, identify the issues “that airport community residents experience in their engagement with the airport authority, the regulators, elected officials, and community leaders.” Demonstrates “how residents’ sentiment expressed in digital prints can be leveraged to inform decision-making in community engagement.” |
| Performative versus Authentic Equity Work: An Assessment of Current Practices in Transportation Planning (McCullough and Erasmus 2023) | Independent research | Evaluation of applied notions of equity in transportation planning | Purpose: Reconcile differences in how equity is defined and applied throughout the state of California. “Key findings centered around a distinction between ‘performative’ equity work and ‘authentic’ equity work. Performative equity work privileges the comfort and perspective of dominant groups, reinforces the status quo, stays in the realm of the rhetoric, and often results in superficial changes.” |
3.2.3.4 Select and Use the Appropriate Tool
This section provides a recommended approach to determining which tools to use and when while seeking meaningful stakeholder and community engagement. When conducting community engagement efforts, decision-makers should avoid over-relying on standardized community engagement frameworks to ensure the outcomes of engagement activities speak to the specific needs of the communities that will be impacted by the policy or project underway. Meaningful community engagement can take on a different definition each time engagement is implemented. Consider identifying a specific group of people that would form the basis of intentions for engagement, and design the engagement strategy with them in mind while also including the broader community during the implementation of the plan. It may also be more effective to develop multiple population-specific strategies for a single project to reach populations with stark cultural differences or varying socioeconomic needs.
Table 3-11 offers questions to reflect on while seeking meaningful stakeholder and community engagement. The right column provides possible answers for an example scenario. Table 3-12 suggests the tools that could be used for the example scenario.
3.2.4 What Are Some Limitations of Stakeholder and Community Engagement?
Designing a meaningful stakeholder and community engagement strategy is a complex endeavor that comes with inherent limitations. First, agencies often encounter the challenge of resource constraints. Crafting and executing an effective engagement strategy demands financial, human, and time resources. Limited budgets or staffing may hinder agencies from conducting comprehensive research, outreach, and follow-up activities required for meaningful engagement. This constraint can compromise the depth and breadth of the strategy, potentially excluding certain stakeholders or communities from the process.
Second, the dynamic nature of stakeholder and community dynamics presents another limitation. Over time, the composition, interests, and concerns of stakeholders and communities can evolve. This makes it challenging to design a one-size-fits-all strategy that remains relevant and effective throughout the lifespan of a project or initiative. Agencies must continually adapt their strategies to accommodate changing circumstances and ensure that they remain responsive to the needs and expectations of their stakeholders and communities. Flexibility and appropriate project staffing when it comes to strategy design are vital to overcoming these inherent limitations.
3.2.4.1 Linear Thinking Creates Inflexible Processes
Linear thinking and rigid approaches to community engagement can lead to inequitable outcomes by failing to account for the complexity and diversity of communities’ needs, preferences, and circumstances. First, a linear mindset often assumes a one-size-fits-all approach, treating all community members or stakeholders as if they have the same interests and can be engaged in the same way. In reality, communities often consist of people with a vast array of perspectives, cultures, socioeconomic backgrounds, and historical experiences. A rigid approach that does not adapt to this diversity can marginalize certain groups, perpetuating existing inequalities by excluding their voices and concerns from the decision-making process.
Additionally, linear thinking may prioritize efficiency and simplicity at the expense of inclusivity and genuine participation. It can limit engagement to a predetermined set of steps or activities that may not resonate with or be accessible to all community members. This can result in the underrepresentation of groups made marginalized who may have unique needs or face barriers to engagement, such as language barriers, limited access to technology, limited time, or transportation challenges. Inequitable outcomes emerge when the engagement process disproportionately benefits those who are already privileged or well connected while sidelining others.
Table 3-11. An example framework for seeking meaningful community engagement.
| REFLECTION PROMPT | EXAMPLE RESPONSE |
|---|---|
| Stage 1: Establish the needs and intentions that are motivating the community engagement strategy. | |
| Purpose: What type of information are you seeking? What do you want to learn about your impact on equity outcomes? | The airport seeks to address concerns that plans to expand will impact a future generation of people who are currently children and that, ethically, it is unfair that adults in the project area are able to inform project outcomes, while those most likely to be impacted are left out of the deliberative process. The expansion project area is home to three public schools (elementary, middle, and high school). There has never been an effort to engage youth in local planning decisions up to this point. |
| Process: What decision-making or planning process will this engagement strategy influence? | Design. |
| Audience: Who will see this? Who does this engagement strategy serve? | Internal process with external implications. May need to share publicly to maintain transparency and efficacy of the strategy. |
| Stage 2: Clarify the scope of the community engagement strategy. | |
| Question: What type of equity outcomes are you looking to achieve through engagement? Which group(s) are most likely to be impacted by the decisions made during your engagement process? | How will airport expansion impact the future quality of life for community members who are currently youth? What are the relevant, current needs of young people in the project area? To what extent can youth be engaged through the same tactics as the adult population in the project area? |
| Data: What data is needed to answer the question? | School attendance data, existing/compounding disparities in the project area, demographic data, literacy rates, public health demographics, and community transformation projections. |
| Method: What methodological approaches could help answer the question? | Participatory planning, oral history collection, multimedia engagement, child-friendly cities, and human-centered design. |
| Stage 3: Document the capacity and resources available to analyze the community engagement strategy. | |
| Capacity: What resources (time/money/personnel) will be made available to respond to/address the findings derived from the community engagement strategy? | Despite limited municipal experience engaging youth directly in a planning capacity, there is direct access to local schools, the ability to work with school administrators to ensure adequate engagement and ascertain the appropriate data, and a fixed timeframe for community engagement due to local school schedules. |
| Staff capacity: What ideologies, identities, and perspectives could influence the person(s) responsible for conducting and analyzing the findings derived from community engagement? | Staff do not specialize in youth engagement, have limited fiscal resources, and have no recent experience expending project resources on youth-related materials and activities. Pre-existing criticism regarding project ethics. |
Table 3-12. Summary of youth engagement during the design process: a method for integrating community engagement and children’s voices into design and planning education method.
| BASIC INFORMATION | |
|---|---|
| Owner | Victoria Derr assessed the outcomes of a participatory planning exercise that centered on youth for the City of Boulder, through a partnership with the Environmental Design Department at the University of Colorado, Boulder. |
| Purpose of the Tool | The participatory process was “designed to inform the City of Boulder’s Comprehensive Housing Strategy” and this paper/research “was designed to understand how the participation of young people influenced undergraduate design education.” |
| Guides | “Integrating Community Engagement and Children’s Voices into Design and Planning Education” (Derr 2015). |
| “How Participatory Processes Impact Children and Contribute to Planning: A Case Study of Neighborhood Design from Boulder, Colorado, USA” (Derr and Kovács 2015). | |
| METHODOLOGY OVERVIEW | |
| Methodology |
|
Last, linear thinking can overlook the dynamic and evolving nature of community issues and relationships. Communities are not static entities, and their needs and concerns can change over time. Rigid approaches may fail to adapt to these changes, leading to outdated or ineffective engagement strategies. This inflexibility can leave communities feeling unheard and disempowered, particularly when their priorities shift or new challenges emerge. To avoid inequitable outcomes, it is essential to adopt a more adaptive, inclusive, and responsive approach to community engagement that acknowledges and addresses the complexities and evolving nature of communities.
3.2.4.2 Appropriate Staffing
As comprehensive community engagement is still considered an emergent practice in relation to airport planning, airports are rarely equipped with the human resources necessary to ensure an adequately meaningful community engagement process. Inadequate staffing can result in a lack of diversity within the team tasked with designing the approach to engagement, which can lead to an engagement strategy that reflects the sociocultural gaps of the project staff. When the team lacks representation from different community groups or individuals with specific cultural or linguistic competencies, certain voices and perspectives may be inadvertently silenced or overlooked. This can lead to the exclusion of underrepresented communities, worsening existing inequities in the engagement process and project outcomes overall. Additionally, effective
community engagement often requires substantial time and effort to develop trust, understand local concerns, and establish meaningful connections. When teams are understaffed or lack appropriate cultural representation, they may prioritize some stakeholders over others, inadvertently worsening the inequities the respective project may be seeking to disrupt.
Another consideration is that the lack of resources and staffing can result in rushed or superficial engagement efforts. When community engagement teams are inappropriately staffed, such that capacity is strained, those managing projects may resort to tokenistic or checkbox-style approaches, simply going through the motions without genuinely listening to community feedback or implementing meaningful changes. This can lead to frustration and disillusionment among community members, particularly those who have been historically underserved or marginalized. To achieve more equitable outcomes, airports must allocate appropriate resources and staff to their community engagement efforts, ensuring that all voices are heard and valued in the decision-making process.
3.2.5 What Are Common Pitfalls or Challenges to Implementing Meaningful Stakeholder and Community Engagement for Airports?
Inconsistency, project-specific frameworks, and rigid implementation timelines are common dynamics that lead to pitfalls when it comes to designing meaningful stakeholder and community engagement processes. Inconsistent approaches to stakeholder and community engagement can create numerous challenges for airports. When different airport projects or departments adopt varying methods of engagement, it can result in confusion and mistrust within the community. Inconsistency can make it difficult for community members to understand the airport’s objectives and the engagement process, leading to a lack of transparency and accountability. Additionally, it may create a perception that the airport is not genuinely committed to engaging with the community, which can also erode trust and lead to resistance or opposition from stakeholders.
Another common pitfall is the overreliance on project-specific approaches to engagement. When airports only engage with the community on a project-by-project basis, it can result in fragmented and ad hoc interactions. Community engagement should be an ongoing, relationship-building process that extends beyond individual projects. Focusing solely on specific initiatives may lead to a lack of continuity and a failure to address broader community concerns or long-term impacts. This approach can also neglect the cumulative effects of multiple projects on the community, potentially causing frustration and resentment among stakeholders.
Last, fixed implementation timelines can pose challenges for airports attempting meaningful engagement. Many community engagement processes are time consuming and may require flexibility to accommodate community input and concerns. When airports adhere strictly to fixed timelines, there is a risk of rushing through the engagement process or failing to adjust based on community feedback. This can result in decisions that do not adequately reflect the community’s needs or preferences. Moreover, rigid timelines may limit the airport’s ability to build trust and collaborative relationships with stakeholders, as community members may perceive the process as predetermined or insincere.
Overall, it is critical for airports to remain aware that communities have different communication preferences, levels of familiarity with airport operations, and concerns. A one-size-fits-all approach can alienate certain groups or fail to address specific local issues, resulting in missed opportunities for constructive dialogue and collaboration. To foster trust, transparency, and equity, airports should strive for consistency in their engagement practices, adopt a holistic and continuous approach to engagement, remain flexible with implementation timelines, tailor
strategies to specific communities, and actively incorporate community input into decision-making processes. By doing so, airports can navigate these common pitfalls and work toward more meaningful and collaborative relationships with their stakeholders and communities.
3.3 Module 3: Use Spatial Data, Methods, and Tools to Assess Environmental Justice and Equity
![]() Module 3 Focus
Module 3 Focus
Provide information for airport practitioners to use spatial data, methods, and tools to inform equity-centered decision-making.
In equity and environmental justice work, there is value in understanding the spatial distribution of resources, pollutants, and community outcomes across various population groups. The spatial distribution is one way to represent the harm and lived experiences of impacted populations.
This module focuses on the spatial data, methods, and tools that can aid our understanding of human health and well-being in communities surrounding airports. A more contextual understanding of nearby neighborhoods can help airport staff understand the challenges that a community faces and, consequently, be better positioned to understand how the airport is contributing to or detracting from the local community’s needs, aspirations, and challenges. This module aims to prepare the reader to work with data, methods, and browser-based tools in a manner that informs equity-centered decision-making within airport planning processes. It also introduces how to communicate information to nontechnical audiences using data visualization techniques. While this module is meant to be conceptually tangible to all readers, many of the tools and datasets described within require ancillary skills and training to fully utilize.
3.3.1 What Is the Difference Between Spatial Data, Methods, and Tools?
3.3.1.1 Understanding Data
In everyday speech, data can be synonymous with facts, statistics, or information. However, in a spatial data analysis context, data has a more specific meaning. Here, data, datasets, or dataframes refer to the digital files that store structured sets of information. For example, an Excel spreadsheet is a file format that may contain character strings (e.g., airline, flight number, aircraft tail number) or numeric values (e.g., minutes of flight delay, departure time, takeoff weight). This data is sorted into rows of observations (e.g., every row is a unique flight) and columns of variables (i.e., the characteristics that describe each observation).
A shapefile is another example of a structured data file format. A shapefile contains location information that computer software can use to construct a specific geometry (i.e., shape). The shapefile data is rendered as points, lines, and polygons layered on top of a map. A shapefile can also contain data that assigns attributes to the points, lines, and polygons. For example, a shapefile that contains the boundaries for U.S. states (polygons) may also contain population data for each state. Thus, the numeric population data is an attribute of the state-shaped polygons.
In addition to understanding the file formats of spatial datasets, it is important to recognize their variation in geographic scope and spatial aggregation. The U.S. Decennial Census of Population and Housing is known for being a national-scale surveying effort of U.S. households (a broad spatial scope). Due in part to privacy concerns, the household data is aggregated into small geographic units. For example, rather than publicly share that a specific residence contains four children, the aggregated data states that all residences in Block Group #167 collectively house 386 children. The census “block group” is the smallest geographic unit of census data, containing between 600 and 3,000 people, and the polygons are often about the size of a neighborhood.
Alternatively, data can be aggregated at the state level, which is less useful in understanding local concerns. It requires tremendous resources to conduct a data collection and sampling effort that achieves a broad geographic scope with high spatial granularity, while also maintaining dataset reliability and accuracy.
Spatial analysis requires datasets that describe populations, hazards, exposures, and other proxies for harm. Often, environmental justice analysis focuses on measuring sociodemographic characteristics of the population in relation to their proximity to contaminants or other harmful exposures. In contrast, equity analysis may be more inclusive of multiple variables that capture compounding systemic challenges, such as health outcomes. For example, variables may include
- Demographic variables, such as race and ethnicity;
- Socioeconomic variables, such as median household income;
- Geo-location data of harmful sites or facilities, such as the location of toxic waste sites;
- Chemical pollutant and toxin variables, such as concentration of particulate matter emissions;
- Environmental impact variables, such as average noise levels; and
- Health outcome variables, such as childhood asthma rates.
3.3.1.2 Understanding Methods: Analysis and Visualization Approaches
Spatial datasets are insufficient on their own; they require analysis, visualization, and interpretation to obtain meaningful information that can be used to influence decision-making. The broad purpose of spatial analysis is to deploy analytical methods that derive useful, accurate information from spatial datasets. When a spatial analysis task is motivated by environmental justice or equity concerns, the methods of the spatial analysis can range from exploratory analysis to correlation analysis to causation analysis techniques. Depending on the focus, the goals may include
- Generating exploratory or comparative summaries that describe a specific population’s exposure, harm, or vulnerability to environmental hazards;
- Testing for correlation between sociodemographic variables and spatial patterns of exposure, harm, or risk; and
- Testing for causation between exposure sources and harmful health and environmental outcomes.
To complete intermediate and advanced spatial analysis techniques, an individual needs technical proficiency in data collection, dataframe manipulation and processing, statistical methods, and GIS software. Software options can be free and publicly accessible (e.g., QGIS) or subscription-based (e.g., ArcGIS), with options to install software on a personal desktop machine or accessed via the cloud (e.g., ArcGIS online). However, the emergence of internet browser-based tools, which do not require separate software to access, has simplified the technical prerequisites to conduct exploratory analysis of spatial data. Even though the required technical skills are reduced, the interpretation of environmental justice spatial data still requires some discipline-specific competency, such as in public health, environmental science, equity, and geography.
For airport facility managers, the spatial analysis goal is typically to perform an exploratory or comparative study of the neighborhoods in the vicinity of the airport. Exploratory efforts can be used to identify geographic areas of concern. The results can guide the airport’s approach to community engagement and influence early-stage budgeting and infrastructure planning activities. Comparative studies are typically pursued during the NEPA process to evaluate the exposures and impacts that different communities may experience under different development scenarios. The results of these exploratory studies can guide decision-makers to redirect resources or pursue alternate courses of action that avoid, minimize, or mitigate harm.
The data analysis and visualization methods that support exploratory spatial analysis tasks are increasingly referred to as “spatial EJ screening.” When there are many variables available to describe a geography of interest, dashboard visualizations can be a useful screening strategy. Dashboards are often automated, interactive, and browser-based visualization tools that provide digestible summary statistics and simple charts. Another advantage of dashboard tools is the ease and consistency of comparing multiple geographies. Hot spot and heat map visualizations draw attention to geographies with more extreme characteristics, which can aid in identifying spatial patterns of harm. The hot spot method is accessible to beginner users of GIS software and may also be available in browser-based tools. Last, indexing is an analysis strategy that combines multiple variables into a singular measure of risk, harm, or exposure. Indexes require substantial disciplinary knowledge and methodological training to create. Indexes are often generated by specialized government agencies, academic researchers, or research institutes, who may publish the indexed dataset results in publicly available browser-based tools.
Figure 3-1 and Figure 3-2 present screenshots of example dashboard visualizations that show results for the areas around the Memphis International Airport, provided by the AirToxScreen tool from EPA and the EJ Dashboard tool from the Centers for Disease Control and Prevention (CDC), respectively. Each visualization includes a series of bar charts and pie charts that accompany an interactive map. Figure 3-2 also functions as a heat map, showcasing color variation to depict value.
Though it is an important part of environmental justice and equity analysis, this module does not delve into the nuances of statistical testing for correlation or causation. These studies are typically outside the scope of the airport practitioner. Further, the legal standards to prove causation vary across environmental hazards and legal jurisdictions and are not always consistent with environmental science.
3.3.1.3 GIS-Based Software versus Browser-Based Tools
Airport authorities may use both GIS-based software and browser-based tools. GIS-based software and browser-based tools differ in terms of functionality, data sources, and user experience. For example, GIS-based software is designed for geographic analysis and mapping. It offers a wide range of advanced spatial analysis capabilities, such as overlaying multiple layers of spatial information, conducting proximity analysis, creating custom geoprocessing workflows, and generating detailed maps and visualizations. Browser-based tools, on the other hand, tend to have limited functionality and are often focused on providing rudimentary access to datasets from organizations dedicated to a specific subject area (e.g., the CDC has multiple tools focused on health). In some cases, the browser-based tools may allow the user to upload datasets into the tool or download datasets from the tool. In other cases, the browser-based tool may only offer summary reports or graphic visualizations of datasets already embedded into the tool.
In terms of user experience, GIS-based software requires a certain level of technical expertise in the software interface and the methods of geospatial analysis. It also requires disciplinary knowledge to design a robust analysis plan and curate the relevant datasets. GIS software tools may have steeper learning curves and require training to fully utilize their capabilities. In contrast, browser-based tools are generally more user-friendly and accessible to a broader audience at the beginner’s level. They often prioritize ease of use and intuitive interfaces to allow users to explore environmental justice issues without extensive technical knowledge. In many instances, the tools provide infographics, tables, and charts that can be inserted into reports or shared with colleagues.
For rural airport authorities with limited or unreliable internet connectivity, GIS-based software offers the advantage of operating on local machines, allowing users to work with geospatial data even when offline. Browser-based tools require a stable internet connection as they rely

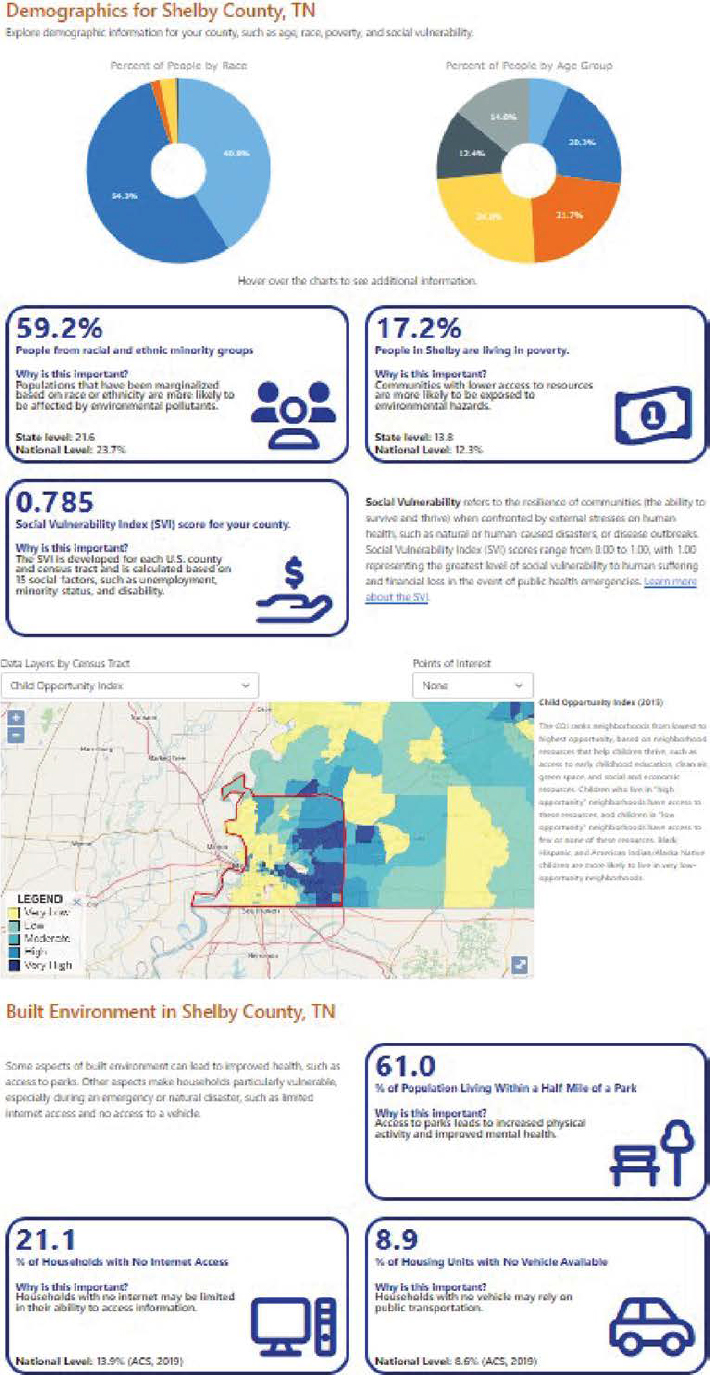
on web-based interfaces and cloud-based data storage and processing. The major benefit of using browser-based tools is that they are managed by organizations that collect, compile, and display the data. Depending on their resources, these organizations may also periodically update the data over time. Browser-based tools are useful resources for airport practitioners who may not have the time or resources to create their own environmental justice analysis tools or datasets.
3.3.2 Why Is It Important for an Airport to Incorporate Spatial Data Analysis into Decision-Making?
The foundations of inequity have manifested spatially for decades in the United States, so it is appropriate to use spatial techniques to observe ongoing inequities. Anti-Black racism, particularly as expressed through overtly racist housing policies, resulted in the unjust spatial sorting of White and Black households, which then left a traumatic legacy of health and wealth inequities for Black families. Given that most U.S. airports were originally sited before the 1950s, many of today’s airport facilities developed alongside decades of overtly and covertly discriminatory housing policy.
Although airports are not directly responsible for housing policy, residential development is a primary concern for airport officials. Residential development near airports is often characterized as noncompatible land use in the aviation industry since airport operations can present safety and environmental hazards to nearby residents. Residential development near the airport can also hinder the airport’s longer-term operational goals and infrastructure expansion plans. If the airport intends to pursue equity-oriented airport development, it is important to understand how inequitable housing policy contributed to the patterns of residential development in the airport’s surrounding area, and ultimately, the patterns of spatial inequity that continue to affect airport-adjacent communities.
Importance of Spatial Data Analysis
- Identifying Disproportionate Impacts: These tools help identify areas or communities that may be disproportionately burdened by environmental hazards, inadequate transportation infrastructure, or socioeconomic challenges.
- Targeting Interventions: The data and insights from these tools enable targeted interventions and policy decisions. By understanding the specific challenges faced by certain neighborhoods near airports, policymakers can develop tailored solutions to mitigate environmental risks, improve transportation options, and address socioeconomic disparities.
- Engaging Communities: Accessible and transparent information empowers communities to participate in decision-making processes and advocate for their rights.
Aside from the necessity of using spatial analysis to diagnose the spatial symptoms of discriminatory policies, spatial analysis provides a practical option for communicating complex and abstract information. Individuals occupying airport leadership roles may base their decisions on briefings and metrics. The metrics and visualizations from spatial analysis can be effective communication strategies to quickly illustrate complex information about existing inequities and disproportionate environmental burdens. In general, the social complexity of inequity can be challenging to explain and interpret. Additionally, the large swaths of land composed of green space, waterways, neighborhoods, and airport facilities can be hard to visualize in the mind’s eye. The visuals and statistics gleaned from spatial analysis can appeal to leadership with limited time and limited background knowledge.
As an act of knowledge-production and knowledge-sharing, a broader spatial analysis of environmental burdens and inequities offers a strategy to understand how the airport’s contribution to environmental burdens fits into the local community’s needs, aspirations, and challenges. Though the airport is not responsible for all the challenges and stressors impacting a community, acknowledging existing stressors can aid in community relationships. If this knowledge is compassionately incorporated into public engagement, it can change the tenor of dialogue with local communities to be more respectful, trusting, and empathetic.
The results of spatial analysis can guide equitable policy and resource allocation, ensuring that protections and mitigations are implemented where
they are needed most. The information can also be used to apply for equity-oriented funding sources intended to support projects focused on reducing inequities. For example, the “Emerging Contaminants in Small or Disadvantaged Communities Grant” established in the Bipartisan Infrastructure Law and administered by the EPA is intended to help disadvantaged communities resolve water contamination caused by airport firefighting foams, among other sources.
3.3.3 What Browser-Based Mapping Tools Can an Airport Use to Assess Equity and Environmental Justice?
This section offers an overview of a subset of browser-based mapping tools that can be used to evaluate environmental justice and equity. The tools are organized into the following areas of focus:
- Comprehensive (national, state, and municipal scope),
- Housing,
- Noise,
- Health, and
- Children.
The tables describe some of the features of these tools and contain the following icons to indicate some of their characteristics:
| Beginner-friendly | |
| Access restrictions or login required | |
| Downloadable data | |
| Inputs allowed |
Most organizations that develop and manage publicly available geospatial tools and data sources also publish associated detailed instruction manuals concerning how to access, download, and interpret the data. This module is not intended to duplicate tool instructions that already exist but rather intends to provide an understanding of data types, analysis methods, visualizations, tools, and limitations. For context, the Appendix to the Toolkit contains one-page summary tables that describe over 30 browser-based mapping tools in greater detail. Each summary includes basic information about the Tool, its purpose, an overview of the user interface, and the inputs and outputs associated with the tool, along with the URL to the Tool instructions (where available). The Appendix is intended as a snapshot of a sampling of tools that may be useful to airport practitioners. Readers are encouraged to reference the websites that host the tools for the most up-to-date and comprehensive information related to the tools. The Appendix is published separately and is found on the National Academies Press website (nap.nationalacademies.org) by searching for ACRP Research Report 265.
“Big Picture” National-Scale Tools
EJScreen, the Equitable Transportation Community Explorer, and National Equity Atlas may be the most useful for airports.
3.3.3.1 Comprehensive
This subset of tools offers comprehensive spatial datasets with many different variables of importance to environmental justice and equity. The subset of tools in Table 3-13 have a national geographic scope, so they appeal to a large user base.
Table 3-13. Examples of browser-based mapping tools with a national scope.
| TOOL TITLE | ORGANIZATION | FEATURES | DESCRIPTION |
|---|---|---|---|
| EJScreen: Environmental Justice Screening and Mapping Tool https://www.epa.gov/ejscreen | EPA |  | Purpose: Offers a nationally consistent dataset and approach for combining environmental and demographic socioeconomic indicators. Downloads: PDF reports, Shapefiles. Inputs: Users can add data from ArcGIS online. |
| Risk-Screening Environmental Indicators (RSEI) Model https://www.epa.gov/rsei | EPA | Purpose: Incorporates information from the Toxics Release Inventory on the amount of toxic chemicals released, together with factors, such as the chemical’s fate and transport through the environment, each chemical’s relative toxicity, and potential human exposure. Downloads: Shapefiles, CSV files. | |
| EnviroAtlas https://enviroatlas.epa.gov/enviroatlas/interactivemap/ | EPA |  | Purpose: Provides a discovery and analysis tool with hundreds of data layers relating to ecosystem services, biodiversity, people, and the built environment. Downloads: Shapefiles, Excel, and other file formats. Inputs: Users can add Shapefiles, CSV files, KML files, GPX files, and Geo JSON files. |
| NEPAssist https://www.epa.gov/nepa/nepassist | EPA | Purpose: Facilitates the environmental review process and project planning in relation to environmental considerations. Inputs: User can add map layers from the Web. | |
| Climate and Economic Justice Screening Tool (CEJST) https://screeningtool.geoplatform.gov/en/ | CEQ | Purpose: Identifies communities that are overburdened and underserved. Uses datasets that are indicators of burdens in eight categories: climate change, energy, health, housing, legacy pollution, transportation, water and wastewater, and workforce development. Downloads: Shapefiles, Excel. | |
| Equitable Transportation Community (ETC) Explorer https://www.transportation.gov/priorities/equity/justice40/etc-explorer | U.S. DOT |  | Purpose: Uses 2020 census tracts and data to explore the cumulative burden communities experience as a result of underinvestment in transportation in the following five components: transportation insecurity, climate and disaster risk burden, environmental burden, health vulnerability, and social vulnerability. Downloads: CSV, Excel, geodatabase, Shapefile. Inputs: Users can add their own data to DOT’s ETC Explorer National Results and State Results maps and create custom views that can be exported. |
| TOOL TITLE | ORGANIZATION | FEATURES | DESCRIPTION |
|---|---|---|---|
| Urban Environment and Social Inclusion Index (UESI) https://datadrivenlab.org/urban/ | Data-Driven EnviroLab |  | Purpose: Provides data for 283 cities and almost 14,000 districts around the world. The Index includes five categories of environmental concerns: air quality, climate change, water and sanitation, urban ecosystem, and transportation. Downloads: Users can download the data by neighborhood and city into an Excel spreadsheet. Inputs: If users work in city government or have access to data for the city, they can submit data. |
| National Equity Atlas https://nationalequityatlas.org/indicators | PolicyLink and the University of Southern California Equity Research Institute | Purpose: Offers a one-stop-shop for data and policy ideas to advance racial equity and shared prosperity. Focuses on providing equity metrics that are deeply disaggregated by race/ethnicity, gender, nativity, ancestry, and income for the largest 100 cities, 150 regions, all 50 states, and the United States as a whole. Downloads: Excel, visualization images, and PowerPoint slides. |
The Equitable Transportation Community (ETC) Explorer and National Equity Atlas offer combinations of environmental, socioeconomic, and transportation-related data. ETC Explorer was developed by the U.S. DOT and emphasizes transportation equity and accessibility. It provides insights into transportation infrastructure, connectivity, and access to essential services near airports. This information is crucial for understanding transportation-related disparities and designing equitable transportation solutions. The National Equity Atlas provides socioeconomic indicators and demographic data, such as income levels, racial and ethnic disparities, education, and employment rates, which are essential factors in addressing equity concerns. EJScreen, developed by the EPA, focuses on environmental justice screening and provides data on environmental risks, demographics, and potential health impacts. It offers comprehensive information for understanding the environmental conditions near airports.
Numerous states and some municipalities have launched their own browser-based mapping tools. These tools include geographic, demographic, health, and environmental data specific to the state, county, or city geographic boundaries. They provide detailed information about pollution sources, populations made vulnerable, socioeconomic status, public health indices, and other environmental risk factors. While there may be some overlaps in the types of data and environmental indicators these tools analyze, they are often able to be customized to reflect the environmental concerns, population dynamics, data collection efforts, and policy considerations of their respective jurisdictions. In general, these tools are easy for novice users to navigate. However, CalEnviroScreen is an example of a more complex option due to the extensive embedded information it provides, which could be challenging for beginner users (OEHHA, n.d.).
Although the state and municipal tools offer valuable environmental and demographic information, their specific regional focus does present limitations when trying to establish a
universally applicable toolkit for all airport regions. Each tool is tailored to its geographic area and the unique environmental justice concerns therein. Differences in data sources, pollution indicators, and demographic variables across these tools mean they may not provide a seamless or comprehensive understanding of environmental impacts in every airport region. Additionally, they may be challenging for airports located toward the spatial edge of the geographic boundary. Two examples of municipal tools are offered in Table 3-14.
3.3.3.2 Housing
This collection of tools offers national and local spatial data that describe housing access as well as the anti-Black racism practices of American housing policy. They can be used by airports to understand the racial and spatial inequalities that contribute to patterns and policies of residential development. The tools are presented in Table 3-15.
The U.S. Department of Housing and Urban Development (HUD) developed the Affirmatively Furthering Fair Housing Data and Mapping Tool (AFFH-T) to assist communities with information that helps overcome patterns of segregation, eliminate disparities in opportunities, and create more inclusive communities free from discrimination in housing markets. The AFFH-T, usable by those with little-to-no GIS experience, is an interactive, online interface created to assist jurisdictions in fair housing planning. Airport authorities can use AFFH-T to generate maps, produce index scores, and summarize residents by protected class groups such as race/ethnicity, national origin, familial status, and disability as well as racially or ethnically concentrated areas of poverty.
Other tools provide data that help draw connections between health disparities and historic practices of racial and economic discrimination. For example, the multi-university research center called “The Digital Scholarship Lab,” led by a team at the University of Richmond, has prepared a variety of browser-based mapping tools:
- Not Even Past: Social Vulnerability and the Legacy of Redlining,
- Mapping Inequality: Redlining in New Deal America, and
- Renewing Inequality: Urban Renewal, Family Displacements, and Race 1950–1966.
Table 3-14. Browser-based mapping tools unique to specific municipalities.
| TOOL TITLE | ORGANIZATION | FEATURES | NOTES |
|---|---|---|---|
| Equity Assessment Tool | District of Columbia, District Department of Transportation | Purpose: Evaluates a project, program, or service’s impact on historically underresourced groups. Difficulty: Requires specialized training. This browser-based mapping tool is embedded as a step within an evaluation tool. Access: Tool has restricted access, but a guidebook is a public resource. Inputs: The user is prompted to input a variety of information throughout the assessment process. | |
| Twin Cities Environmental Justice Mapping Tool | Minneapolis, Minnesota, Center for Earth, Energy, & Democracy | Purpose: Provides information about sources of pollution in a community and compares environmental risks across neighborhoods based on race and income. |
Table 3-15. Browser-based mapping tools focused on housing and historic housing data.
| TOOL TITLE | ORGANIZATION | FEATURES | DESCRIPTION |
|---|---|---|---|
| Mapping Inequality: Historical Redlining Maps https://dsl.richmond.edu/panorama/redlining | Digital Scholarship Lab, University of Richmond | Purpose: Represents archival data from HOLC between 1935 and 1940. Downloads: Demographic data, economic reports, and the color-coded historical Security Maps later deemed infamous as instruments of “redlining.” The HOLC areas are mapped to the 2010 and 2020 census tracts. | |
| Affirmatively Furthering Fair Housing Data and Mapping Tool (AFFH-T) https://egis.hud.gov/affht | HUD | Purpose: Represents a baseline effort to assemble consistent, nationally available data that measures segregation, housing, transportation, environment, education, and conditions by neighborhood. Downloads: Data on 17 topics on publicly supported housing, housing problems, housing tenure, and location of affordable rental housing, including demographic and environmental health available for local government jurisdictions and some public housing agencies. | |
| Not Even Past: Social Vulnerability and the Legacy of Redlining https://dsl.richmond.edu/socialvulnerability/ https://ncrc.org/holc-health/ | Digital Scholarship Lab, University of Richmond; NCRC | Purpose: Represents current public health vulnerability data overlaid with historic redlining maps for 140 cities, redlining, and general indicators of population health. Downloads: Historic maps of redlining made by HOLC with comparison to CDC 2018 Social Vulnerability Index scores for census tracts. | |
| Renewing Inequality: Urban Renewal, Family Displacements, and Race 1950–1960 https://dsl.richmond.edu/panorama/renewal | Digital Scholarship Lab, University of Richmond | Purpose: Conveys the impact of urban renewal projects on more than a million Americans displaced from their homes and often separated from their communities. Downloads: Historically, data about displacements, housing units razed, and reuse came from the federal government’s Urban Renewal Project Characteristics from 1955–1966, a source for this tool. |
| TOOL TITLE | ORGANIZATION | FEATURES | DESCRIPTION |
|---|---|---|---|
| Mapping Restrictive Covenants https://www.nationalcovenantsresearchcoalition.com/whoweare https://mappingprejudice.umn.edu/racial-covenants/maps-data | NCRC | Purpose: Map racially restrictive covenants used for segregation of racial and ethnic groups. Downloads: Up-to-date covenants data in spreadsheet and geospatial formats for Minneapolis, Minnesota; St. Louis, Missouri; Ann Arbor, Michigan; Washington, DC; Chicago, Illinois; Seattle, Washington; Charlottesville, Virginia; Milwaukee, Wisconsin; Northern Virginia; and Iowa. |
“Not Even Past” was developed in cooperation with the National Community Reinvestment Coalition (NCRC), a 501(c)(3) nonprofit organization dedicated to solving America’s historic racial and socioeconomic wealth, income, and opportunity divides. The Not Even Past visualization tool is viewable as an interactive map, where users can select a city and view its HOLC scores from the 1930s (often referred to as “redlining”) alongside contemporary social vulnerability outcomes (including health outcomes). Airport owners and/or operators can use this tool to view the original HOLC grade for a nearby neighborhood and compare it to modern indicators of population health, such as increased prevalence of poor mental health and lower life expectancy at birth. The Not Even Past portal has maps and data for 200 cities. The NCRC also prepared a report to accompany the visualization titled “Redlining and Neighborhood Health.”
In “Mapping Inequality,” users can browse the map and read the original language of the HOLC descriptions and grades. The “Renewing Inequality” tool maps residential displacements caused by urban renewal projects during 1950–1966. Federal government reports, which come from HUD, contain data about federally funded urban renewal projects and their impact on more than a million Americans families displaced from their homes and separated from their communities. Finally, the NCRC hosts a growing number of spatial mapping projects that map racially discriminatory restrictive covenants for residential properties and provide users with the ability to view the language of the covenants.
3.3.3.3 Noise
The National Transportation Noise Map is provided and managed by the U.S. DOT and is currently the only nationally aggregated noise map tool. As summarized in Table 3-16, the purpose of the tool is to track trends in transportation-related noise across different modes of transportation on a national level. This information is valuable for environmental justice and equity because it can provide insights into the potential disparities in noise exposure experienced by different adjacent and surrounding neighborhoods. Noise is a crucial consideration for equitable urban planning and decision-making because constant exposure to high levels of noise reduces quality of life, and it could influence health outcomes over time due to the effect of noise on the human body.
The tool offers a straightforward and user-friendly interface. It is a browser-based interactive map that allows users to pan the map and view noise levels associated with various transportation
Table 3-16. Browser-based mapping tool focused on national noise outcomes.
| TOOL TITLE | ORGANIZATION | FEATURES | DESCRIPTION |
|---|---|---|---|
| National Transportation Noise Map https://www.bts.gov/geospatial/national-transportation-noise-map | U.S. DOT | Purpose: Represents potential noise levels across the nation for an average annual day for the specified year. These data are intended to facilitate the tracking of trends in transportation-related noise by mode and collectively at a national scale over time as additional maps are released. Downloads: Users can download the noise data shapefiles for 2020, 2018, and 2016. |
modes. Users can navigate the map, zoom in and out, and select the desired areas to view noise levels. The tool provides the option to select the transportation mode of interest to users and track the noise trends over time for their study area. The embedded information in this tool includes transportation modes’ noise levels (measured in 24-hour LAeq), geo-referenced data for noise (represented in an online GIS map), and year (2016, 2018, and 2020).
The tool is not designed to evaluate noise levels at precise locations or at precise times, as the data are a simplified noise model that does not consider characteristics like ground type, roadway pavement type, and weather at a local level. Though the tool should not be used for regulatory noise compliance purposes, it does communicate the general noise burden on communities near airports and other transportation facilities.
3.3.3.4 Health
Table 3-17 presents a summary of browser-based mapping tools that focus on health. The CDC collects and disseminates data describing environmental hazards that disproportionately affect the health of minority communities, such as air pollution, hazardous waste sites, and lead exposure. The CDC developed a variety of national health tools to support public health decision-making: the “Environmental Justice Dashboard”; “Environmental Justice Index”; “Places: Local Data for Better Health”; and the “National Environmental Public Health Tracking Network.” The CDC’s tools provide access to localized environmental justice and health data.
Using the CDC Environmental Justice Dashboard, the user can obtain a community score for a specific geography that is based on multiple indicators, such as population-level risk factors, environmental indicators, and resources or amenities. The Dashboard includes interactive charts, a variety of mapping options, and indicators for potential environmental justice concerns. The CDC Environmental Justice Index focuses on environmental burdens, such as air and water pollution, potentially hazardous and toxic sites, and health vulnerabilities, such as pre-existing chronic disease burdens including asthma, cancer, high blood pressure, diabetes, and poor mental health. Using Places: Local Data for Better Health, the user can download data by county, place, census tract, and zip code and create a data visualization on 13 health outcomes (nine for preventive service uses and four for chronic disease-related health risk behaviors) in addition to poverty and/or race/ethnicity. Finally, using the Environmental Public Health Tracking Network, users can create customized datasets to compare different measures of environmental health at the state and national levels.
The Environmental Justice Dashboard is the most effortless to use as it has a simple graphic representation of community data (at the county level) with major environmental pollutant data trends [water quality, age of housing, PM (particular matter) 2.5, ozone], environmental justice
Table 3-17. Browser-based mapping tools focused on health.
| TOOL TITLE | ORGANIZATION | FEATURES | DESCRIPTION |
|---|---|---|---|
| County Health Rankings https://www.countyhealthrankings.org/explore-health-rankings | University of Wisconsin Population Health Institute; Robert Wood Johnson Foundation | Purpose: Represents county-level measures of health outcomes and health factors. Health Outcomes include two subareas: length of life and quality of life. Health Factors include four subareas: health behaviors, clinical care, social and economic factors, and physical environment. Each subarea is composed of many individual measures. The tool allows comparison of counties within a state. Downloads: Trend datasets, state- and national-level data, comparison across states and counties. | |
| Places https://experience.arcgis.com/experience/22c7182a162d45788dd52a2362f8ed65 | CDC | Purpose: Presents “Better Health, County, and Local Data” 2022 release with 29 measures in categories: 13 for health outcomes, nine for preventive services use, four for chronic disease-related health risk behaviors, and three for health status. Downloads: Maps for model-based estimates of 29 chronic-disease-related measures at county, place, census tract, and ZIP Code Tabulation Areas (ZCTAs) levels. | |
| National Environmental Public Health Tracking Network https://ephtracking.cdc.gov/DataExplorer/ | CDC | Purpose: Represents a core set of health, exposure, and hazards data, information summaries, tools for noninfectious disease, and environmental data. Downloads: .zip files of environmental hazards, exposures, and diseases data in a .csv (common separated value) format. | |
| Environmental Justice Index https://onemap.cdc.gov/portal/apps/sites/#/eji-explorer | CDC’s Agency for Toxic Substances and Disease Registry | Purpose: Focuses on environmental burdens such as air and water pollution, potentially hazardous and toxic sites, and health vulnerabilities, such as pre-existing chronic disease burdens including asthma, cancer, high blood pressure, diabetes, and poor mental health. | |
| MUA Find https://data.hrsa.gov/tools/shortage-area/mua-find | HRSA | Purpose: Represents medically underserved areas (MUA) and medically underserved populations (MUP) with geographic area, population, and facility health professional shortage area (HPSA) designations data for primary care, dental health, and mental health throughout the country. Downloads: Mapping data on facilities, providers, sites/areas, which includes rural health areas; HRSA grants, loans, scholarships; populations and public health data (demographics, opioid treatment). |
ranking, and health burdens. CDC’s Environmental Public Health Tracking, Places, and Environmental Justice Index are more complex and robust tools, some of which would require some basic knowledge of working with spreadsheets and spatial data or experience working with programming languages to access the datasets.
The Health Resources and Services Administration (HRSA), an agency in the U.S. Department of Health and Human Services, hosts “MUA Find.” Users can pan the map to see medically underserved areas (MUAs) that have shortages in primary care, dental health, and mental health. Additionally, the county health rankings tool is an initiative managed by the Robert Wood Johnson Foundation and the University of Wisconsin Population Health Institute that compiles and provides a county-level ranking of about 100 measures of health. Measures of health are sorted into the health outcomes subcategories (such as length of life and quality of life) and health factors that influence health outcomes (such as health behaviors, clinical care access, and the physical environment).
3.3.3.5 Children
As summarized in Table 3-18, the Child Opportunity Index (COI 2.0) measures racial/ethnic equity and neighborhood opportunity at the census tract level and can be used to advance healthy child development. For example, children’s exposure to risks, such as proximity to hazardous waste dump sites (Superfund sites), is a detrimental neighborhood factor that can hinder their development. In contrast, living in neighborhoods with better resources, healthier environments, and a higher educational opportunity influences children’s postsecondary pathways and can lead to college degrees and better jobs.
The index focuses on contemporary features of neighborhoods that are affecting children, based on 29 indicators spanning three domains: education, health and environment, and social and economic. COI 2.0 data are available for virtually all U.S. census tracts for 2010 and 2015. Other tools that track children’s environmental health are available through an online CDC portal at https://www.cdc.gov/environmental-health-tracking/php/data-research/childrens-health.html.
3.3.3.6 Select and Use the Appropriate Tool
This section offers suggestions and techniques to select and use tools to evaluate environmental justice and equity. Before any data collection or analysis begins, it is important to establish the intention of the inquiry and reflect on the resources available to complete the work necessary to respond to the inquiry. To establish the intention, consider the purpose, audience, and processes influencing the inquiry. From a practical standpoint, different tools are better equipped to support different types of intentions. For example, the types of variables that are embedded in the tool may apply to different purpose and process scenarios. Additionally, the analysis may require different types of visualization outputs to communicate with different audiences. Some tools may need to be combined to meet the expectations set by the intention.
Table 3-18. Browser-based mapping tools focused on national equity outcomes for children.
| TOOL TITLE | ORGANIZATION | FEATURES | DESCRIPTION |
|---|---|---|---|
| The Child Opportunity Index 2.0 https://www.diversitydatakids.org/maps/ | Diversity Data Kids, Brandeis University | Purpose: Provides a composite index measured at the census tract level that captures neighborhood resources and conditions that matter for children’s healthy development in a single metric. |
Table 3-19 offers questions to reflect on during the preplanning stage of spatial analysis. The right column provides possible answers for an example scenario. Table 3-20 and Table 3-21 present two browser-based tools that could apply to preplanning scenarios presented in Table 3-19.
3.3.4 What Are Some Common Limitations to These Spatial Data, Methods, and Tools?
When using quantitative spatial analysis to answer questions about environmental justice and equity, it is necessary to understand the limitations of the approach. Limitations vary depending on the specific characteristics of the data, methods, and tools that were used to accomplish the analysis task. It is best practice to consult the published instructions, user guides, and technical manuals for datasets and tools. This ensures that the investigator understands how the data were processed, what the data variables represent, how the data were collected, when they were collected, and by whom. Professionally curated datasets and tools often contain explicit discussions of limitations.
Presence of Limitations
The presence of limitations does not necessarily invalidate analysis results, but it may mean that the results are likely to be an overestimate (or underestimate) of reality.
An informed discussion of limitations can guide additional analysis strategies to verify or triangulate the findings of the spatial analysis. Options may include conducting a sensitivity analysis, which helps understand how model outputs vary depending on input assumptions or seeking out supplemental data collections.
3.3.4.1 Demographic Data Limitations
It is important to understand the limitations of the data sources embedded in the browser-based tools, many of which are from the U.S. Census, administrative records, or sampling surveys.
First, the survey questions used to collect demographic data may not be fully inclusive of all populations. For example, consider the decennial census administered by the U.S. Census Bureau. The purpose of the decennial census is to provide an official count of the U.S. population every 10 years (approximately 330 million people in 2020) as mandated by the U.S. Constitution, but it is also used as a valuable source of sociodemographic data. The data collection effort requires tremendous resources to count every person and survey the demographic characteristics of every household in the 50 U.S. states, the District of Columbia, and five U.S. territories (Puerto Rico, U.S. Virgin Islands, Guam, American Samoa, and the Commonwealth of the Northern Mariana Islands). However, the decennial census does not fully capture all groups made marginalized. For example, the questionnaire only offers an option to self-report same-sex households, which does not include the range of sexual orientations or gender identity (Wang and Jin 2023). In addition, the definition and inclusion of racial and ethnic categories have changed over the years, which can limit longitudinal comparisons.
Even when the questionnaire aims to be inclusive, the data collection and sampling methods may still underreport certain population groups. Households in rural and remote areas are known to have lower response rates to the U.S. decennial census, which leads to undercounts and underrepresentation of those groups in the datasets (U.S. Census Bureau 2019). Undercounts are more pervasive within certain racial and ethnic groups. The 2020 Census undercounted the “Black or African American population, the American Indian or Alaska Native population living on a reservation, the Hispanic or Latino population, and people who reported being of Some Other Race” (U.S. Census Bureau 2022).
When choosing demographic data products, there are trade-offs between the sampling accuracy and the recency of the data. For example, the decennial census is considered very accurate due to the resources invested to count every household; however, it is infrequent—occurring every 10 years.
Table 3-19. Example framework for preplanning a spatial analysis.
| REFLECTION PROMPT | EXAMPLE RESPONSE |
|---|---|
| Stage 1: Establish the needs and intentions that are motivating the analysis. | |
| Purpose: What type of information are you seeking? What do you want to learn about equity or environmental justice? | The airport is concerned about environmental justice impacts of contaminated soil potentially entering a nearby waterway during construction operations. The waterway is popular for fishing. A local tribe has expressed concerns to the airport in the past. There is an elementary school within walking distance of the waterway. |
| Process: What decision-making or planning process will this analysis influence? | Stormwater prevention plan, construction specifications and phasing, and contracting. |
| Audience: Who will see this? Who does this analysis serve? | Intended as an internal document but content may be discussed in public meetings. |
| Stage 2: Clarify the scope of spatial analysis. | |
| Question: What specific question(s) are you asking? | What are the demographics of the neighborhoods near the waterway and downstream of the airport? Are there vulnerable groups who would be affected if they drink or eat the pollutants, like children or older adults? Is there food insecurity in the area? |
| Data: What data are needed to answer the question? | Sociodemographic data (focus on age, race), household income or poverty status, health outcomes, food access. |
| Method: What methodological approaches could help answer the question? | Exploratory analysis. Best if the data are aggregated at the zip code level or census tract level. |
| Equity/environmental justice: How is this intention connected to equity or environmental justice? | We identified a possible hazard and want to understand the context of harm if we do not adequately control the hazard. Specifically, if this would harm communities that are already facing compounding inequities. How can we be more attentive to their needs? |
| Stage 3: Document the skills and resources available to complete the analysis. | |
| Information technology: What sort of information technology support does the team have access to? | No in-house GIS software; reliable internet connectivity; desktop machine with data storage; IT (information technology) support staff. |
| Staff knowledge: What disciplinary knowledge does the team have to try to answer the question? | Staff know federal and state water quality regulations and metrics, best practices for stormwater management, and basics of waterway species/ecology. |
| Staff technical skills: What technical skills does the team have to try to answer the question? | Confident with simple statistics, able to create simple charts in Excel. |
| Community knowledge: Who needs to be involved from the local community? | Subsistence fishing community, the local tribe, elementary school administrators, families attending the school, and local food pantry administrators. |
Table 3-20. Summary of the Child Opportunity Index 2.0 centered on children’s well-being.
| BASIC INFORMATION | |
|---|---|
| Owner | Diversity Data Kids, Brandeis University. |
| Purpose of the Tool | The Child Opportunity Index 2.0 (COI 2.0) is a composite index measured at the census tract level that captures neighborhood resources and conditions that matter for children’s healthy development and well-being. |
| Geography | The scope of the dataset is nationwide. The data are aggregated at the scale of the census tract, zip code, and county. |
| Website | https://www.diversitydatakids.org/child-opportunity-index. |
| USER INTERFACE OVERVIEW | |
| User Interface | On the homepage, users can explore the data available from the index, read more about the indicators of child well-being, and view results from different geographic areas. To access more detailed data, users can search by their location, explore detailed results and maps, download data, or access useful interactive displays such as heat maps. Users can also use the interactive map feature to compare different geographic areas. Additionally, users can access related resources and publications that describe the index methodology. |
| Tool Instructions | Indexing methods: http://new.diversitydatakids.org/sites/default/files/2020-02/ddk_coi2.0_technical_documentation_20200212.pdf. |
| Zip code methods: http://new.diversitydatakids.org/sites/default/files/file/coi-2.0-zip-codedata-technical-documentation_010822_0.pdf. | |
| INPUTS AND OUTPUTS | |
| Data Embedded in Tool | The index focuses on contemporary features of neighborhoods that affect children. It is based on 29 indicators spanning three domains: education, health and environment, and social and economic variables. Examples of indicators include parents’ education level and household income; the availability of public transportation; access to green space and healthy food; walkability; the rate of child health insurance coverage; hazardous waste dump sites within a 2-mile radius; and industrial pollutants in air, water, or soil. COI 2.0 data are available for virtually all U.S. census tracts for 2010 and 2015. Zip-code-level estimates of neighborhood opportunity are derived from the 2015 COI 2.0 census tract data. |
| Inputs Allowed? | No. |
| Exports, Outputs? | Users can export datasets in CSV format. https://data.diversitydatakids.org/dataset/coi20-child-opportunity-index-2-0-database. |
| Limitations? | Unlike census tracts, zip codes do not have precisely defined geographic boundaries, so it can be a challenging spatial unit of analysis. Also, the index dataset does not contain some measures that are known to be relevant to children, such as violent crime, neighborhood social capital, and health care transportation costs. |
Table 3-21. Summary of a browser-based environmental justice screening and mapping tool, EJScreen, with a comprehensive approach to screening demographics and environmental exposures for small areas.
| BASIC INFORMATION | |
|---|---|
| Owner | EPA |
| Purpose of the Tool | EJScreen allows users to access high-resolution environmental and demographic information for locations in the United States and compare their selected locations to the rest of the state, EPA region, or the nation. |
| Geography | The scope of the dataset is nationwide. The data are aggregated at the scale of the census tract and census block group. |
| Website | https://www.epa.gov/ejscreen. |
| USER INTERFACE OVERVIEW | |
| User Interface | EJScreen users choose a geographic area; the tool then provides demographic, socioeconomic, and environmental information for that area. Users can pan and zoom across the United States and some U.S. territories. At a minimum, the user needs a basic familiarity with base map navigation and an understanding of the EJScreen environmental and demographic indicators. |
| Tool Instructions | https://www.epa.gov/ejscreen/learn-use-ejscreen. |
| Technical Information | https://www.epa.gov/ejscreen/technical-information-about-ejscreen. |
| INPUTS AND OUTPUTS | |
| Data Embedded in Tool | All EJScreen indicators are publicly available data. EJScreen displays this information and includes a method for combining environmental and demographic indicators into environmental justice indexes. EJScreen includes 12 environmental indicators, seven socioeconomic indicators, 12 environmental justice indexes, and 12 supplemental indexes. |
| Inputs Allowed? | The user may import other available maps via ArcGIS online. |
| Exports, Outputs? | The tool provides a number of capabilities, including the ability to generate a standard report for a selected area. To interpret the standard reports, the user needs to know how to interpret population-weighted averages, percentages, and percentiles. The standard report provides environmental justice indexes and environmental and demographic reports for that area. In addition to a bar chart (where scores for the location can be compared to state and national scores), users can generate a tabular view for downloading or a graphic standard report in PDF format. More advanced users can export shapefiles for use in ArcMap or statistical software. The available data includes the environmental justice and supplemental indexes as compared to the state or nation. They are available for download at the block group or tract level resolution in spreadsheet (.xlsx), geodatabase (.gdb), or .csv formats. |
| Limitations? | EJScreen is intended only for preliminary screenings to examine issues relevant to environmental justice. It is not a formal risk assessment, nor would it be appropriate to exclusively rely on EJScreen for environmental justice analysis. Some data may be several years old. Analysis of a singular block group may contain high levels of statistical uncertainty. |
In contrast, the American Community Survey (ACS) is another data product from the U.S. Census Bureau that is completed more frequently at 1- and 5-year intervals and contains more questions (U.S. Census Bureau 2020; Raglin 2022). However, the data is a statistical sample of approximately 3.5 million people annually. These smaller sample sizes increase the level of sampling error for small geographic areas, such as census block groups. For small-area analysis (see definition in Section 3.4.4.2), the decennial census and the 5-year ACS data are typically most appropriate.
While not all data products will be focused on demographics, they will likely have similar limitations regarding response rates, sampling accuracy, and recency of data.
3.3.4.2 Methods Limitations for Small-Area Environmental Justice Analysis
In the case of airports, exploratory environmental justice analysis usually involves a small area of analysis. For example, the investigator’s geography of interest may be a small area delineated by proximity to the airport facility, noise contours, or other pollutants such as contaminated groundwater plumes. Alternatively, the investigator may seek to compare multiple geographic areas, perhaps comparing a changing neighborhood over time, or comparing different airport-adjacent neighborhoods to one another, or comparing an airport-adjacent neighborhood to a larger region.
Some important methodological considerations for small-area analysis include the basic spatial unit, spatial downscaling, and spatial upscaling (see Table 3-22). Typically, the smallest unit for population data is the census block group. However, this high-resolution spatial unit may not always be available or may not be joinable with variables in other datasets. If the basic spatial unit is geographically large (e.g., metropolitan statistical area), then it is a major limitation for small-area analysis. To conduct small-area analysis, basic spatial units need to be downscaled to describe phenomena for small areas. However, downscaling methods, such as population-weighted estimates or areal-weighted interpolation, require advanced spatial analysis skills and access to GIS software. Another challenge related to the basic spatial unit is that the delineation of spatial unit polygons may change over time. For example, census tract boundaries are modified over time, either splitting into multiple tracts as the population grows or consolidating as the population declines. This can introduce challenges for longitudinal studies and may require spatial upscaling and interpolation.
Environmental justice analysis is often conducted as a form of spatial coincidence analysis, which is also referred to as unit-hazard coincidence analysis. In this form of analysis, proximity to the facility or other hazards serves as a proxy for harm or exposure. One limitation of spatial coincidence analysis is that residential proximity to the airport hazard site is not always a guarantee of experiencing a severe or adverse environmental impact, so this method is typically more appropriate for an exploratory analysis than a causal analysis. Hazards can be represented as points (e.g., a specific chemical spill location on the airfield) or polygons (e.g., a noise contour). The Airport Reference Point (ARP) can also be used as a point estimate for the epicenter of environmental hazards associated with airport operations. The ARP is published by the FAA as the latitude and longitude of the approximate geometric center of all usable runways.
For exploratory or comparative studies that rely on spatial analysis of demographic data, one of the common challenges is choosing the spatial extent of the analysis. The spatial extent represents the geographic area that the investigator is evaluating and may be specified as a buffer area. A buffer area typically emanates outward radially from a point or polygon, but the radial length depends on the question motivating the analysis. In a broad study of demographic groups exposed to adverse environmental impacts at airports over time, Woodburn (2017) used a
Table 3-22. Methodological considerations in small-area analysis.
| TERM | DEFINITION | EXAMPLE VISUAL |
|---|---|---|
| Basic Spatial Unit | The smallest unit of spatial information (e.g., pixels, parcels, census block group, census tracts). |  |
| Spatial Downscaling | The disaggregation process of inferring high-resolution information from low-resolution variables. This divides data from a singular large area into multiple smaller areas (e.g., census tract to census block groups). |  |
| Spatial Upscaling | The aggregation process of combining high-resolution information into a low-resolution variable. This combines data from multiple smaller areas into a singular large area (e.g., census tracts to metropolitan statistical area). |  |
| Buffer Area | The area around a geographic point (or polygon) of interest. Buffers are often circular with a specified radius centered on the point of interest. |  |
5-kilometer buffer radius to locate census block groups whose centroid existed inside the buffer, explaining the purpose was to
identify the generic area that was facing disproportionate exposure to noise and emissions . . . and who would also be likely to absorb the altered or exacerbated impacts stemming from expansion. Thus, a radially-defined geographic boundary was used to define the [airport-adjacent community]. Prior scholarship identified that neighborhoods within 5 kilometers of an airport bear a disproportionate environmental cost per person, particularly with respect to airport noise [(Wolfe et al., 2014)]. All residents within that boundary are likely to experience harmful environmental impacts from airport operations, although some neighborhoods within that area will be more negatively impacted than others. (Woodburn 2017, 3)
In another study that focused on population exposure to aircraft lead emissions, the EPA (2020) used two semicircles with a 500-meter radius at each end of the runway to serve as spatial buffer areas, explaining
the maximum impact area for ground-based lead emissions from piston-engine-powered aircraft occur at a standardized location at or near each runway end where preflight run-up checks and takeoff operations occur. In order to identify the population most highly exposed to ground-based emissions from aircraft during preflight run-up checks and takeoff operations, an end-of-runway buffer was created. (EPA 2020, 9)
One limitation of the spatial buffer method is related to the population density near the airport and the overall shape of the basic spatial unit’s polygons. Census block groups and tracts cover larger geographic areas when they have lower population density. This means that the edges of the polygon are more likely to far exceed the radial buffer area. Trimming the edges of basic spatial units to adhere to the buffer area requires more advanced interpolation skills.
3.3.4.3 Tool Limitations
A significant limitation of spatial analysis tools is that they tell an incomplete story about environmental justice and equity. Even tools that aim to be comprehensive lack the voices and experiences of the population(s) being evaluated.
When using browser-based data visualization tools, it is important for users to review each tool’s supporting materials and technical documentation to understand where and how the tool curates their datasets and processes them. For example, comprehensive tools often create index metrics, which may stem from the tool owner’s original indexing methodology. Indexing methods combine multiple variables into one metric, with the aim of using multiple variables to represent one concept. Index variables do not retain individually coherent units of measure because they are a mixture of multiple variables, so in some ways, they lose their intuitive explanatory power. However, they can be successful in curating a holistic view of a broader concern. For example, within the Climate and Economic Justice Screening Tool, the White House’s CEQ created eight indicators of different “burden” categories. The climate change burden category is a binary variable that identifies whether a census tract is considered disadvantaged with respect to climate change. According to their index methodology, a census tract is disadvantaged if it is “at or above the 90th percentile for expected agriculture loss rate or expected building loss rate or expected population loss rate or projected flood risk or projected wildfire risk” as well as “at or above the 65th percentile for low income” (CEQ 2022, para. 5). Since race is not considered in this tool’s methodology, it would be considered a limitation in understanding racial equity or environmental racism. Tools that use indexes have additional limitations related to methodological decisions about index weighting and proxy variables.
3.3.5 What Are Common Pitfalls and Challenges to Collecting, Analyzing, and Using Equity and Environmental Justice Data to Inform Decision-Making?
One challenge in the airport setting is that regulatory compliance may be the sole motivator driving a spatial environmental justice analysis. When regulatory compliance is the main goal, it can lead to a narrow focus on airport-controlled emissions and environmental impacts, which then obfuscates the totality of compounding harms. For example, airport facilities generate vehicle traffic on surface roads and via aircraft, but, from a regulatory perspective, airport owners are not responsible for point-source emissions from road traffic or en route aircraft. Thus, an airport focused on regulatory compliance may only be interested in measuring emissions from airport-controlled sources, such as the airport ground fleet. Similar regulatory motivations can apply to noise impacts. Although road traffic and rail traffic contribute to a community’s noise burden, it is not airport-controlled noise, so they are not necessary to measure for regulatory noise compliance.
Common Pitfalls and Challenges
- Knowing when to integrate spatial analysis in the planning process.
- Knowing who to consult in the community during spatial analysis.
- Knowing how to humanize data results when communicating results of spatial analysis.
When regulatory compliance is the main motivator, it is easy to overlook the overall environmental burdens on a community, which then undermines the broader purpose of environmental justice and equity analysis. The resolution to this challenge is to create clear points within the airport planning processes where exploratory analysis of the
bigger picture of environmental harm is expected and can play a meaningful role in guiding airport development and equity-oriented actions.
Another common challenge is integrating local, qualitative information into the spatial analysis. This requires actively sharing and seeking feedback from the communities that are being evaluated. Community insights can lead to ideas on how best to represent local context and history in the spatial analysis. Do these communities agree with how they are being characterized and described in the analysis? Do the results of the analysis resonate or reflect what they have experienced or what they hear about their neighbors’ experiences? Such feedback can add depth to the interpretation of the spatial analysis and identify its limitations. The process of working together to construct meaningful and accurate spatial information that centers the experiences of the community can also be an act of relationship-building between airport owners and airport-adjacent communities.
A third challenge is related to data visualization. Quotes, images, and humanized iconography can be paired with technical charts and maps to tell a more complete story about why the quantitative data matters and to more directly link the data to the lived experience of the community members (Urban Institute 2021; 2022). Spatial analysis abstracts human experiences across large geographies. The data processing and interpretation stages may focus too heavily on raw data and trends across large areas and lose focus on the people and places experiencing environmental harm or degradation. Graphics can be designed to visually humanize the data—for example, replacing data points with human icons, pairing images of families or neighborhood places alongside descriptive charts, or providing quotes from local community members to personalize more general results. This practice also aids in data communication because it prioritizes a plain language that all people can understand.
3.4 Module 4: Embed and Institutionalize Equity
![]() Module 4 Focus
Module 4 Focus
Provide information for airport practitioners to incorporate equity into airport plans and actions in a holistic manner by evaluating the organization’s values and governance systems, structure, and decision-making processes.
Building the organizational capacity to improve equitable outcomes for groups made marginalized requires formal practices and policies to ensure sustained commitment to this work over time. Embedding and institutionalizing equity is a strategic effort to transform the processes of organizational decision-making across hierarchies and functional units and requires reevaluation of existing systems, procedures, and resource allocation.
This section includes suggestions and techniques for airports to holistically embed and institutionalize equity and environmental justice considerations into their organizational culture, airport planning processes, and actions. It also suggests strategies and tools to assess and monitor outcomes.
3.4.1 What Does It Mean to Embed and Institutionalize Equity into an Airport Organization?
Incorporating equity into airport plans and actions in a holistic manner means that principles and practices that promote fairness, justice, and equal opportunities for all are deeply ingrained into airport organizational structure, decision-making, and the organization’s values, policies, and processes. Equity in an airport setting ensures that resources and opportunities are allocated fairly for employees and that environmental or other harms associated with airport operations are not borne by racialized communities.
An organizational commitment to prioritizing equitable outcomes requires more than a personal sense of goodwill or individual good intentions among staff. While it is necessary for
individual staff members to obtain an understanding of equity and environmental justice principles, the organization itself should develop formal practices and policies that make it practical and preferable for staff to make choices that deliver equitable outcomes. Embedding and institutionalizing equity is a strategic effort to transform the processes of organizational decision-making across hierarchies and functional units. Refer to Section 3.4.3 for strategies airports can utilize to embed and institutionalize equity considerations into their plans and decision-making processes. As an example, the U.S. DOT recognizes that institutionalizing equity at an organizational level requires that “resources are continuously provided to embed equity, civil rights, and social justice initiatives into the Department’s decision-making processes, and equity is a core part of the Department’s mission” (U.S. DOT 2022, 6).
3.4.2 Why Is Embedding and Institutionalizing Equity Within an Airport Organization Important?
Airport governing bodies and leadership should acknowledge historical harms and reimagine the systems and processes that led to the systemic inequities that exist today. A top-down approach to institutionalizing equity allows existing systems and processes to be interrogated and reimagined. Incorporating an equity lens and culture shift has a broad geographical application and can result in improved outcomes for not only the airport workforce but also stakeholders, such as the traveling public, nearby communities, and business partners. It also helps improve accountability, avoid future harm, and prevent adverse environmental justice or equity outcomes associated with airport decision-making.
Organizational culture can be described as shared values that a majority of individuals hold within an organization. Organizational culture enhances cohesion, creates a sense of identity and community, empowers employees, and is driven by the mission and strategy of the organization. Creating an organizational culture that centers on equity and justice takes time and requires work at both a leadership and staff level. A culture of inclusion and belonging can help the organization embrace and improve the diversity of its workforce, potentially improving retention and employee satisfaction rates for racialized people. Retaining diverse employees can help an organization recruit and hire diverse employees who represent the communities that they serve.
Internally, embedding and institutionalizing equity into the airport organization fosters an environment in which individuals can relate to equity concepts from their own unique perspectives and make their own connections to the work. Airport staff and other airport practitioners need to understand how equity fits into their work and is relevant to them and the airport organization’s strategic plan, goals, and key performance metrics. Airport practitioners require organizational support and empowerment to operationalize and utilize equity and environmental justice data and principles in their specific jobs, the systems and processes they work within, and the decisions they influence or make.
Equitable decision-making processes are more transparent, inclusive, and responsive to the needs and concerns of affected communities. Equitable decision-making fosters collaboration, builds trust, and reduces the likelihood of perpetuating or exacerbating environmental harms. Embedding and institutionalizing equity promotes a sustainable airport environment that benefits both the organization and the surrounding communities.
3.4.3 What Are Some Strategies or Tools My Airport Can Utilize to Embed and Institutionalize Equity Within the Organization?
Figure 3-3 outlines potential steps that airports can take to work toward the goal of embedding and institutionalizing equity considerations into their plans and decision-making processes.

These steps are not necessarily sequential and can be revisited over time to inform and build upon themselves. This section explains each of the steps in more detail and provides resources to help accomplish them.
3.4.3.1 Formalize Equity Commitments and Set an Equity-Centered Vision for the Organization
A clear mission and vision and accompanying strategic plan drive organizational change at airports. Depending on their governance, leadership, and organizational structure, airports may integrate equity into their adopted guiding policies, such as their charter, strategic plan, or mission/vision statement. Airport governance and leadership commitment to and support of equity and justice in guiding policies signals support from the top down and can help to build an organizational culture that fosters these ideals. Leadership’s formal commitment to prioritizing equity elevates the topic to the same level as other airport priorities such as safety, operations, customer experience, etc. (Krop et al. 2020).
ACRP Synthesis 40 identifies steps for cohesive organizational change at airports and recognizes that organizational change takes time to initiate and implement (Kenville and Smith 2013). The report identifies challenges such as irregular operations, increased competition, regulatory change, economic pressures, and external pressures as drivers of organizational change. Today, airports increasingly face internal and external pressures to address racial equity and improve equitable outcomes that can drive organizational change. These pressures or leadership initiatives may lead the airport to formalize equity commitments and set an equity-centered path for the organization. Three examples of different types of formal commitments are briefly introduced herein and further detailed in Chapter 4.
A commission-level commitment to social equity and shared prosperity has enabled the Port of Portland, which owns and operates Portland International Airport, to devote resources to improving outcomes for racialized and underrepresented people in the Portland, Oregon, region. The Port’s mission is to “build shared prosperity for the region through travel, trade, and economic development” to achieve its vision of a “prosperous region, where quality jobs, multigenerational wealth, and access to markets are equitable and shared” (Port of Portland, n.d., 1). Refer to Section 4.1.3 for more details.
In another example, the City and County of San Francisco Board of Supervisors created the Office of Racial Equity (ORE) in 2019 through a local ordinance following a heightened realization that City and County policies and governance practices influence racial disparities. The local ordinance authorized ORE to require each department to create a Racial Equity Action Plan (REAP), including SFO, which is an enterprise department of the City and County of San Francisco. SFO’s REAP provides one of the first examples, in transportation, of an approach to strategic planning that directly acknowledges past and present harms while actively embracing racial equity as an aim. Refer to Section 4.3.2 in the Case Studies.
In January 2020, the Port of Seattle passed “Resolution 3767: The Duwamish Valley Community Benefits Commitment.” The resolution, cowritten with the Port staff and community members, guides the implementation of the Duwamish Valley Community Equity Program that was established in May 2019 to work toward three goals: 1) Community and Port Capacity Building for Ongoing Collaboration, 2) Healthy Environment and Communities, and 3) Economic Prosperity in Place (Port of Seattle Commission 2019). This resolution unequivocally added “equitable engagement” and “environmental justice” within the expected scope of the Port’s responsibilities to the community. Such resolutions clarify that the well-being of the community is part of the “business” of the port operator, which then provides Port staff and project managers the administrative reasoning to pursue and fund project actions that center and serve the community. Refer to the environmental case study in Section 4.5.2 for more details.
3.4.3.2 Identify Shared Core Values and Guiding Principles
Airport organizations can ensure that core values and guiding principles reflect the sentiments of their workforce and stakeholders (internal and external), including their priorities, lived experiences, and needs. Shared values could be identified through a self-assessment (see Module 1) and/or through meaningful engagement with both internal airport and external community stakeholders (see Module 2). Working toward shared goals can help set intentions for both leadership and employees to consider equity in their work.
3.4.3.3 Build Organizational Capacity to Improve Equity Outcomes and Embrace Diversity
ACRP Synthesis 40 acknowledges that organizational structure helps an airport achieve its mission and strategy (Kenville and Smith 2013). Therefore, if leadership modifies guiding policies to address racial equity and improve equitable outcomes, the organizational structure may also require modifications and financial resources to support the new objectives. This may be illustrated through the creation of new departments, program offices, and roles to support equity and related initiatives or programming. Airport managers and leadership may have equity-based key performance indicators and metrics on which their performance can be measured. For example, recognizing the need for an organizational structure to support equity work, the Metropolitan Washington Airports Authority (MWAA) Board of Directors established a new Office of Diversity, Inclusion, and Social Impact in 2021 “charged with aligning the Airports Authority Diversity, Equity, and Inclusion strategic initiatives with the organization’s overall business strategy, goals, and objectives to ensure that our organization represents and reflects the region that we serve” (MWAA 2021, 14).
Airports must dedicate and invest resources to build the organizational capacity necessary to support equity. Resources may include but are not limited to employee time, effort, and energy, along with the space and tools needed to facilitate capacity building, trust building, and collaboration opportunities among staff. Building organizational capacity may include some of the following considerations.
- Creating equity-related leadership positions and related departments or divisions with staff to align organizational structure with equity work and priorities. These leaders drive
- Establishing multidisciplinary action teams, committees, and/or councils to serve as equity champions who can advocate at both the executive and staff levels of the organization. For example, the Port of Seattle Commission adopted a motion in 2020 to “examine Port operations and policies for sources of racial bias and discrimination and to develop programs and policies eliminating inequity in all aspects of the organization” (Port of Seattle Commission 2020). This motion established an internal Change Team composed of Port staff representatives from all Port departments. The Change Team is expected to work with the Port’s Office of Equity, Diversity, and Inclusion (OEDI) to lead assessments of equity and anti-racism within the Port. Refer to “Case Study Example 1: Participatory Budgeting” in Section 4.2.2 of the Case Studies for additional information.
- Implementing an equity peer review group that reviews projects from an equity perspective and works with other colleagues to incorporate equity concepts. As an example from the county planning perspective, the Montgomery County Planning Department in Maryland has implemented an equity agenda for planning. One component of this agenda is the creation of an Equity Peer Review Group that provides feedback on projects, policies, and engagement strategies (Montgomery County Planning Department 2020).
- Operationalizing DEI in the workplace through workforce initiatives such as creating employee resource groups (ERGs), mentorship programs, training programs, and leadership programs (Krop et al. 2020). These types of groups support continuous improvement and learning opportunities for airport staff. For example, Dallas-Fort Worth International Airport (DFW) utilizes ERGs to enable staff with similar backgrounds and interests to network and collaborate. DFW lists its ERGs on its recruiting and careers website, showing that ERGs provide value as an attraction and retention tool for racialized and othered groups so that those individuals know they are welcome and supported within the airport’s organizational culture (DFW 2023).
- Integrating an equity lens in airport decision-making through staff consideration by asking the following questions in their everyday business and planning processes (PolicyLink 2021).
- Who will benefit?
- Who may be harmed?
- Who is the decision maker?
- Who drives funding?
- Who leads and governs?
the work and inspire change. For example, upon the creation of the new Office of Diversity, Inclusion, and Social Impact, MWAA also created and staffed a new role of Vice President for Diversity, Inclusion, and Social Impact in 2021 to lead the office and represent equity considerations at the executive leadership level. By the end of 2022, MWAA had devoted resources to support a Diversity, Inclusion, and Social Impact team of three positions supporting the Vice President, including a Diversity Outreach Manager, Social Impact Manager, and Employee Development Manager (MWAA 2022).
For example, in Maryland, the Montgomery County Planning Department has adopted elements of planning with an equity lens. The planning department employs processes for project teams to consider project history and context related to historic advantages or disadvantages of the community, perform authentic engagement and communication with residents who were historically excluded from planning processes, review the distribution of existing resources and investment, and determine how policies and projects may influence future outcomes for community members (Montgomery County Planning Department 2020).
Racial equity impact assessment tools help assess how various racialized or othered groups may be affected by a proposed action or decision to prevent inequitable outcomes. Race Forward, a national nonprofit organization focused on movement building for racial justice, provides a guide containing sample questions for conducting a racial equity impact assessment (Keleher 2009).
Participatory budgeting involves budgeting with an equity lens. The Port of Seattle’s OEDI worked with the Port’s Commission and Executive Leadership Team to develop a participatory budgeting framework to help Port departments analyze if their budget requests will benefit or cause harm to certain communities. The framework also includes questions that help Port departments analyze how they can engage with the community when developing their budgets. Refer to Section 4.2 in the case studies for more details.
3.4.3.4 Adopt Accountability Tactics to Assess and Monitor Outcomes
Accountability structures exist within airport organizations and governance. Some airports may be subject to local, city, state, and governing body requirements related to equity initiatives. To report back to governing entities, airports may choose to adopt tools to assess and monitor the outcomes of their initiatives to determine progress over time and where to focus future efforts. Tracking and documentation are important to determine how the organization is performing and making progress toward stated goals and objectives.
A variety of tools are available to assess progress on initiatives:
- Global Diversity, Equity & Inclusion Benchmarks: Standards for Organizations Around the World provides a framework for establishing an organizational DEI initiative (Molefi et al. 2021).
- The Results-Based Accountability (RBA) tool begins with identifying the desired results and provides a framework to work backward toward the means to ensure that plans work toward community results with stakeholder-driven implementation. The RBA tool intends to disrupt historic patterns within planning processes to improve racial equity outcomes. “RBA also helps distinguish between population-level (whole groups) indicators that are the responsibility of multiple systems and take a long time to shift, and performance measures (activity-specific) that organizations can use to determine whether what they do is having an impact” (Bernabei 2017, 7).
- Organization-specific implementation/action plans to follow through on equity-related strategic goals include
- Assign responsibilities to certain departments, individuals, etc.;
- Determine implementation and progress by airport department; and
- Rethink internal processes to support strategic equity goals (budgeting, performance reviews, business diversity/contracting, etc.).
- Assessment techniques for monitoring outcomes and measuring progress include
- Surveying the public (development projects) or airport workforce (DEI initiatives) about qualitative metrics such as changed perceptions, changed outcomes, the effectiveness of programs, or engagement activities;
- Considering pilot projects to measure impact and obtain feedback before scaling programs organization-wide;
- Setting SMART (specific, measurable, attainable, relevant, time-based) goals based on a strategic plan and values; and
- Utilizing an Excel-based airport diversity contracting benefit-cost tool to assess these programs (Krop et al. 2020).
Airports should communicate their goals, initiatives, and progress in plain English and nontechnical terms or jargon so that external stakeholders can easily understand. When communicating with stakeholders from which the airport had requested input, it is best practice to report back to the participants on how their input influenced decision-making. Airports may also choose to recognize individual contributions through incentives or internal awards for leadership in equity and inclusion. Communication tools for enabling both internal and external stakeholder involvement include
- Dashboards,
- Reports,
- Newsletters,
- Town-hall meetings,
- Listening sessions,
- Focus groups,
- Surveys, and
- One-on-one meetings.
3.4.4 What Are Some Limitations to Embedding and Institutionalizing Equity at Airports?
Organizational change and strategic planning that prioritizes equity takes time, resources, and champions. Budget can be a limiting factor to carrying out the programming necessary to build capacity for this work. Budget is also needed to support staff positions devoted to equity work. Refer to Section 3.2.4.2, which identifies additional limitations related to institutional capacity.
To integrate equity into airport work, staff must have the knowledge and willingness to champion and execute it. This includes building employees’ knowledge of equity outcomes and historical inequities relevant to the airport and the communities that it interacts with so that this context can influence outcomes of the employees’ work at the airport. The airport may provide training and capacity-building sessions to share knowledge with staff and provide tools relevant to their work. Leadership should conduct consistent communications and support frequent engagement with staff and other stakeholders to reinforce the organization’s commitment to equity work and their specific roles in contributing to meeting those goals (PolicyLink 2021). When broadly applying a set of values, some staff may be resistant or unprepared to accept the truth of racial inequity, so socializing the history and concepts may help provide context for these individuals.
3.4.5 What Are Common Pitfalls or Challenges Airports May Experience When Working Toward Embedding and Institutionalizing Equity Within Their Organization?
As more investment and resources are dedicated to this work, governing bodies may pressure leaders to share evidence of immediate or measurable changed outcomes or benefits. Airport organizations need to be mindful that this work takes time, energy, understanding, listening, and learning to create change. These topics are deeply personal and rely on building trust and understanding among individuals to drive organizational change. President Biden recognized that “advancing equity is not a one-year project. It’s a generational commitment” (The White House 2023).
Other challenges may arise from external sources. For example, the current sense of urgency regarding racial equity could shift as social and political climates shift over time. Political conditions can influence resources, funding, and the willingness to support equity work. Airports are also subject to larger macroeconomic conditions that could influence the organizations’ work and resources, such as the COVID-19 pandemic, which drastically impacted airports and their access to capital. Embedding equity into guiding policies and principles safeguards the organization against changing sentiments and shifts in resource availability.


