Incorporating Resilience into Transportation Networks (2024)
Chapter: 4 Identify Critical Hard and Soft Assets

PLAY 4
Identify Critical Hard and Soft Assets
Beyond defining network vulnerabilities as described in Play 3, a resilience team can benefit from recognizing qualitative differences in the assets that come into play during a network disruption. By identifying hard and soft assets, a network resilience team can address needs that may be difficult for private sector partners to absorb or replace when disruptions occur.
There are two different ways of understanding hard and soft assets when planning for resilience. In supply-chain planning terms, hard assets are inputs of production that occur early in the supply chain at locations that are difficult to relocate or substitute during a disruption, whereas soft assets are more fungible resources that can be relocated across multiple locations in response to a disruption.27 In business planning terms, hard assets are tangible, physical assets that can be owned, moved, and positioned, whereas soft assets include things like capabilities, organizational culture, knowledge and awareness of a network’s inner workings, and other factors that may be less tangible or locationally specific.28
A resilience team can assess hard and soft assets in business-planning terms within the context of the initial scoping of an effort detailed in Play 1. Play 4 offers suggestions for defining and mapping hard and soft assets in supply-chain terms. This type of assessment involves pinpointing resilience clusters using mapping and modeling techniques and evaluating the network criticality of assets accounting for cascading effects and overall network robustness.
Figure 29 further demonstrates an understanding of hard- and soft-asset characteristics in both business-planning and supply-chain terms.
Assess Criticality from a Value-Chain Perspective
The supply-chain concept of hard and soft assets can provide an opportunity to channel resources into transportation infrastructure and programs that are (1) most likely to be used during a disruption and (2) can best leverage the supply-chain demand-management techniques available to private sector shippers and carriers. For example, if it is understood that food and fuel can be distributed through a wide range of channels and outlets (soft assets) in a specific geographic area, but crop fields, wells, and refineries are severely limited in terms of possible locations, modes, and access points, resilience planning can reasonably be focused on enhancing access to the most vulnerable and least-resilient hard-asset locations.
Figure 30 builds on the description of hard and soft assets in supply-chain terms, to further describe how a team can identify and differentiate these resources in a resilience strategy.
Existing diagnostic resources in the resilience toolkit (published in NCHRP Web-Only Document 391, Volume 2, Section 1) tend to view asset criticality in terms of (1) the proximity of the
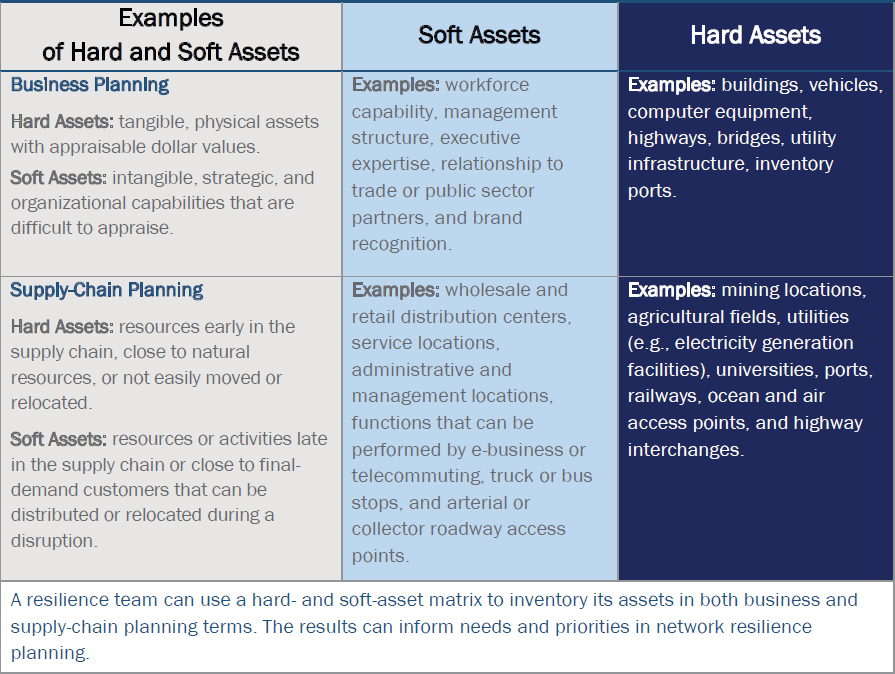

Figure 30. Hard and soft assets in value-chain terms.
asset to essential locations, (2) the volume of asset utilization, or (3) the availability or user cost of alternative routes and modes when the asset is compromised. However, Figures 31 and 32 demonstrate that, when considering the transportation network as a whole, a vital aspect of criticality is the supply-chain role of transportation infrastructure and services in relation to hard- and soft-asset proximity. Considering hard and soft asset locations in relation to the supply chain (the physical movement of goods from raw materials to production) also serves as a starting point for addressing resilience needs of the wider value chain.
Understanding the Relationship Between the Value Chain and Supply Chain
While the supply chain concerns itself explicitly with goods movement, the broader value chain can be understood in terms of access to all the means of production that firms must engage to produce value in a good or render a service. For example, a supply-chain view of resilience would be interested in the movement of metallic ore from a mine (a hard asset) to a metal manufacturing site (a less hard but not completely soft asset) where metal is made into products and then moved to a wholesale location or warehouse (a somewhat soft asset) and finally to a retail establishment (a very soft asset) for purchase. In value-chain terms, those relationships are complemented by mine workers and equipment that extract the ore, freight carriers who move the ore to the manufacturing site, factory workers who make the product, transit services that enable those workers to perform, technologies that manage the movement of those goods and people, and other considerations.
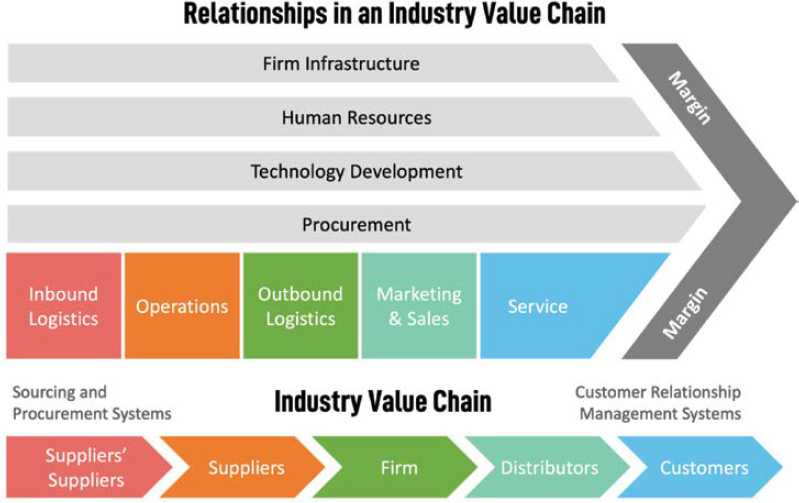
A firm may define its value chain in terms of primary and support activities in which primary business activities occur in a sequence (from the hard to the soft end of the chain), and support activities must be present throughout the sequence to enable efficient and profitable commerce. Figure 31 illustrates the typical structure of a private firm’s value chain. The figure shows not only the relationship between the sequence of steps (and locations) needed to create value and the supporting service requirements but also how the primary sequence of activities in the chain is likely to be common among firms in an industry (reflecting the industry value chain at the bottom of the figure).
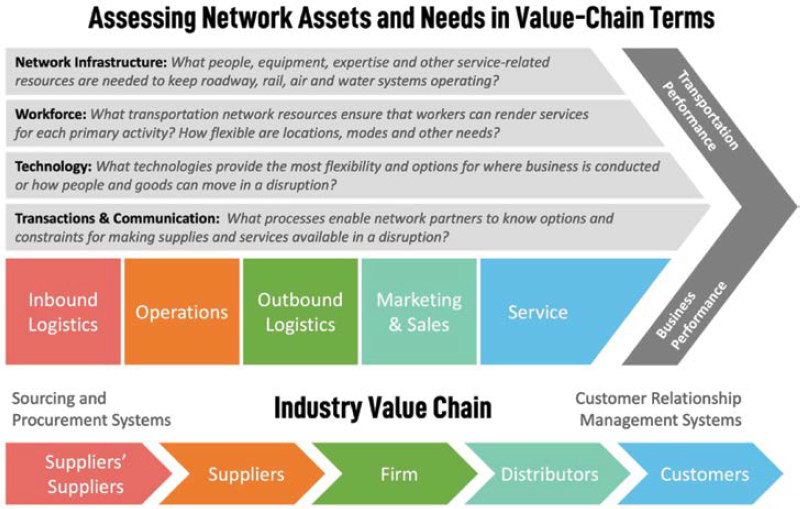
A network resilience team can apply value-chain principles to an entire network when exploring resilience needs for connecting hard and soft assets and considering factors such as workforce, technology, managerial competencies, and other resources. By expanding the consideration of assets from the physical supply chain to the wider value chain, a resilience team can pinpoint additional vulnerabilities and improvement opportunities for a network-level strategy. Figure 32 offers a simple exercise and graphical representation that a resilience team can use to explore wider value-chain relationships and their implications in a resilience strategy.
The results of a network value-chain exercise of the type shown in Figure 32 can help a resilience team organize resilience needs that are identified through diagnostic assessments of the type given in the resilience toolkit (NCHRP Web-Only Document 391, Volume 2, Section 1) and Play 3. Considering resilience at the value-chain level also introduces critical dimensions of commuting access and workforce needs in a resilience strategy. The following case study demonstrates how a cascading-effects methodology can compare potentially vulnerable assets, which may be identified using the diagnostic tools in NCHRP Web-Only Document 391, Volume 1, Section 1, and assess their wider implications in terms of value-chain access and participation.
Using similar techniques, a resilience team can identify concentrations of hard economic activity in value-chain terms to highlight critical areas of a region where activity occurs that cannot be readily shifted to different locations if a disruption should compromise access. The following analysis from the Illinois Department of Transportation uses an indexing method to show where concentrations of hard economic activity are located based on the North American Industry Classification System (NAICS). In this example a concentration of hard economic activity is understood as an area with a large number of jobs classified in the mining, quarrying, and oil and gas extraction; utilities; or agriculture, forestry, fishing, and hunting categories in contrast to areas with large numbers of jobs in soft employment categories such as retail, wholesale, finance, and insurance, educational services, or accommodation and food services. NCHRP Web-Only Document 391, Volume 2, provides further guidance on how to apply this method for evaluating the proximity of key transportation network resources to hard and soft value-chain assets.
Applying Cascading-Effects Models in Atlanta to Identify Workforce Implications of Disruptions
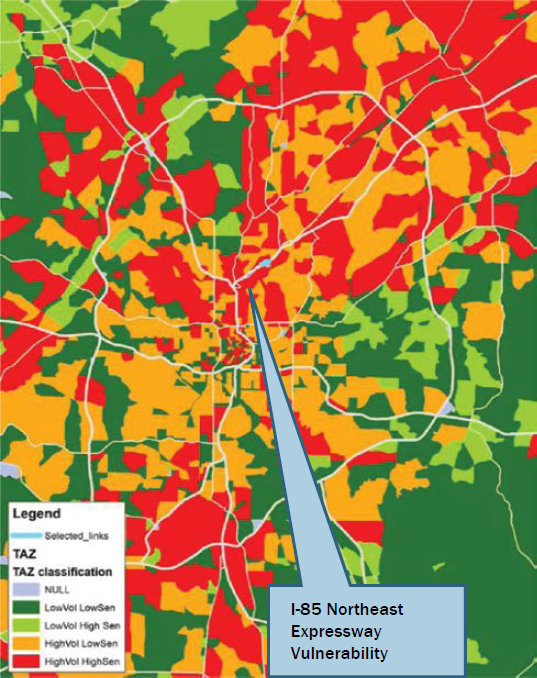
Combining transportation model networks with economic data about job and workforce locations can reveal the potential scope of workforce and service vulnerability associated with an at-risk asset. A regional cascading-effects analysis using the Atlanta Regional Commission’s (ARC’s) network model together with U.S. Census Longitudinal Employer-Household Dynamics (LEHD) data shows the geographic extent of potential commuting impact that would occur if a disruption compromised the Lindbergh Center MARTA transit station. The map shows in red and yellow where the highest concentration of job locations would be affected, with areas shown in green demonstrating how the potential scope of the disruption could affect workforce destinations in areas throughout the region far from the station itself.

The lower figure demonstrates both the geographic distribution and industry composition of potentially disrupted activities that may occur near a link of the I-85 Northeast Expressway and the associated Buford Spring Connector. In the lower map, the colors demonstrate the concentration of sensitive economic activity (defined as employment in sectors such as utilities, retail, and other services needed to sustain business and household operations) affected by a potential disruption of these facilities. The brighter shades of red on the map represent areas with high concentrations of affected workers in sensitive industries, with the lighter shades of green showing areas with lower concentrations and less sensitive types of employment affected. NCHRP Web-Only Document 391: Volume 2 offers guidance for completing this type of resilience analysis and further exploration of the implications of this analysis for the Atlanta region.
Pinpointing Hard Asset Clusters in Illinois to Support Supply-Chain Resilience
Statewide Hard Asset Clusters: Illinois has multiple areas with concentrations of employment in the hard supply-chain sectors of agriculture, forestry, fishing, hunting, mining, quarrying, gas extraction, and utilities. The areas shown in bright orange and red (on the hard supply-chain assets in the Illinois figure) are areas of concentrated activity that cannot be moved or relocated easily if transportation access is compromised.

The three hard-asset clusters shown in red include (1) the I-39/I-80 Cluster in the north-central part of the state, (2) the Springfield Cluster south of Springfield, Illinois, along I-55, and (3) the Southwest Cluster in southwestern Illinois across the Mississippi River from Saint Louis, Missouri. The I-39/I-80 Cluster holds a concentration of agricultural activity, with 46% of its hard industry employment in agriculture-related sectors, 28% in mining, and 26% in utilities. The cluster’s concentration of agriculture, mining, and utilities makes it particularly vulnerable to the loss of the CSX railroad, which runs parallel to I-80, and the Illinois railroad, which runs through the eastern portion of the cluster. Disruption of these facilities would pose a unique supply-chain challenge, as these activities cannot be readily moved or staged elsewhere. The Springfield Cluster is characterized by an agglomeration of utilities jobs, which accounts for 58% of its hard-sector employment. Another 40% of this cluster’s hard-sector employment is in agriculture served by I-55, I-70, and I-64, and the Union Pacific, Kansas City Southern, Norfolk Southern, and Canadian Railway lines. Ensuring rail and highway access to utilities and agricultural production in this sector is a supply-chain priority for similar reasons. Likewise, the Southwest Cluster has a balance of hard assets in mining and agriculture (with 47% and 46% of hard employment in these sectors, respectively) served by I-35 and I-80, as well as two CSX lines, the Norfolk Southern, Canadian Railway, Union Pacific, and Evansville Western railways. Freight cluster studies assessing the security and redundancy of these rail and highway facilities to specific hard-sector establishments can help transportation agencies in Illinois introduce a supply-chain focus to their freight planning.
Urban-Rural Considerations in Hard- and Soft-Asset Allocation: Analysis of hard asset resilience can be a particular focus in statewide planning. The Chicago region has fewer concentrations of hard assets than other areas of the state. Population density makes the urban area more of a center for distribution, retail, and final-demand activities, all of which can be provisioned more flexibly during a disruption. However, the agility of soft assets in Chicago may be compromised if the facilities critical to the hard-asset clusters around the state are compromised. The following extrusion diagram illustrates that the hard and soft concentration of supply-chain activity should also be understood as an extension of the overall amount of activity (shown in the extrusion height).


Evaluate Assets from a Social Equity Perspective
Assets in the resilience ecosystem go beyond those owned by public agencies and private firms. These include workforce skills, community knowledge, social capital, and other capabilities that reside in families, households, neighborhoods, tribal organizations/reservations, and other groups. Equitable and inclusive resilience plans include these assets when considering resilience needs and solutions. Practical advantages of including intangible community assets in a network resilience inventory include (1) fully supporting and using community-based resources that can be important in disruptions, (2) ensuring that efforts to support agency or institutional assets do not inadvertently undermine community support systems, and (3) ensuring that all of the intended beneficiaries of resilience planning are served by resulting solution sets.
Asset Mapping is a community-based process for identifying and strengthening the resilience of communities. It focuses on the skills and knowledge within the community. DePaul University offers an example of this technique and an asset mapping toolkit that can be helpful in resilience planning.29
Features and steps include the following:
Use conversation cards to build up a community conversation about resilience. The cards can be presented progressively with a group of stakeholders from initial icebreakers to discussion questions about community resilience resources, and then to discussion questions about how stakeholders use these resources. The objective of making and using this technique is to pinpoint

assets in a group setting that enables noninstitutional stakeholders to strategize about how communities and organizations can mobilize their available resilience assets.
Create an asset map in physical or digital form at the outset of the process to enable nontraditional stakeholders to visualize their community and trigger specific discussions about the nature and location of assets coming into play when addressing disruptions and responses.
Collaboratively define terms in a group setting with community stakeholders to (1) allow the community to define specific assets that may not be on the radar of agencies or major business organizations addressing disruptions, (2) acquire a working knowledge of what these assets contribute to network resilience, and (3) articulate the specific requirements needed to sustain or support these assets from transportation agencies or businesses.
Develop a resource list enumerating the specific community-based resilience assets, their location, requirements, and likely contributions to network performance in preparing for, responding to, and recovering from disruptive events.
Completion of a community-based asset mapping process with the above features can create a readily applicable set of intangible community assets that complement the “hard” and “soft” assets described in other aspects of this play. Figure 33 suggests high-level questions for a resilience team to consider when applying this technique.
Pinpoint and Enhance Resilience Clusters
The diagnostic assessments described in the matrix in NCHRP Web-Only Document 391, Volume 2, Section 1, can create a robust universe of potential locations and infrastructure or service improvements as subjects for a resilience program. For example, the popular FHWA
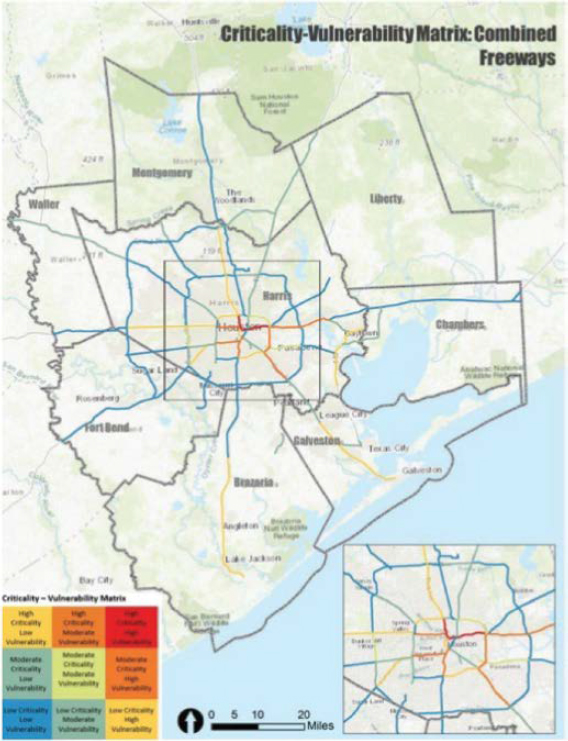
Vulnerability Assessment Scoring Tool (VAST) described in Section 1 can provide a host of critical locations for inclusion in a resilience program based on an array of criticality factors. Figure 34 is taken from the Houston-Galveston region’s Resilience and Durability to Extreme Weather in the H-GAC Region Pilot Program Report.30 The example shows how available diagnostic tools can yield a set of roadway links for consideration in a resilience program and create a robust universe of potential locations and infrastructure or service improvements as subjects for a resilience program.
An analysis of the type shown in Figure 34 can suggest clusters or areas within a state or region that face unique and critical vulnerabilities when compared to the network as a whole. (In Figure 34, the shades represent different levels of criticality and vulnerability under the VAST methodology.) Because vulnerability risk factors are often co-located due to natural geographic factors such as flood plains, proximity to water or forests, infrastructure conditions, or other factors, a scanning diagnosis may reveal clusters of infrastructure assets that lend themselves to network analysis for cascading effects on potential network solutions. For example, the analysis shown in Figure 34 can be readily complemented by the cascading-effects techniques shown in the previous Atlanta case (detailed in NCHRP Web-Only Document 391, Volume 2, Section 3) to integrate an asset-based or infrastructure-based identification of vulnerabilities with a network-based or economically based understanding of workforce and value-chain implications of a potential disruption. The cascading-effects analysis in Flagstaff Arizona offers a practical example of identifying and analyzing a cluster of assets for a resilience assessment. The steps for replicating this methodology and further discussion of the interpretation of this analysis in the Flagstaff context can be found in NCHRP Web-Only Document 391, Volume 2, Section 4.
Identifying and Analyzing the Ponderosa Parkway Resilience Cluster in Flagstaff, Arizona
Wildfires in the summer of 2022 placed resilience planning on the agenda at the Flagstaff Metropolitan Planning Organization (MetroPlan) in a significant way. A scan of the region’s highway network for facilities with significant truck volumes and overall use among functional systems revealed a cluster of high-impact facilities surrounding Historic Route 66, Ponderosa Parkway, and Interstate 40. Mapping a combination of infrastructure and economic assets surrounding the facilities in this cluster (shown in the figure on the left) demonstrates the role of these facilities in providing access to airports, fire stations, parks, hospitals, and retail outlets. The cluster of vulnerable facilities includes freeway, arterial, and collector facilities, all of which play a vital role in access to the surrounding area.
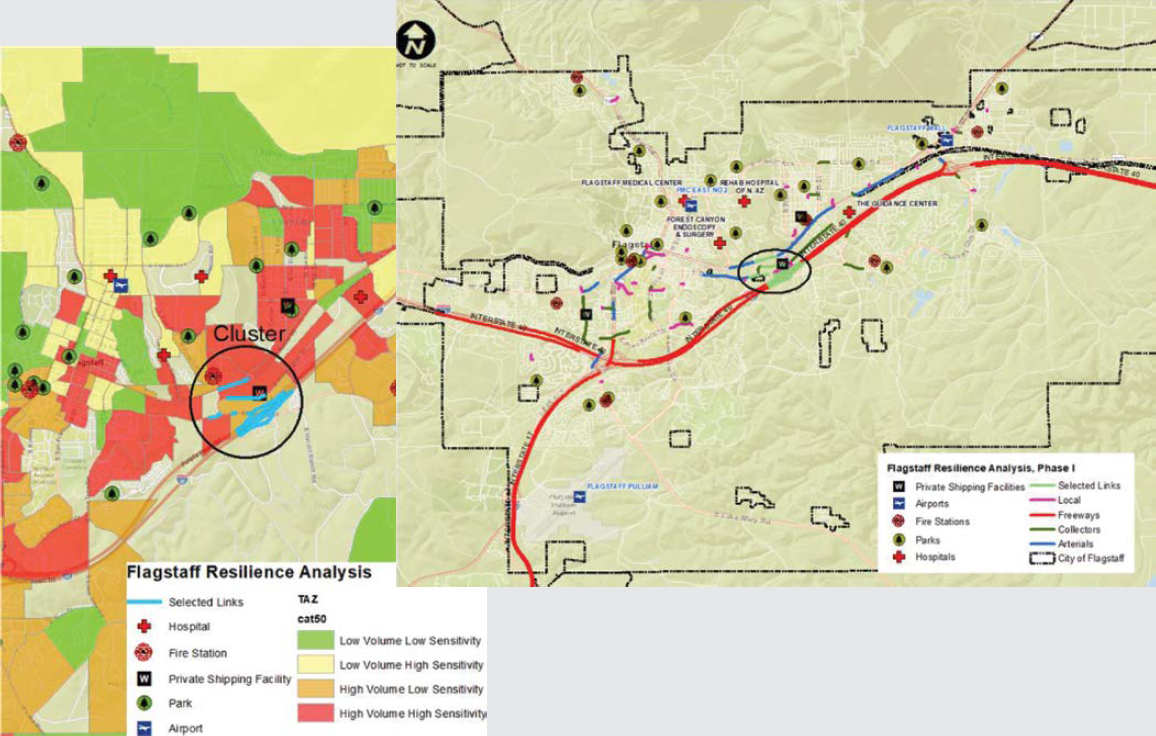
By applying the cascading-effects methodology (as illustrated in the earlier case on commuting in Atlanta), MetroPlan can demonstrate both (1) the proximity of this vulnerable infrastructure cluster to other transportation assets in Flagstaff and (2) the wider geographic reach of a potential disruption of the cluster on commuting and workforce markets throughout the region.
The cascading-effects analysis reveals that areas in orange and red have concentrations of workforce activity in sensitive sectors for disruption recovery such as retail, utilities, and government services, some of which also house hospitals, fire stations, and other resources. The Flagstaff analysis demonstrates how integrating vulnerability assessments to identify a cluster with a cascading-effects analysis to map out the extent and nature of the cluster’s economic vulnerability and the proximity of known public sector assets can provide a clear vision of where and how a disruption could affect regional markets. A resilience team may build on this type of analysis to consider different options for serving the highly affected areas (shown in orange and red) and securing assets to the other local resources (shown in the legend).
Consider Intermodal Freight Assets and Markets
Airports, sea or riverports, railyards, and commercial trucking hubs are unique assets that play a special role in the economy. When they are disrupted, the potential cascading effects can extend throughout a state and the nation. To both understand and compare the vulnerability associated with compromise to an intermodal asset, a similar cascading-effects model to those illustrated for regional issues in Atlanta and Flagstaff can be applied as shown in NCHRP Web-Only Document 391, Volume 2, Section 6. The example below utilizing the Illinois DOT statewide traffic model together with private sector (TRANSEARCH) and public sector (Freight Analysis Framework or FAF) data demonstrates how a network resilience team can both identify and compare the critical DOT-supported access routes as well as the economic and trade significance of vulnerabilities to major intermodal freight facilities.
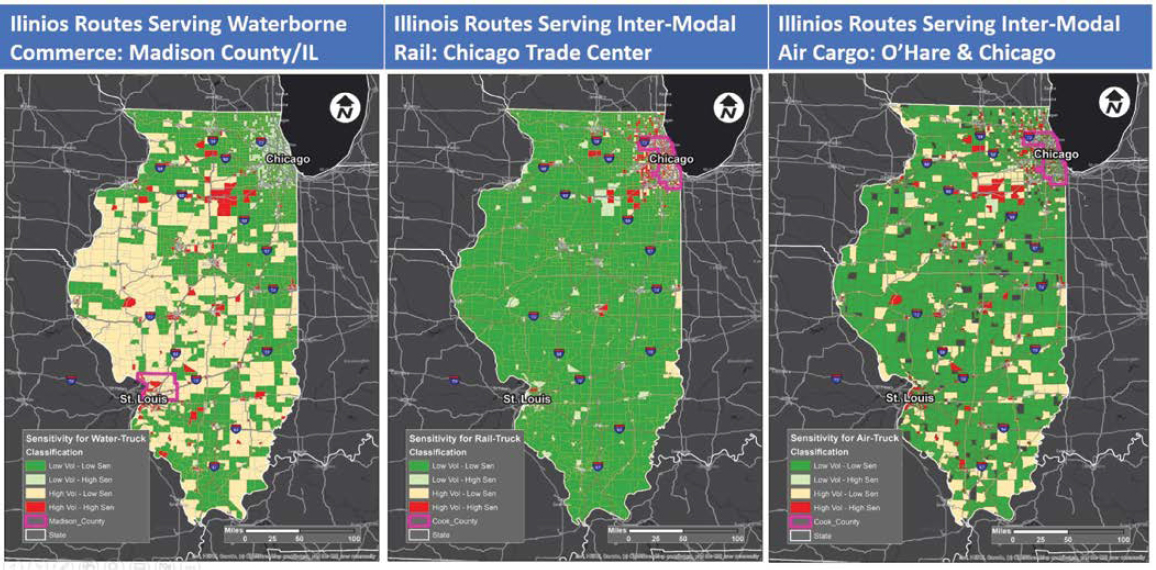
Applying Cascading Effects To Assess Intermodal Freight Disruption Risks in Illinois
Illinois’ highway system plays a vital role in supporting intermodal freight through the United States. Chicago’s air cargo market (centered at O’Hare and Midway airports), the Madison County waterborne commerce market (served by riverports in the region of Saint Louis, Missouri), and Chicago’s intermodal railyards are critical assets for state and national freight. By identifying inbound and outbound volumes traded on their respective modes at each of these locations and tracking the truck distribution of those commodities through Illinois, it is possible to identify key highway routes needed to support each of these intermodal facilities. The first map set demonstrates the routes most critical for supporting intermodal commerce for three key intermodal facilities in Illinois. Mapping of this type can enable a resilience team to assess which highway facilities have the greatest significance with respect to each of these three freight modes in the state.
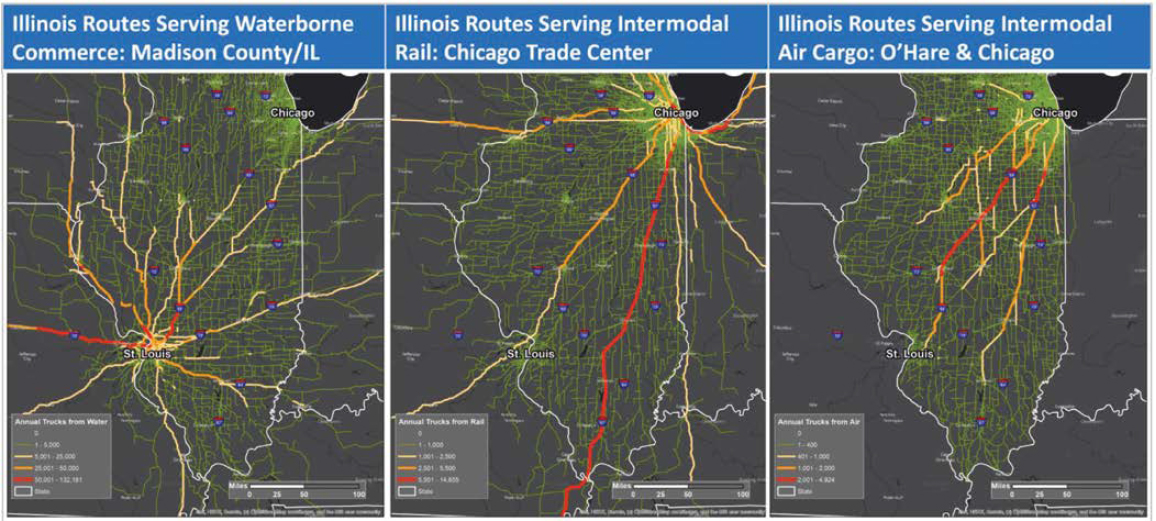
The second map set geographically illustrates the greatest concentrations of economic activity in sectors for which the Illinois economy is anticipated to be the most sensitive when it comes to recovering from disruptions (utilities, retail, government services, and others). NCHRP Web-Only Document 391, Volume 2, Section 6, details the methodology for performing this type of analysis and further explores its interpretation in the Illinois freight planning environment.
Consider Assets Supportive of Overall Network Recovery
While the suite of diagnostic tools in NCHRP Web-Only Document 391, Volume 2, provides significant options for developing resilience projects and hard- and soft-asset classifications together with cascading-effects techniques can provide meaningful options for viewing criticality in network terms, overall network robustness is also a lens from which to identify assets for inclusion in a resilience program. All the approaches presented in the other plays have involved scanning the network for vulnerable assets and assessing the potential extent and significance of the vulnerability for planning purposes. However, using big data and computing, it is possible to perform a whole-network analysis to identify which links or nodes in a network play the most significant role in (1) preventing collapse of the overall network performance and (2) supporting the network’s ability to recover if there is a collapse in performance. These network-robustness modeling techniques are fully documented in NCHRP Web-Only Document 391, Volume 2, Section 7, with practical examples of their application. The following case study demonstrates how a network-wide analysis of failure risk and recovery potential can lead a resilience team to high-impact candidates for a resilience improvement program.
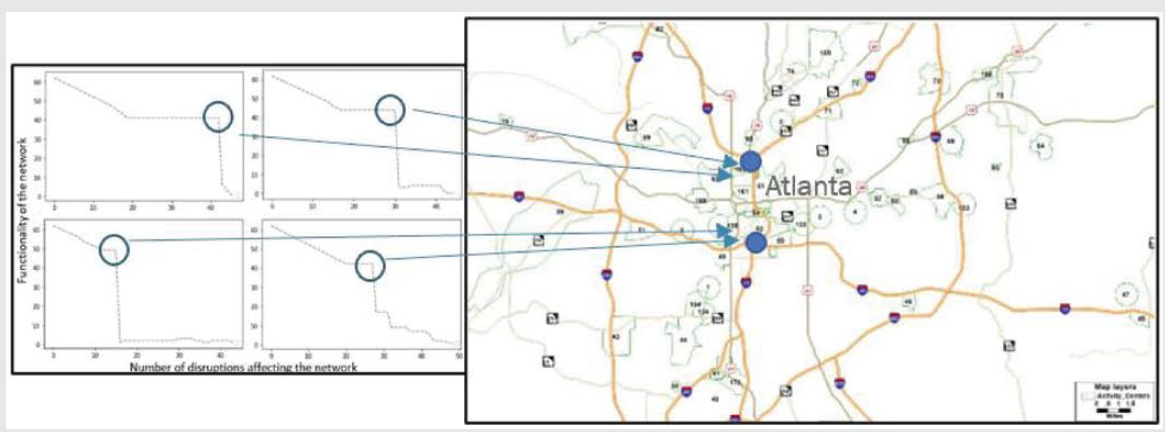
Applying Holistic Network-Robustness Techniques to Identify Critical Assets in Atlanta
An analysis of the Atlanta Regional Commission’s (ARC’s) highway network illustrates the use of the network robustness methodology to identify critical assets. A robustness model is a technique that successively analyzes the entire network through the removal of one link or node at a time to assess how many assets could be removed before the network’s overall mobility capability collapses. The methodology shows that there is generally a tipping point, representing the greatest loss of connections the network can withstand. The more links and nodes a network can lose before an overall collapse in mobility is an indicator of how resilient the network is. The figures on the left of the illustration demonstrate on the y-axis how many disruptions the network can withstand if it were to lose any of the four links or nodes shown on the map to the right. The map to the right shows Atlanta’s livable centers and the transportation facilities by which they are connected.
The analysis shows that, when consecutive disruptions affect the transportation network in Atlanta, it is possible to identify two key critical areas in the network with the greatest impact on the network’s overall ability to function in the face of disruptions. These facilities (shown in blue circles) are the juncture of I-85 and I-75 in the northern part of the network, and I-85 and I-20 in the southern area of the network. As shown in the right-hand figures, a compromise of these connections produces a dramatic decline in performance of the entire network. A resilience team can use this finding to (1) prioritize these locations in mitigating and recovering from network-level events (such as snow, fire, or tornadoes) and (2) identify substitute connections to make the overall network less vulnerable to compromise of this small group of facilities. NCHRP Web-Only Document 391, Volume 2, Section 7, provides step-by-step guidance for applying this methodology to any transportation network and details on its interpretation within the context of the Atlanta region’s resilience planning.