Incorporating Resilience into Transportation Networks (2024)
Chapter: 1 Define the Transportation Resilience Ecosystem

PLAY 1
Define the Transportation Resilience Ecosystem
What does it mean for a transportation network to be resilient? Where in the network can resilience improvements and benefits be demonstrated? What role do transportation agency decision-makers have in achieving network resilience? Answering these questions requires (1) defining the components of network-level resilience; (2) assessing needs, roles, and opportunities in the network resilience ecosystem; and (3) articulating a business case for partners to collaborate in network resilience planning.
Take Inventory of the Resilience Ecosystem
The resilience ecosystem diagram (Figure 2) depicts how resilience planning at the network level goes beyond simply assessing the vulnerability of individual facilities or services to consider cascading effects between transportation assets, institutions, and individuals. Cascading effects are a chain of disruptions from one system dimension that creates further troubles downstream. For example, when a bridge is disrupted, there is an immediate impact on the performance of the
highway network as traffic backs up and the level of service deteriorates. This may then lead to a cascading effect on the transit system if drivers cannot get to work or buses are trapped in the congestion. Other cascading effects can occur at hospitals, food stores, energy plants, and other destinations that depend on the bridge and compromised transit systems for trips and shipments.
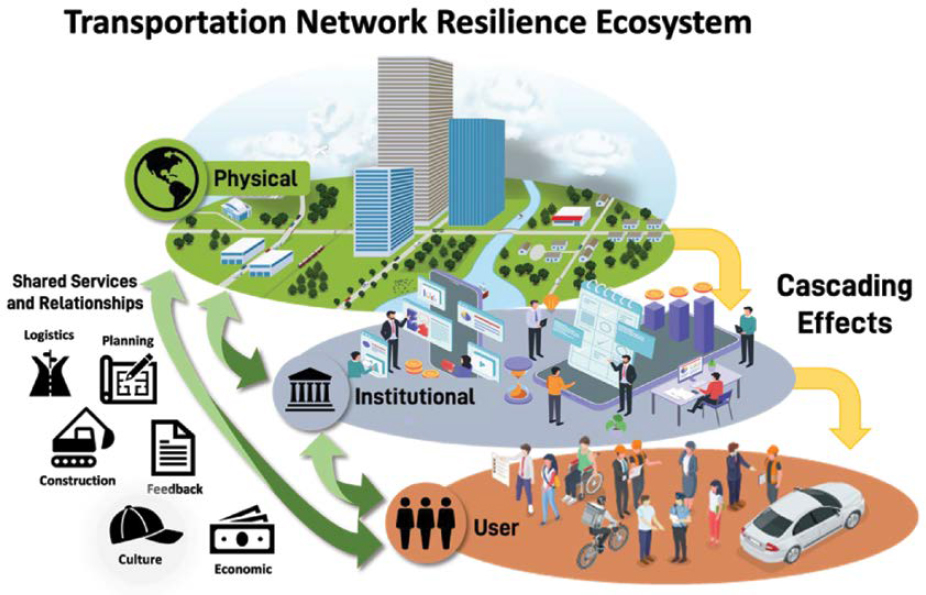
Cascading effects are an aspect of network disruptions that require the resilience planner to go beyond simply assessing physical vulnerabilities of infrastructure to address the network as a system. To plan for disruptions with cascading effects, it is necessary to inventory the physical assets, institutions (including government agencies, businesses, civic or community institutions, and other formal groups) as well as individual workers, citizens, and professionals with roles in the network.
Figure 3 provides examples of different entities to be considered when taking inventory of the resilience ecosystem, with a simple worksheet for defining the assets, institutions, and individual roles to be included in a network resilience strategy.

Define and Assess the Components of Resilience
Components of resilience for a network may be different from the components of resilience for an individual asset. Because of the cascading effects described in the previous section, the factors that make for a resilient bridge, port, or pipeline might not ensure a resilient network. Even if every network component is highly resilient, the network itself might not be resilient if solutions are not in place to ensure that the network’s assets and partners can prevent, mitigate, and recover from disruptions in a resilient fashion. While each resilience-planning effort may define its core components differently, the supply chain and transportation-planning fields have identified core components of resilience that are uniquely addressed at the network level.3 These include the following:
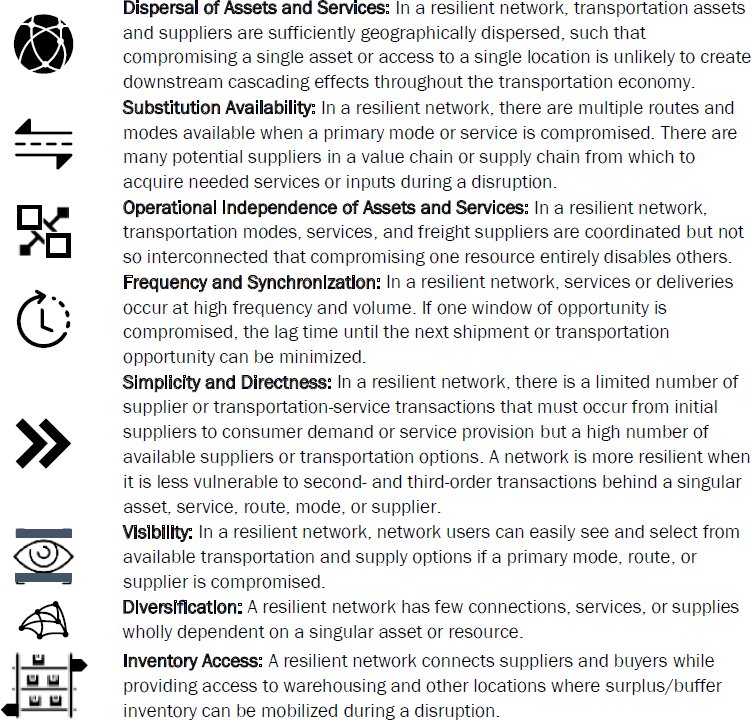
These components can help planners consider networks from a supply-chain perspective and identify network-level resilience needs, opportunities, and resources.
Scoping a Resilience Program: Performing a Network SWOT Assessment
Planners can use the components given in Figure 4 to consider resilience from a network and supply-chain perspective, looking beyond the infrastructure assets to the markets served and the roles assets play in a demand network. Because many of these considerations are new to public agency planners, it is helpful to consult with business and industry stakeholders to work through practical questions in performing a network resilience strengths, weaknesses, opportunities, and threats (SWOT) self-assessment.
Figure 5 outlines a process for performing a network resilience self-assessment by segmenting network coverage areas into (1) 40-mile commuting radius areas and (2) 180-mile same-day truck delivery radius areas. The exercise can be completed using geographic information system (GIS) layers featuring train, bus, and highway routes; air, seaport, and rail-depot locations; and basic descriptors of speed, headways, and other performance information. The specific definition of commuting or delivery market areas in a state or MPO region can be determined through a collaborative process or by using existing designations such as trade centers, DOT regions, or livable centers as defined by an MPO or regional planning organization (RPO). (The assessment can be completed by agency staff or within the context of a collaborative resilience team of the type described in Play 2.) The self-assessment provides a helpful structure for identifying needs at the network level and integrating infrastructure performance with the factors required for resilient supply chains. The self-assessment is broken down into nine sections, each of which identifies components of resilience on which to focus strategies and commodities and geographic areas on which to focus network resilience initiatives.
Linking Network Resilience Components to Performance and Priorities
Planners can use the network/supply-chain assessment given in Figure 5 to complement the performance metrics and frameworks detailed in TRB Special Report 340: Investing in Transportation Resilience: A Framework for Informed Choices and the infrastructure resilience metrics developed by the National Oceanic and Atmospheric Administration (NOAA).4 Play 5: Invest in Resilience and Play 6: Play to Win: Build a Resilience Program and Learn from Experience explore how resilience components can be represented in transportation agencies’ investment and prioritization strategies.
Map Out the Resilience Ecosystem
A foundational step in planning for network resilience is using GIS to map the locations of resilience ecosystem elements. This process can begin with a simple base map showing the location of all the features described in Figure 6. This base map serves as a foundation for further analysis of cascading effects, economic impacts, resilience clusters, and other strategies described throughout the playbook. Figure 6 is an example of a resilience base map from a resilience plan in the Boston MPO (Central Transportation Planning Study).5
While the base maps shown in Figure 6 focus on transportation, emergency response, and natural environments, it is notable that major industry locations, intermodal centers, warehouses, and institutions such as schools and universities can play an important role in resilience. Completing the resilience ecosystem inventory shown in Figure 3, together with the SWOT self-assessment in Figure 5, can guide practitioners in framing the elements that are most appropriate for a resilience base map in any given network resilience effort.
Identify Beneficiaries of Improved Resilience
The practice of vulnerability mapping is an integral part of defining the resilience ecosystem.6 Vulnerability mapping entails locating where a confluence of risk factors puts a specific facility, asset, or community at risk.
For example, the national Vulnerability Mapping Analysis Platform (VMAP) housed in the College of Community Innovation and Education at the University of Central Florida is a resource for identifying and locating social and environmental vulnerabilities in communities
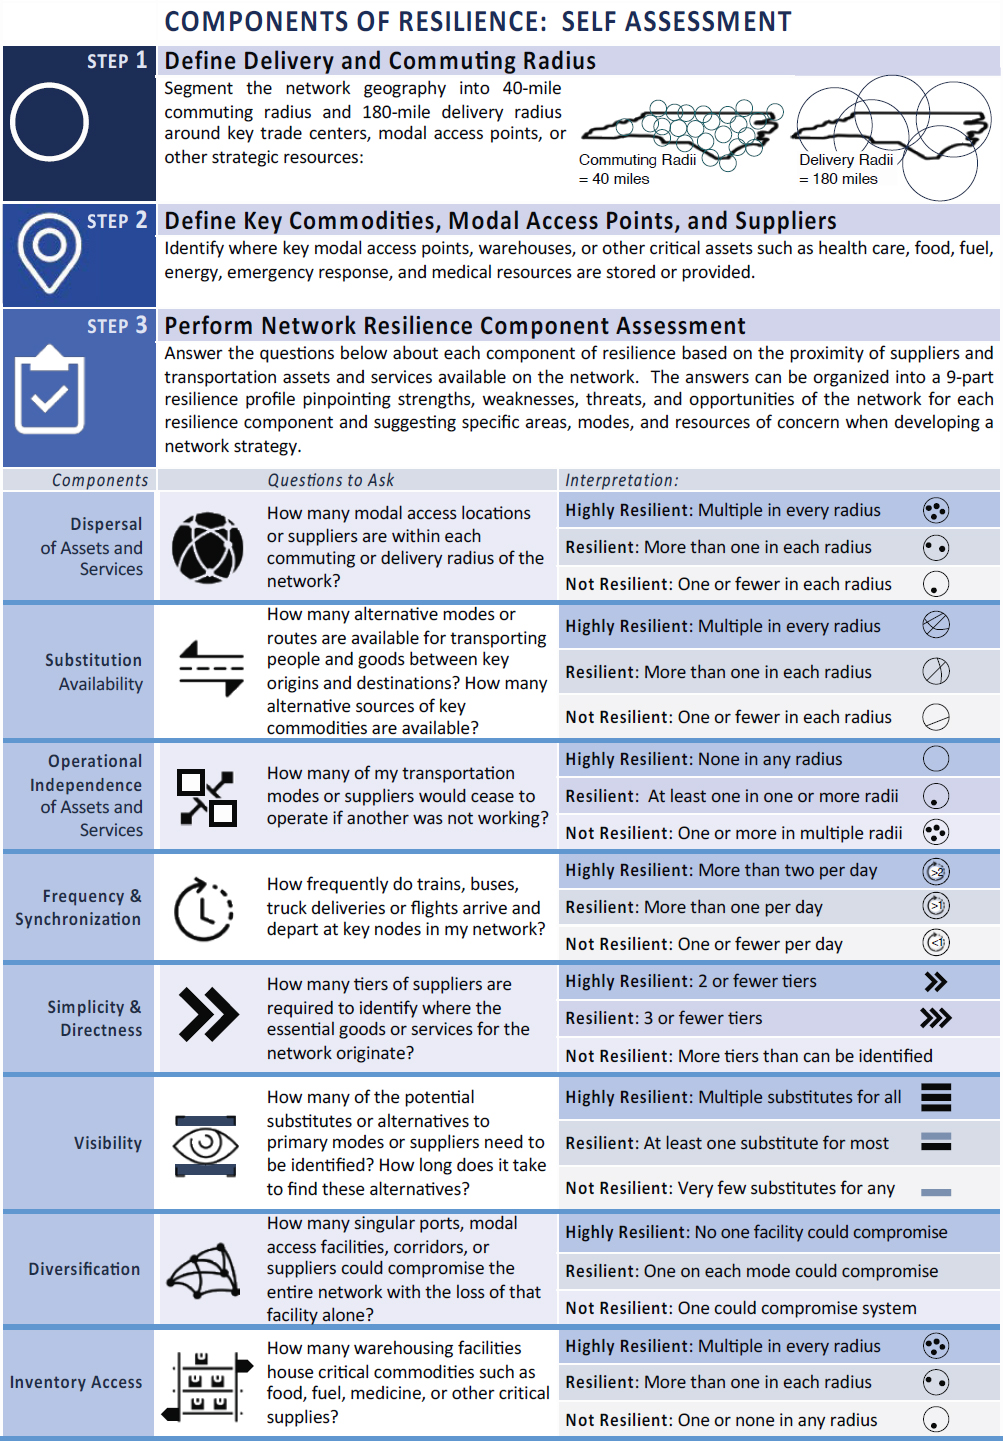
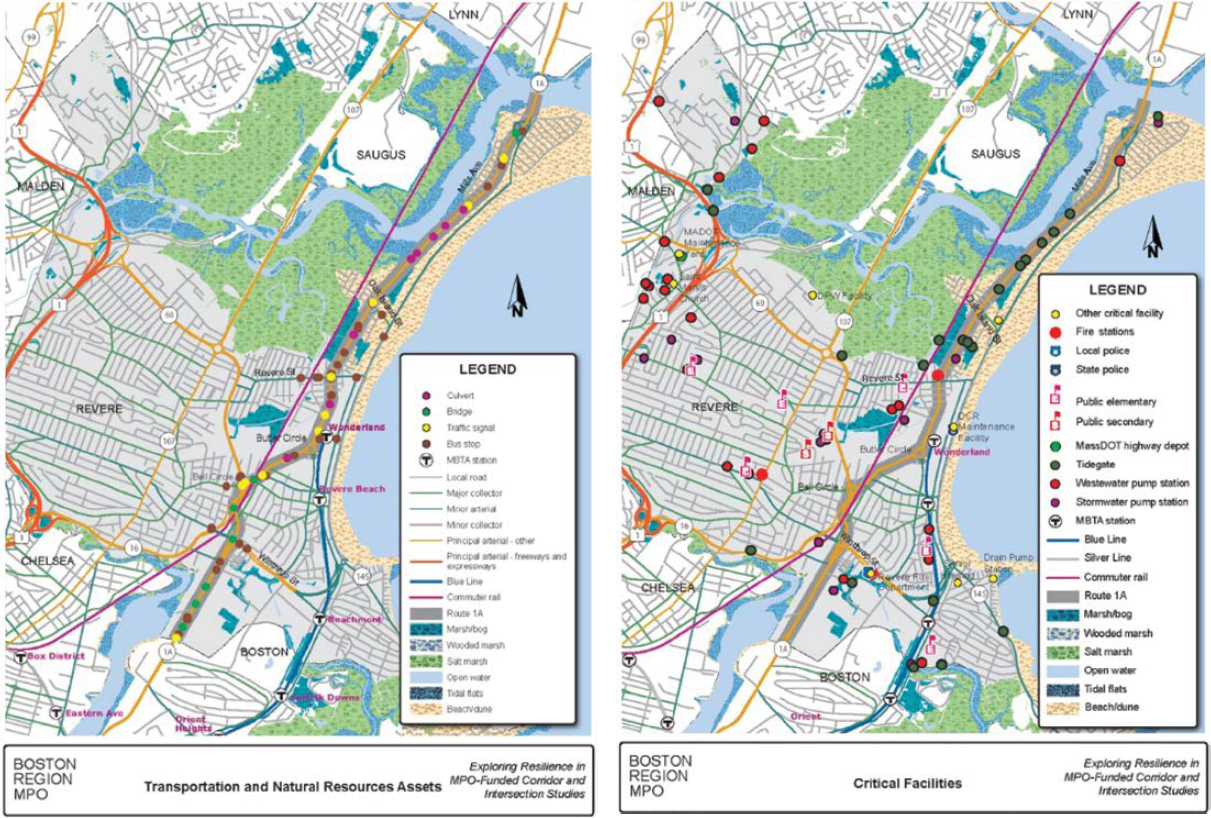
Figure 6. Resilience base maps.
across the United States.7Figure 7 shows the location of high-risk populations in Florida based on social vulnerability characteristics compiled as part of the VMAP platform, including demographic, health, and other factors.
Vulnerability maps typically identify resilience vulnerabilities based on the proximity of critical assets or populations to risk factors. However, when assessing the vulnerabilities of a transportation network, it is essential to recognize that cascading effects (see NCHRP Web-Only Document 391, Volume 1) often occur at locations served by a vulnerable asset far from the location of the exposure. Figure 8 demonstrates how mapping the cascading effects associated with a transportation network disruption entails (1) associating multimodal network characteristics with freight or passenger trip patterns; (2) pinpointing household, business, and buyer or supplier locations dependent on the vulnerable asset; (3) quantifying the volume and sensitivity of affected traffic by occupation, industry, or other characteristics; and (4) mapping the extent and intensity of potential disruptions to trade networks and economic systems.
Mapping the cascading effects of network disruptions or disruption scenarios is a powerful tool for assessing, comparing, and communicating the significance of vulnerabilities to potential disruptions in network terms. Methodologies for mapping cascading effects of disruptions to freight networks are described in NCHRP Web-Only Document 391, Volume 2, Section 1, while a method for mapping cascading effects of disruptions to commuting is described in Section 2.
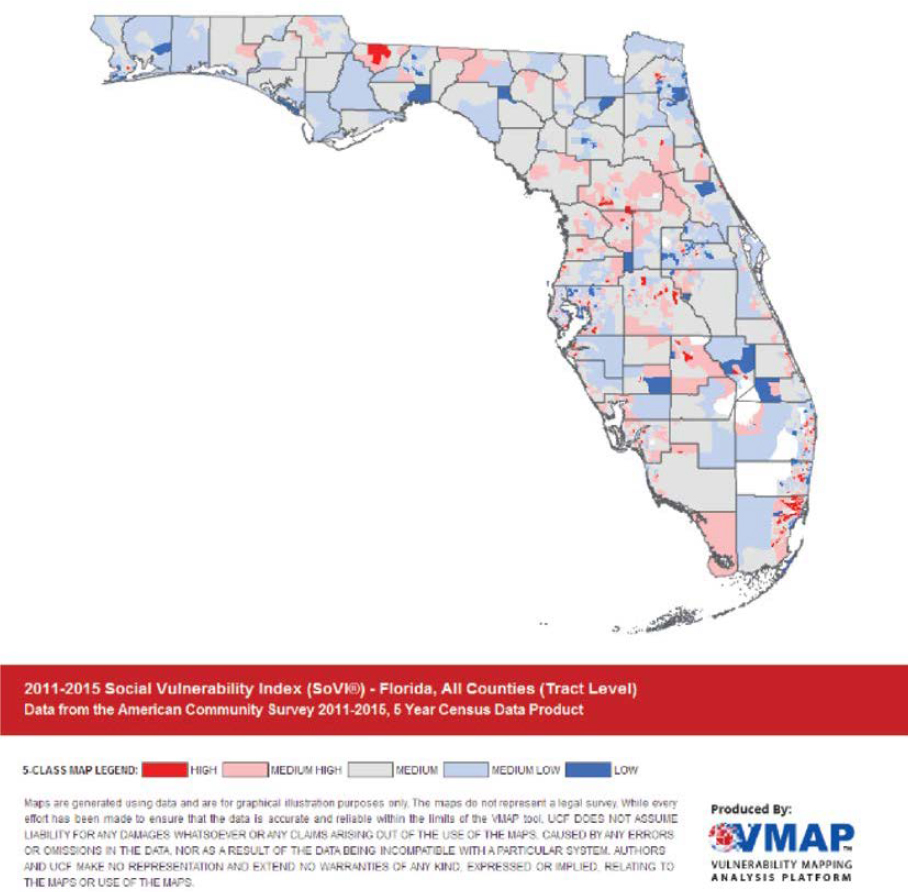
Figure 7. Social vulnerability map of Florida.

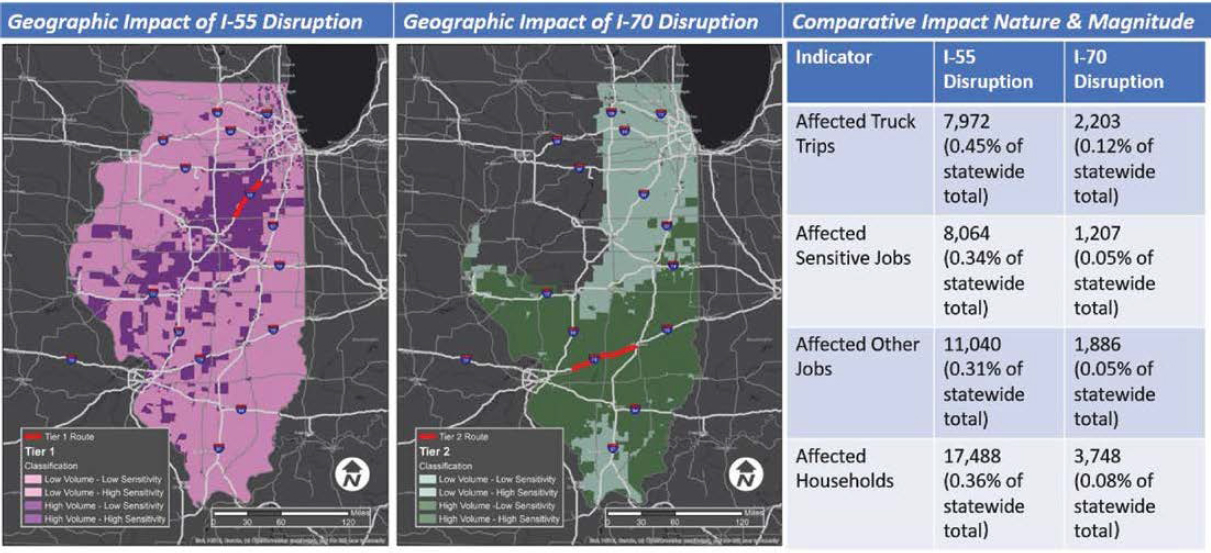
Figure 9 shows how a disruption to I-55 compares with a disruption to I-70 in southern Illinois regarding the effects on jobs and households. Subsequent plays further explore how the cascading effects revealed by this method can support social equity and economic impact considerations in network resilience planning and prioritization.
Cascading Effects, Economic Benefits, and Impacts of Network Resilience Planning
Mapping the locations, industries, and populations affected by cascading effects of disruption scenarios provides insights into network vulnerability and the benefits of improving network resilience. Modeling cascading effects enables planners to strategically apply cost-benefit analysis, economic impact analysis, and other techniques explored in NCFRP Research Report 39: Freight Transportation Resilience in Response to Supply Chain Disruptions (Meyer et al. 2019) and NCHRP Report 732: Methodologies to Estimate the Economic Impacts of Disruptions to the Goods Movement System (Georgia Tech Research Corporation et al. 2012).8 Applying network economic analysis from a cascading-effects perspective provides intelligence regarding how network relationships determine the location and extent of disruption costs as well as the benefits of resilience enhancements. Play 5 will further explore how cascading-effects mapping elucidates the network benefits of enhanced intermodal freight and resilience commuting and contributes to the prioritization of resilience investment strategies.


