Incorporating Resilience into Transportation Networks (2024)
Chapter: 5 Invest in Resilience

PLAY 5
Invest in Resilience
Investing in resilience poses unique challenges for public agencies. The resilience ecosystem (defined in Play 1) includes actors and resources beyond public agency control, and the benefits of resilience investments often are contingent on the strategies implemented by private firms and supply-chain partners. Additionally, because supply-chain technologies and management innovations are evolving rapidly, infrastructure projects aimed at supporting a supply-chain resilience strategy may become antiquated before the project is completed. Investment choices are further complicated by the fact that conventional cost-benefit analysis and economic impact methods [including those highlighted in NCHRP Report 732 (Georgia Tech Research Corporation et al. 2012)] either derive a cumulative, constant stream of monetary benefits over the life of a project or presume that economic impacts (in models such as IMPLAN, REMI, RIMS, and TREDIS) affect annual earnings, output, employment, and gross domestic product (GDP) for years into the future.31 This means resilience projects that only generate benefits during a disruption or a recovery period are difficult to justify in economic terms compared to bottleneck-removal or bridge-replacement projects that generate year-over-year benefits to all users of the facility.
While the diagnostic tools in NCHRP Web-Only Document 391, Volume 2, Section 1, can quantify some benefits of resilience outlays, the benefits are often predicated on the likelihood that a disruptive event will occur. As a result, available resilience tools fail to address trade-offs between resilience investments that will pay off only if and when disruptions occur in relation to other investments that will pay off consistently over time.
This play explores how an agency can develop a rationale for investing in resilience programs that address network stress factors (explored in Play 3). The play also describes how to use cascading effects in the business case for resilience and how an agency can arrive at a socially equitable resilience-investment strategy.
The Cost of Disruptions: Why Private Firms Invest in Supply-Chain Strategies
- Value: $182 million per company in 2022
- Frequency: 3 significant events in past 12 months
- Depth: 91% reported disruptions beyond Tier 1 suppliers
- Response: 64% plan to make major changes
Source: Interos, Inc. Annual Global Supply Chain Report 2003.
For more information see the video available at https://vimeo.com/showcase/10741790.
Inform Investments with Business and Supply-Chain Strategies
Public sector resilience-investment strategies are best understood as components of a larger economic and business response to transportation network disruptions. The needs of private sector business supply chains (and wider value chains) are a key driver of public investment in transportation resilience. The components of resilience (described in Play 1) serve as a starting point for developing an investment strategy that looks at transportation needs through the lens of business supply chains.
The growing emphasis on diverse supplier networks, available inventories, adaptable production and distribution sites, and cost management shape
the types of investments and payoffs that can be expected as part of a public sector resilience-investment strategy. Figure 35 offers an overview of findings from a 2022 survey by McKinsey & Company of corporate environmental, social, and governance initiatives that managers consider to have significant implications for how they manage supply chains.
Supply-chain considerations underlie the components of resilience assessment offered in Play 1 and may determine the use and benefit of public agency resilience by affecting factors such as (1) the location, density, and diversity of access points to transportation modes, (2) the availability of accessible land for production, warehousing, and distribution areas, (3) the capacity of ports, railyards, or transit facilities to sustain higher frequency of service, directional reversibility, or higher vessel or load size, (4) the capacity and design of highway and bridge infrastructure for more flexible size and weight restrictions, and (5) the redundancy of highway network links. These are all potential success factors for business supply-chain resilience strategies.
The self-assessments in Play 3 and Play 4 can provide agency resilience teams with a practical set of potential investments and concepts for how and where they can support supply-chain resilience. Furthermore, the Supply Chain Module of the Transportation Network Resilience Awareness Challenge (video available at https://vimeo.com/showcase/10741790) can serve as a starting point for agency staff to understand how public sector investment can provide a conducive environment for supply-chain resilience.
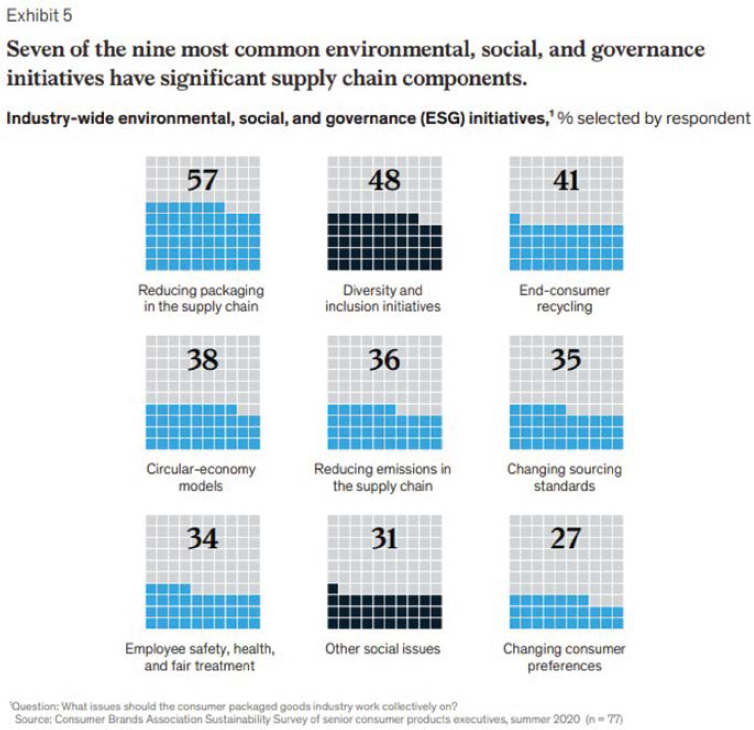
Reprinted by permission.
Figure 35. Private sector environmental, social, and governance initiatives understood to shape supply-chain management.
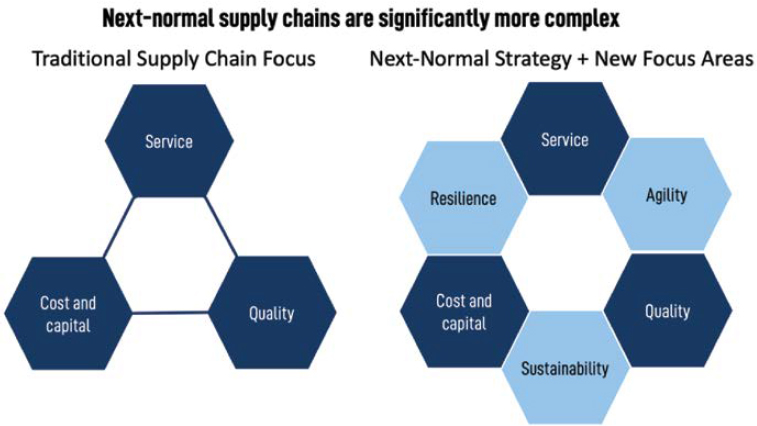
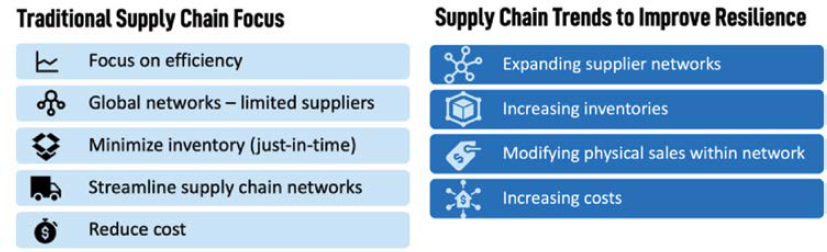
Figure 37. Shifts in supply chain focus areas affect the payoffs from transportation network investment.
Figure 36 illustrates how a wider range of drivers now motivates business investment choices in using a supply-chain network, leading to a different focus shown in Figure 37. The COVID-19 pandemic and its associated supply-chain aftershocks quickened trends that began years ago as firms adapted to advances in AI, machine learning, workforce initiatives with increased emphasis on equity and diversity, and a global policy environment emphasizing carbon-emissions reduction and sustainability.
Identify Comprehensive Network Solution Sets
Solutions to network resilience problems often involve investments from the full spectrum of transportation performance areas. These can include (1) new types of projects and technologies, (2) strategic application of existing infrastructure technologies, (3) educational and capacity-building opportunities to reduce vulnerability at the institutional or individual level, and (4) coordinating with shippers, carriers, and system users to manage demand or with corporate resources to support network performance during a disruption.
Private sector supply-chain strategies must adapt rapidly to different types of disruptions, so public sector resilience strategies can benefit from developing flexible solution sets that can be triggered
by complementary private sector actions or other factors. For example, an agency could have an investment strategy that indicates (1) it will open interchange access to a proposed new warehousing or manufacturing district when private investment in the property or local street access reaches a predetermined threshold or (2) it will invest in a new bridge, ferry, or backup service for accessing an island or peninsula once sea level rise or other climate-change indicators reach a certain threshold.
Solution Set: A set of strategies {a, b, c, d, … n1} for improving system performance.
Building Transportation Agency Solution Sets
Investing in resilience entails translating diagnostic evaluations of resilience needs and assets (as outlined in Play 3 and Play 4) into defensible solution sets. Transportation agencies compile resilience-oriented projects and countermeasures that can be priced, justified, and funded as the basis for public investment into solution sets.
Section 2 of NCHRP Web-Only Document 391, Volume 2, organizes solution sets according to the four network stress-factor groups described in Play 3 and the specific services they offer as a derivative of the toolkit matrix designed in Section 1 into a comprehensive table summarized in Figure 38. These categories provide a comprehensive overview of different scorecards and other metrics focused on quantitative reasoning, data visualization, and guidance principles based on literature. These examples provide context for the application of different tools and practices in the field of risk and resilience management.
Figure 38 shows how the application of different risk and resilience tools can provide unique and informative solution sets. See NCHRP Web-Only Document 391, Volume 2, Section 1, for more details about resilience tools and analytical methods and Section 2 for more details on resilience solution sets.
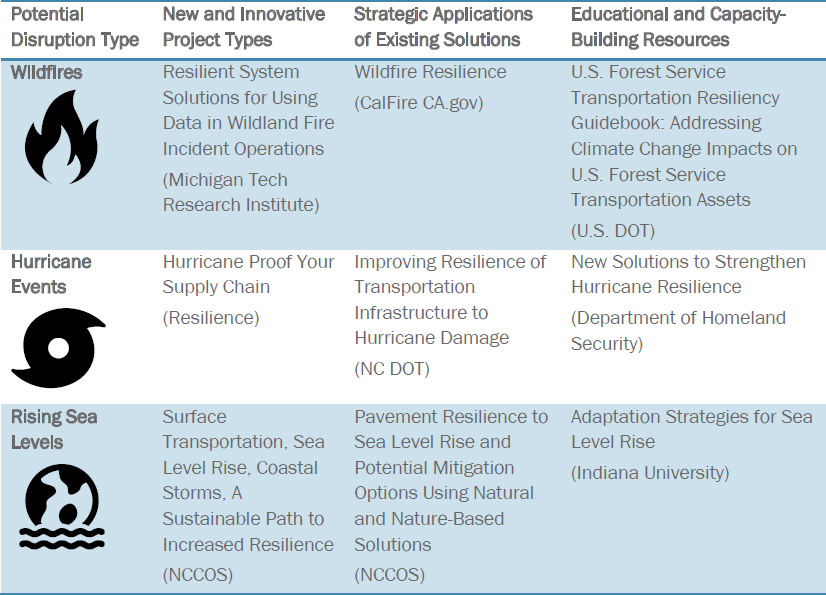
Figure 38. Solution sets for resilience investment.
Prioritize Resilience Investments
Translating resilience needs into an implementable investment program requires agencies to prioritize projects and identify funding. Agencies can prioritize resilience needs by weighing costs and benefits of resilience-enhancing projects against the universe of other projects as part of regular state transportation improvement programs (STIPs) or MPO transportation improvement programs (TIPs). Funding is available to DOTs and MPOs through special statewide programs, federal programs [such as Promoting Resilient Operations for Transformative, Efficient, and Cost-Saving Transportation Program (PROTECT) grants], or discretionary grants. Individual projects (or project sets) may also be ranked and prioritized from a dedicated pool of resilience funding.
Federal funding programs are increasing their focus on supply-chain concerns. The 2021 Bipartisan Infrastructure Law (BIL) mentions the term supply chain 46 times, compared with eight times in the 2015 FAST Act and no mentions whatsoever in the 2012 MAP-21 legislation.
While the incorporation of resilience factors in regular project prioritization of a STIP or TIP is an area for further research, both the diagnostic tools in the NCHRP Web-Only Document 391, Volume 2, Section 1, can provide a basis for prioritizing resilience investments. Because the 2022 BIL includes the PROTECT program with dedicated resilience funding, prioritization among resilience projects based on their wider network significance (cascading effects or whole-network effects as described) is a significant focus of this playbook.
Prioritizing Resilience in Transportation Programming
Quantifying the value of a project’s resilience benefits in comparison to other projects can be difficult. Dorney et al. (2021) observe that resilience-related scoring factors for transportation projects are not common.32 The report applies the capability-maturity model described in Play 2 to state DOTs’ prioritization of transportation projects. For this reason, typical approaches to resilience have either (1) assigned qualitative points to projects that “check the box” for addressing specific resilience needs, (2) designated a standalone resilience program, or (3) integrated resilience into other programs.33
Based on a nationwide survey of 40 freight planners, Monsreal et al. (2019) identified only one state (Missouri) that included resilience among its project prioritization factors, primarily as it related to congestion and nonrecurring highway incidents.34
Standalone programs may select or fund resilience as special designated projects in state legislation or executive actions (such as the Colorado DOT resilience policy directive) or be implemented through departments other than the DOT (such as the North Carolina Department of Public Safety’s resilience grant program or Florida’s program housed in the Emergency Management department). When resilience funding is designated into an existing state program, it is often within the area of a Transportation System Management and Operations (TSMO) program.
Comparing Investments from a Network Perspective: Cascading Effects
The cascading-effects methodology introduced in Play 1 (Figure 8) enables agencies to prioritize resilience investments based not only on the vulnerability and use at the asset location, but also on the wider effects on shipments, origin and destination locations, workers, and households affected by the vulnerability. The cascading-effects methodology shows the geographic distribution of a disruption’s impacts across the transportation network as well as a profile of the populations, businesses, and occupations (by place of residence or business) that could be
compromised by the disruption. This level of detail enables agencies to compare factors such as the following:
- The number of households or jobs affected by a disruption.
- The share of jobs in different industries (including essential, urgent-access industries such as utilities, retail, and services) in comparison to long-term recovery industries like finance, mining, and agriculture.
- The share of low-income and otherwise disadvantaged households or businesses potentially affected by a disruption.
For example, applying the cascading-effects model (described in more detail in Play 1) to Illinois’ statewide freight network shows the geographic reach of potential disruption to three highway links. Further application of this methodology (as shown in Figure 39) compares the three possible project investments as they might be compared in a statewide resilience program.
Identify Regions and Hinterlands: To compare vulnerabilities addressed by each of these projects in terms of geographic concentration, income and social equity status, and industry type, it is helpful to divide the state into regions affected by potential disruptions to the subject
Comparing Three Projects in Illinois
Three potential resilience projects on the Illinois highway network represent different tiers of freight dependence in terms of overall volume, truck traffic, and proximity to hard and soft assets (further described in NCHRP Web-Only Document 391, Volume 2, Section 5). The Tier 1 and 2 projects are interstate projects in rural or exurban areas, where as the Tier 3 project is a rural arterial. Each project is expected to have a different construction cost, but the comparative resilience payoff of each project will be very different in terms of geographic reach, social equity, and workforce/industry access. These differences cannot be captured in a traditional benefit-cost analysis. The following maps show the project locations (in red) and geographic reach of disruption vulnerability addressed by each.
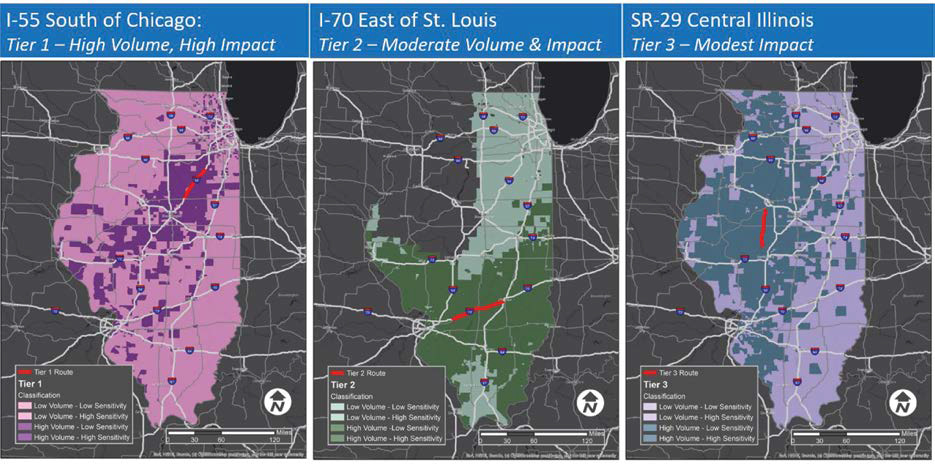
facilities. In this construct, a trade center is a city or urban area served by a comparatively dense transportation network that produces and attracts significant volumes of freight. A hinterland is a rural or exurban area served by a more sparse transportation network that features a lower density of resources and activities. Organizing the market into trade centers and hinterlands not only provides a way to report cascading effects but also enables comparison of how a resilience improvement (or disruption) may affect urban and rural markets differently.
Figure 40 depicts Illinois’ trade centers and hinterlands. These are the regions used in the cascading-effects analysis comparing the three projects shown in Figure 39.
Compare Effects Between Projects: The cascading-effects analysis offers a lens through which to compare the projects by considering their potential effects on access to urban and rural areas, economic activity, and the vulnerability of households in different economic strata. Figure 39 compares impacts of the three projects in terms of the overall size of the affected markets, the composition of those markets by industry categories expected to require urgent access during a

disruption or recovery period (including sensitive industries such as utilities, government, retail, and services), and the concentration of low-income households.
For example, the cascading network effects of the I-55 (Tier 1) project affect a larger vulnerable market than either of the other two projects, though the projects may satisfy different investment criteria.
Similarly, the SR-29 (Tier 3) project affects a larger percentage of Illinois statewide employment in both the Peoria and Sangamon hinterlands than the much larger I-55 project.
It also is notable that, while the I-55 project is closest to Chicago, it affects the highest share of low-income workforce access in the McLean hinterland, with the project protecting a larger share of nonpoverty than poverty households in the Chicago trade center and hinterland.
Users should note that, while the demonstration in Figure 41 (Section 5) reduces the cascading effects to sensitive and nonsensitive employment types, and poverty or below poverty equity strata, the analysis supports similar queries exploring how projects affect access to jobs in any NAICS industry category or populations stratified by household income, auto-ownership, or other variables available in LEHD data (or in statewide travel model demographics). Furthermore, cascading-effects analysis can compare several project types, including highway projects like the ones shown in Figure 39 and intermodal projects like the ones covered in Play 4.
Play 7 explores how future research can address opportunities for planners and resilience teams to query, articulate, and use the robust body of information about vulnerable and protected labor and commodity markets using the cascading-effects methodologies created and piloted in NCHRP Web-Only Document 391, Volume 2.
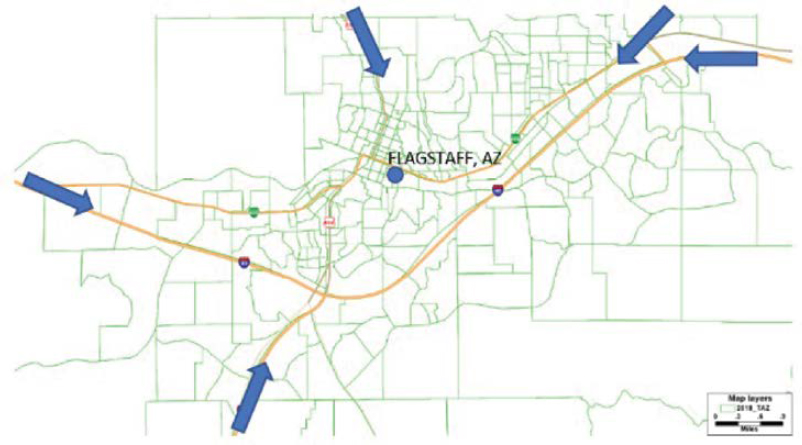
Comparing Investments from a Whole-Network Perspective: The whole-network robustness methodology for identifying the assets most critical to preventing network failure (described in Play 4) can also be used to test improvement scenarios or prioritize resilience investments. The rationale for whole-network robustness analysis involves prioritizing improvements to links that are essential to preventing the performance collapse of the entire network. This is in contrast to the cascading-effects method, which compares the vulnerability protection profile of comparative improvements in terms of which aspects of the economy or geographic regions an investment protects.
Figure 42 illustrates the transportation network in Flagstaff, Arizona, where this methodology is used to compare different improvement scenarios. Only a handful of entry points into the city exist, making Flagstaff vulnerable to disruptions that increase travel times and potentially block access to services and businesses. The benefits of increasing capacity and improving access to the city can be visualized in the robustness analysis. Section 7 provides detailed instructions on the use of this method and its practical interpretation in Flagstaff’s planning process.
Figure 43 shows the improvement in performance under four scenarios. The vertical axis represents the performance under consecutive disruptions, so the further to the right on the horizontal axis the collapse in performance occurs, the more resilient the network is. Hence, a completely robust network would exhibit a line sloping downward at 45 degrees from top left to bottom right. The figures show that improvements to the network have two main effects:
- Each improvement has a different impact on the number of disruptions the network can withstand before reaching failure (as shown by how far the dotted vertical lines are along the horizontal axis).
- Investments make the network more predictable in the face of disruption (the smallest black rectangle).
Using these two criteria, the investment shown in the lower left-hand corner represents the most valuable investment that could be made in the Flagstaff network.
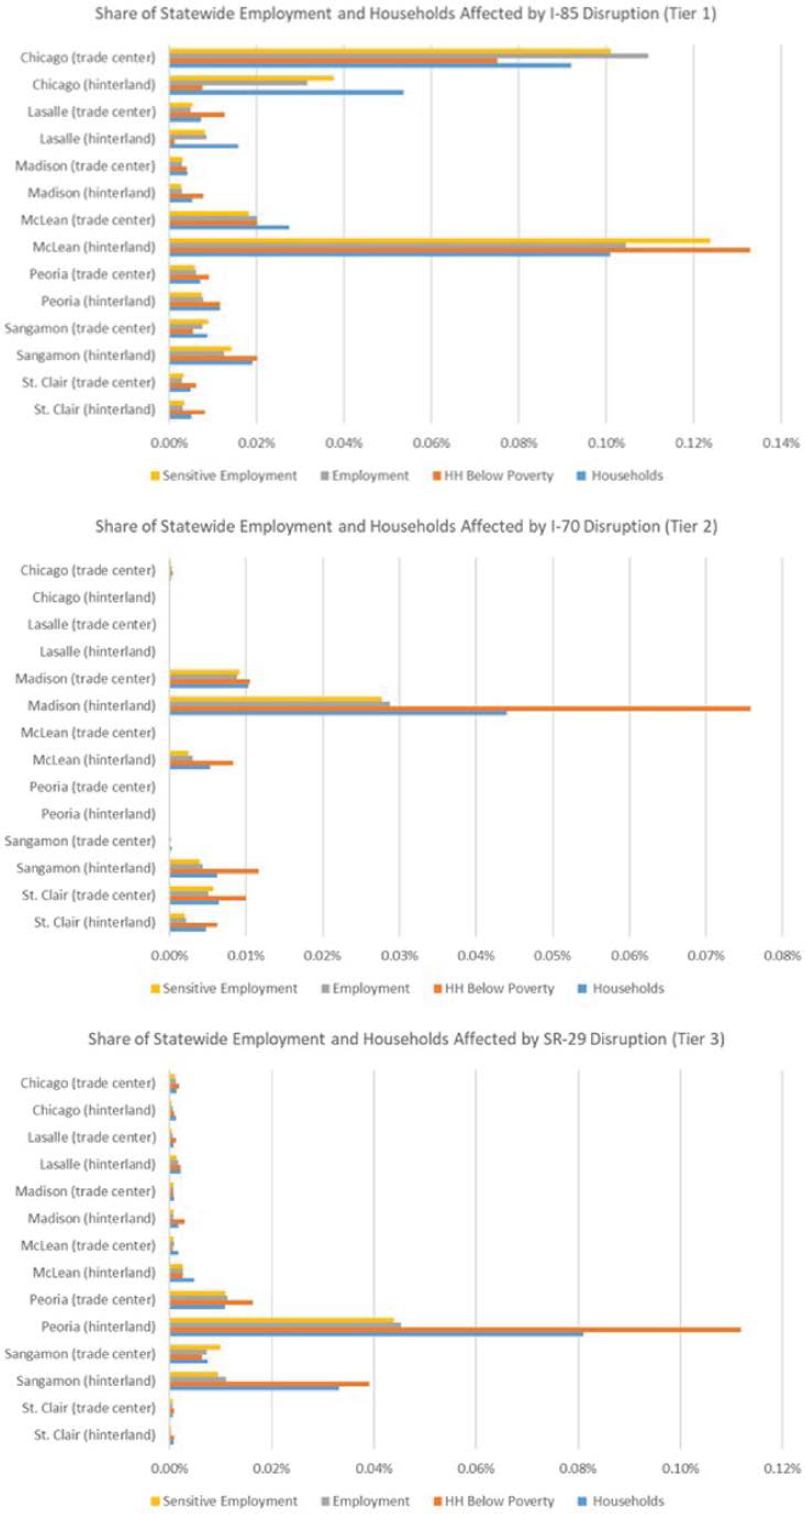
Figure 41. Illinois’ employment and households affected by disruptions.

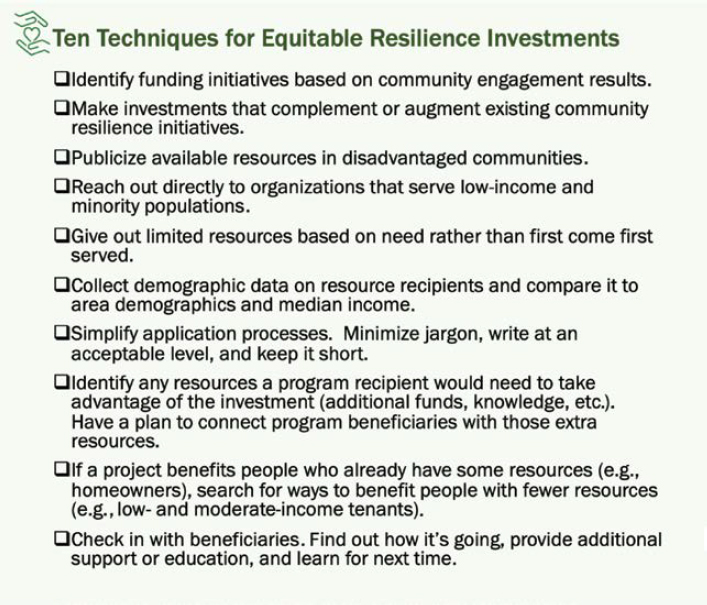
Invest in Equitable Resilience
Identifying and consulting community stakeholders is a core component of an effective, equitable resiliency planning process. Doing so is an opportunity to identify untapped community resources and proactively identify vulnerabilities that may be overlooked during technical planning exercises. In the long term, resilience-planning processes are strengthened when they include institutionalized mechanisms for ongoing community partnerships.
Two of the most viable options for learning about community stakeholder perspectives in their own words are focus groups and one-on-one interviews. Surveys are sometimes used for stakeholder consultation, but their rigidity and reduced detail make them less useful for understanding community perspectives holistically and for detecting the unknowns that can be revealed through interviews and focus groups. One-on-one interviews also have advantages over more commonly used focus groups. As compared to a traditional focus group, individual interviews give a clearer picture of variations between people and are well suited for identifying vulnerabilities that disproportionately affect some communities more than others. Additionally, from a pragmatic standpoint, vulnerable stakeholders tend to be difficult to schedule and may lack transportation or the technological capabilities to participate in an online event. It is much easier to get six thoughtfully selected interview participants to talk with you one-on-one than it is to get them to talk with you all at the same time.
“In Their Own Words” outreach following Flagstaff, Arizona, Wildfires
Flagstaff, Arizona, has experienced an increasing number of wildfires and related post-wildfire flooding. These disasters sometimes result in major highway closures, with few alternative routes available. In summer 2022, Flagstaff was affected by the Pipeline and Tunnel fires. The Flagstaff Metropolitan Planning Organization (FMPO) wanted to use the recent disasters as an opportunity to identify current community needs and risk factors as well as to reflect on ways to increase community resilience before the next disaster.
Approach: One-on-one interviews were used to improve understanding of community stakeholders’ perspectives in their own words. FMPO was particularly interested in the effects of the fires on the region’s Navajo community, many of whom travel frequently across the routes closed by fires and fire-related flooding. Additionally, planners thought it would be valuable to assess evacuation readiness among Flagstaff’s nondriving residents, whether nondriving or car-free by choice.
Six interview participants were identified through the city of Flagstaff’s community forum, an online forum for civic engagement with more than 3,000 registered users. Participants were screened based on membership in populations of interest. Participants were interviewed via online videoconference and given a gift of a $25 gift card to thank them for their time.
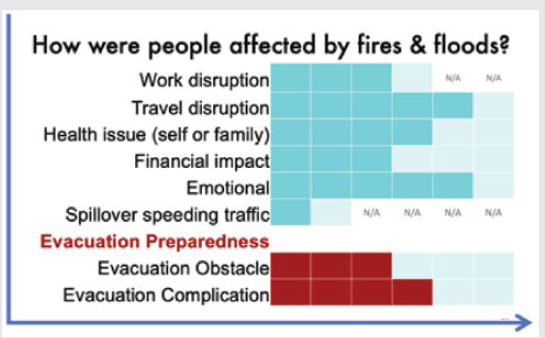
Findings: All respondents were affected by wildfires to greater and lesser degrees. The consequences of those disasters were determined not just by the events themselves but by people’s pre-existing strengths and vulnerabilities, and the resources they had to use for coping with the consequences. For example, while salaried, white-collar workers experiencing a work travel disruption did not report losing income, low-income service workers were vulnerable to income loss. For Native American residents, the normally 90-minute trip from Tuba City, on the Navajo-Hopi reservation, to Flagstaff—where many Navajo Nation members go to work, access healthcare, or visit family—doubled in length or became impossible.
Evacuation preparedness among vulnerable populations also was found to be worse than expected. As one nondriving resident put it, “I have a plan, and I’ve got my passport, and some cash and a jump bag and my bathroom set up so I can grab cleansing items on my way out the door, but I do not know how I would get out of here.”
For FMPO, the project gave a very real face to community needs and the effects of FMPO’s decisions. It replaced FMPO’s hunches about community needs with data. Additionally, FMPO made connections with community stakeholders. Leads were identified to work with a local stormwater mitigation organization and to connect with Flagstaff’s homeless community, who live in the wildfire-vulnerable national forest. Participants reacted to the experience positively. As one said, “There’s really been no one to speak to about this. So, them doing this kind of outreach? Let them know that I appreciate it.”


