On-Street Bicycle Facility Design Features: A Guide (2025)
Chapter: 3 Contextual Factors Impacting Bikeway Safety
CHAPTER 3
Contextual Factors Impacting Bikeway Safety
For midblock bikeways, the design elements described in Chapter 4 each have an impact on bicyclist safety, many of which can be addressed by the provided design strategies. However, the visual scan of the separated bicycle lane crash locations also revealed the importance of known contextual factors that may increase bicyclist crash risk which designers could consider and where existing guidance is lacking or unclear. Designers are not typically able to modify these factors, but they need to be aware of and mitigate potential safety impacts to users where practicable. The following discussion provides an overview of these factors with considerations for how to mitigate increased crash risk associated with them.
3.1 Roadway Grades
During design, it is important to recognize the relative operating speeds of all users who may come into conflict. A key factor impacting a bicyclist’s operating speed is roadway grade. While attempts have been made to apply traffic-calming treatments to manage the operating speeds of bicyclists, research has not been conducted to determine how to achieve a desired operating speed or to show if traffic-calming strategies applied to bicyclists will achieve the desired results.
Since the grades of most roadways and bikeways typically cannot be significantly changed, the following could be considered during design:
- On flat terrain, a typical non-powered bicyclist’s operating speed is between 8 and 15 mph, with average speeds closer to 10 mph (AASHTO 2012).
- E-bikes are increasing in popularity. Initial research shows they narrow the typical range of operating speeds and increase average operating speeds up to 15 mph on flat terrain (Langford et al. 2013).
- Downhill grades can result in downhill operating speeds of more than 15 mph, with some research showing that bicyclist crash risk and crash severity increase on roads with grades greater than 4 percent (Seattle DOT 2016).
- Micromobility devices are likely operating at speeds close to typical bicyclists’ speeds, with many cities requiring speed limiters on rental devices that restrict top speeds to 15 mph.
- Traffic calming for bikeways has been tried in the following circumstances; however, research has not been conducted on the effectiveness of the treatment:
- Raised crossings in advance of and through passenger loading zones;
- Raised crossings in advance of and through bus stops;
- Chicaning approaches to shift the bicyclist’s approach angle to an intersection, alley, or driveway crossing; and
- Narrowing of bicycle lanes to limit passing and operating speeds.
- A wide variety of traffic-calming treatments are effective in managing motorist operating speeds and could be considered where motorist operating speeds are a concern for bicyclist
- safety. Traditional traffic-calming guidance has typically recommended against the use of more effective raised devices and traffic circles on roadways with slopes of 8 percent or more. This guidance was not informed by research and some communities with steeper roadways have experimented with these devices on streets with slopes greater than 8 percent. More research on this topic is recommended [FHWA n.d. (b)].
- Posted speed limits could be reviewed at locations where a lowering of posted speed could improve bicyclist safety outcomes. It is recommended to use the FHWA USLIMITS2 tool (FHWA 2023) to perform the engineering study to determine an appropriate speed limit as this tool supports the assessment of a wide range of contextual factors within a Safe System framework.
3.2 Driveway Volumes
NCHRP Web-Only Document 414 found that sites adjacent to commercial and civic land uses were associated with a higher crash risk and sites adjacent to residential land use were associated with a lower crash risk. Driveway vehicle volume was not studied since many cities do not collect or maintain driveway volume data.
As noted in NCHRP Report 659: Guide for the Geometric Design of Driveways (2010), the design of a driveway is affected by both its setting and land use. The setting can be urban, suburban, or rural, and the types of vehicles served by a driveway and the number of anticipated conflicts can vary greatly depending on land use, such as a single-family home or a convenience store or gas station (Gattis et al. 2010a).
Driveway volume thresholds can be a useful metric for determining when conflict mitigation measures may be necessary based on bicyclist exposure (see Section 4.4). However, designers typically do not have driveway volumes readily available, and estimating conflicts based on the number of parking spaces served per driveway can be cumbersome due to variables such as one or more land uses being served by the parking space, different time-of-day demands, and parking occupancy rate.
Existing guidance typically categorizes driveway volume into three categories: low, medium, and high. The Michigan DOT Sidepath Intersection and Crossing Treatment Guide (2018) defines the driveway volume thresholds based on the number of motor vehicle crossings per hour (Figure 6). The AASHTO Bike Guide (2023) uses similar classifications but defines thresholds based on the number of crossings per day: minimal (less than 25 per day), lower (25–500 per day), and higher (greater than 500 per day).
Both guides provide limited and incomplete examples of how volume may be tied to land use and context. For example, low-usage driveways may be represented by a single-family home or a standalone business and medium-usage driveways may be represented as a small subdivision or strip mall development (Michigan DOT 2018); lower-volume driveways may be residential and higher-volume driveways may be commercial (AASHTO 2023).
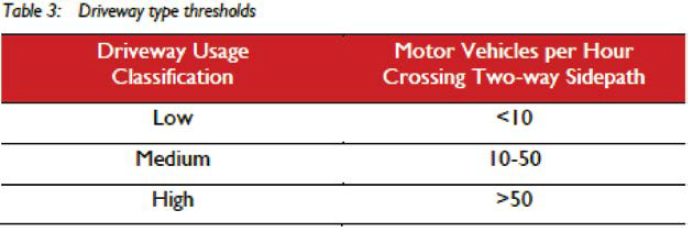
Table 1. Estimated number of driveway conflicts based on land use.
| Land Use Group | Number of Driveway Conflicts | ||
|---|---|---|---|
| Minimal | Lower | Higher | |
| < 25 / day | 25-500 / day | > 500 / day | |
| <10 at peak hour | 10-50 at peak hour | >50 at peak hour | |
| Industrial1 | N/A | Industrial | N/A |
| Residential2 | Single-family detached | Multi-family, greater than 10 spaces per driveway | N/A |
| Multi-family detached, less than 10 spaces per driveway | |||
| Lodging3 | Dense urban hotel | Urban/suburban hotel | N/A |
| Commercial or Mixed Use4 | Commercial or mixed use, fewer than 10 spaces per driveway | Commercial or mixed use, between 10 and 50 spaces per driveway | Commercial or mixed use, greater than 50 spaces |
| Services5 | N/A | N/A | Fast-food restaurant |
| Gas station/convenience | |||
1. Industrial land uses generate lower trips per parking space and are typically medium volume (25-500 conflicts per day per driveway). However, due to larger design vehicles, the effective turning radius of entering vehicles and therefore speed may be higher (see Section 3.4.3, Driveway Design)
2. Single-family detached or multi-family land uses with fewer than 10 spaces per driveway are typically low volume (fewer than 25 conflicts per day)
3. Lodging land use in an urban/suburban context is typically medium volume (25-500 conflicts per day per driveway). Lodging in a dense urban setting can be assumed to have the same volume as mixed-use land use (see below)
4. Mixed-use land use is dependent upon the number of parking spaces served per driveway. In general, mixed-use land use serving fewer than 10 spaces per driveway will be low volume (fewer than 25 conflicts per day), between 10 and 50 spaces per driveway will be medium volume (25-500 conflicts per day), and greater than 50 spaces per driveway will be higher volume, regardless of setting or location. If parking demand is limited to peak hours, then the designer could consider that most of the conflicts will occur during a limited duration of the day
5. Service land uses such as fast-food restaurants, gas stations, or convenience stores have the highest trips generated per parking space and can typically be assumed to have high volume (more than 500 conflicts per day, regardless of context or number of driveways)
The Institute of Transportation Engineers (ITE) Trip Generation Manual can be used to estimate the number of trips generated per independent variable by a land use group in different settings (for example, the number of trips per dwelling unit in a multi-family dwelling in a suburban versus dense urban setting, or the number of trips per hotel room in a suburban versus urban core setting) (ITE 2017). The ITE Parking Generation Manual can be used to estimate the number of parking spaces per independent variable (for example, the number of parking spaces recommended for one dwelling unit or one hotel room) (ITE 2017). When applied together, this data can be used to estimate the trips per parking space per driveway. Table 1, based on the above-mentioned ITE manuals, provides a generalized estimate of the number of driveway conflicts that can be anticipated based on land use groups and settings using this type of analysis. Designers could also consider the number of driveways, their spacing or frequency along the corridor, the bikeway type (one-way or two-way separated bicycle lanes), and peak period of travel demands when determining suitable design treatments for driveways.
Table 1 can be used in combination with Table 3 in Section 4.5 to determine mitigation strategies based on the estimated number of conflicts for a given land use and setting, as applicable.
3.3 Pedestrian Generators
The literature review conducted as part of NCHRP Web-Only Document 414 included studies that indicated that the number of bus stops and bus route length are positively associated with bicycle collisions. It also included studies that indicated that land and building use can influence bicyclist safety. The visual scan identified proximity to transit as a potential contributing factor to
increased bicycle crashes, especially crashes between pedestrians and bicyclists. It will neither be practicable nor desirable to reduce pedestrian generators or to relocate bikeways to avoid them. At locations where bicyclists and pedestrians are likely to come into conflict, design treatments that could decrease crashes include:
- Provide wider bikeways or bikeways with buffers that allow space for:
- Pedestrians to be seen, improving bicyclists’ reaction time to yield to pedestrians,
- Pedestrians to temporarily pause to allow the bicyclist to pass before entering the bicyclist’s path,
- People to load or unload from personal or commercial vehicles parked adjacent to the bikeway, and
- Transit users to embark/debark from a transit vehicle without entering a bikeway.
- Mark pedestrian crossings clearly with marked crosswalks.
- Channelize pedestrians to marked crossings where high pedestrian volumes across a wider area are likely to result in increased conflicts.
- Provide educational or regulatory signs and markings to communicate bicyclists’ yielding responsibilities.
- Provide lighting at locations where night-time pedestrian crashes are likely to occur or there is a history of crashes occurring.
- Ensure pedestrian infrastructure supports the mobility needs of pedestrians with disabilities to minimize their need to operate within a bikeway.
3.4 Frequency of Access Points
Driveways are a primary source of midblock conflicts between bicyclists and motorists. When street access points such as driveways and alleys are spaced closely together, vertical protection in the buffer of an on-street separated bicycle lane may not be feasible for extended portions of the bikeway, resulting in the separated bicycle lane being downgraded to a bicycle lane or buffered bicycle lane in the vicinity of the high conflict areas (see Figure 7).
At locations with closely spaced driveways, access management techniques need to be considered where practicable, especially as properties redevelop. Access management is an FHWA Proven Safety Countermeasure (FHWA 2021). In some cases, it may be feasible or desirable to implement access management principles to improve overall traffic flow and safety within a corridor and to reduce or eliminate motorist conflicts with bicyclists at driveways.
When feasible or desirable, strategies that could be considered to reduce the frequency or impact of access points include the following:
- Consolidate driveways to reduce the number of potential conflicts between bicyclists and motorists.
- Restrict left turns and/or through crossings of a separated bicycle lane.
- Combine turn restrictions with raised medians that control prohibited movements.
- At signalized driveways, restrict turns on red to maintain the integrity of crossings and bicycle queuing areas.
- Relocate driveways to side streets or alleys or provide frontage roads as an alternative to access points.
- In circumstances where the application of access management has the unintended consequence of increasing motorist operating speeds, particularly on roadways where bicyclists share lanes or are operating within standard bicycle lanes, measures to reduce motorists’ operating speeds could be considered, including the application of speed safety cameras or traffic-calming treatments.
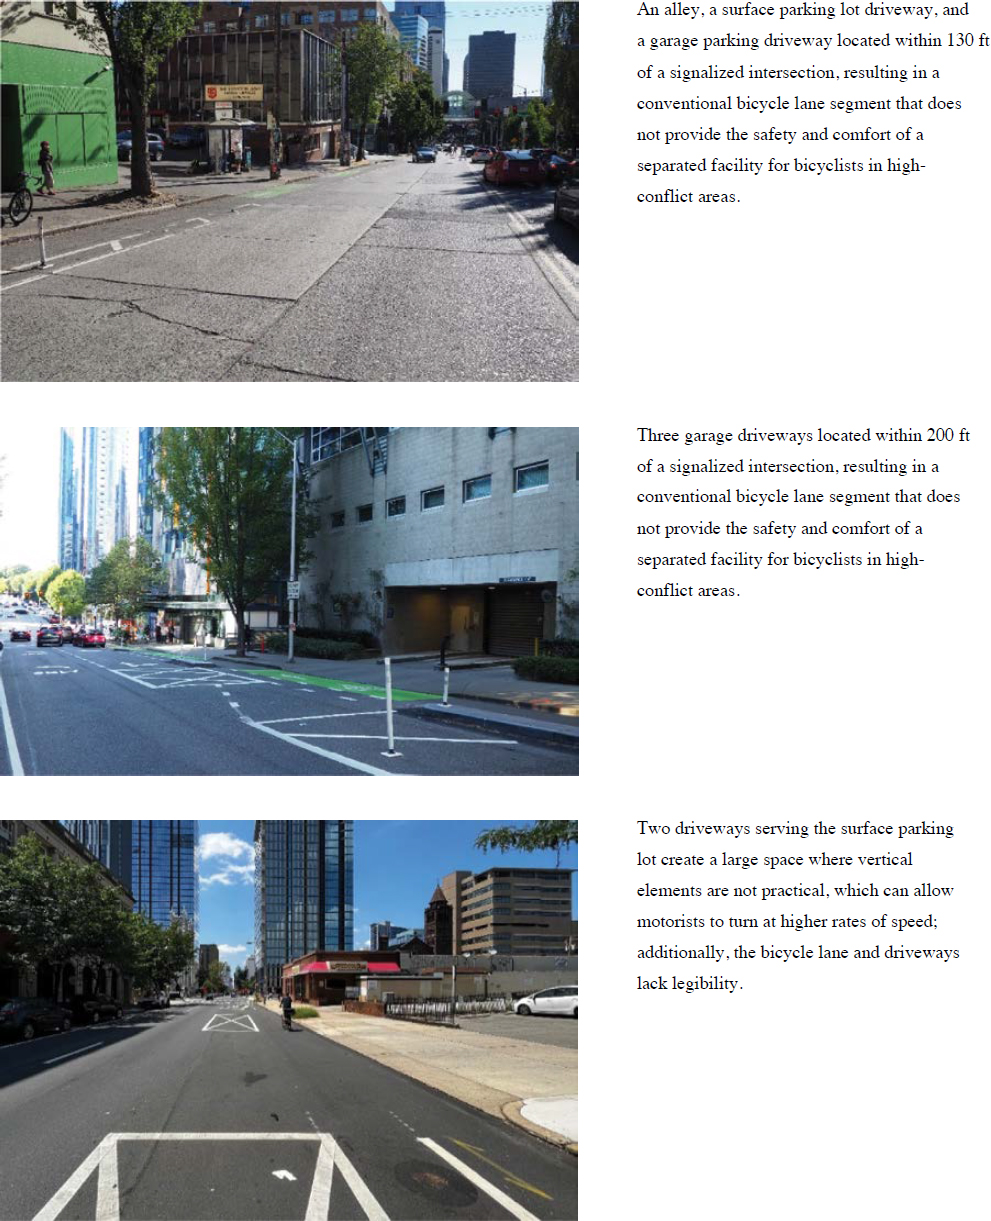
When existing driveways cannot be removed or consolidated, designers may explore other mitigation measures for reducing the potential for bicyclist crashes at conflict points (see Section 4.3 and Section 4.4). In some cases, it may be appropriate or necessary to reconstruct the street to provide a raised sidewalk-level bicycle lane, or to select a different bikeway type where frequent driveway spacing makes the provision of a separated bicycle lane with pavement-mounted vertical elements challenging (Figure 7).
3.5 Chapter Summary
This chapter provides contextual factors affecting bicyclist safety at midblock locations that could be considered when installing bikeways. A list of quantitative and qualitative measures to consider for improving bicyclists’ safety at midblock locations is provided. These measures include:
- Roadway grade—Roadway grade affects both bicyclist and vehicle speeds, as well as the speeds of emerging micromobility devices such as e-scooters and e-bikes. The research team suggests providing traffic-calming measures such as raised crosswalks, raised crosswalks in advance and through bus stops, and chicaning approaches to shift bicyclists’ approach angle. Narrowing bicycle lanes to limit passing can also help to reduce speeds for bicyclists at downhill grades (greater than 4 percent). Both traffic-calming measures and posted speed limit reductions are suggested for motor vehicles. The research team proposes using the ITE and FHWA resources on traffic-calming measures and posted speed limits for motor vehicles.
- Driveway volumes—NCHRP Web-Only Document 414 used land use type as a proxy for driveway volumes and found that sites adjacent to commercial and civic land uses were associated with a higher crash risk than sites adjacent to residential land use, which were associated with a lower crash risk. Estimating driveway volumes is challenging. One of the suggestions is to use low, medium, and high volumes as a qualitative measure to estimate driveway volumes (see Figure 6). The research team proposes using the ITE Trip Generation Handbook to estimate the potential number of conflicts and to consider driveway designs (presented in Section 4.5) to reduce bicyclist and motor vehicle conflicts.
- Pedestrian volumes—According to modeling results in NCHRP Web-Only Document 414, bus stops and routes were associated with a higher number of bicyclist crashes. This may be due to a higher volume of pedestrians and therefore pedestrian entries into bicycle lanes, which may result in higher pedestrian and bicyclist crashes as well as crashes between bicyclists and motorists if the bicyclist must divert into oncoming traffic to avoid pedestrians. Although not found in NCHRP Web-Only Document 414, similar conditions can be assumed at sites with a higher number of pedestrians (e.g., commercial areas). The research team provides a list of considerations around these sites to reduce the potential conflict between pedestrians and bicyclists, such as providing wider bikeways or bikeway buffers, clearly marking pedestrian crosswalks, channelizing pedestrians to marked crosswalks, providing lighting (especially for sites with higher nighttime crashes), providing educational or regulatory signs for bicyclist yielding, and ensuring pedestrian infrastructure supports the mobility needs of pedestrians with disabilities to minimize their need to operate within a bikeway.
- Access points—Access points such as driveways and alleys are primary midblock conflict locations between motorists and bicyclists. The research team suggests reducing conflict potential associated with access points using several strategies, including consolidating driveways, restricting left turns, combining turn restricting with raised medians, restricting turn on red at signalized driveways, or relocating driveways to side streets or alleys. When these measures are not applicable, designers could explore other mitigation strategies such as reconstructing the street to provide a raised sidewalk-level bicycle lane.


