A Synthesis Center for Paleoenvironmental Records of Extreme Events (2026)
Chapter: 2 The Role of Paleoenvironmental Data in Understanding Extreme Events
2
The Role of Paleoenvironmental Data in Understanding Extreme Events
WHAT IS AN EXTREME EVENT?
The different lenses through which extreme events are viewed—timescales, impacts, the ability to detect them in paleoenvironmental data—make establishing an explicit definition of extreme events in the paleoenvironmental record challenging. The committee has adopted a broad set of criteria that allow extreme events to be defined by either the impact of the event or its physical properties, such as absolute magnitude or recurrence rate. Any event can be considered an extreme event that is sufficiently consequential, high-magnitude, rare, or rapid that it falls significantly outside the typical distribution of the class of similar such events (e.g., Stewart et al., 2022).
Definitions of extreme events vary substantially across the scientific literature. McPhillips et al. (2018) and Stewart et al. (2022) found that many studies of extreme events across Earth, environmental, engineering, and social sciences did not provide an explicit definition. In addition to differing disciplinary assumptions, other fundamental and conceptual challenges include the varying temporal scales over which events occur, the different statistical approaches used to detect and attribute events, the diverse settings in which extreme events are identified, and the purposes for which identifications are used.
Temporal considerations particularly complicate establishing a universal definition. For example, in the present day the duration of different events varies from minutes-long tornadoes to multidecade droughts, so requiring an extreme event to be sudden can be ambiguous. Additionally, the
choice of baseline reference periods and the timescales over which extremes are quantified can determine which events qualify as extreme.
Temporal considerations can be especially problematic in paleoenvironmental records. For example, longer duration and higher magnitude events may be more easily distinguished because they are preferentially preserved or leave clearer paleoenvironmental signals. Additionally, while a single devastating storm or large volcanic eruption would likely find reasonable consensus as a discrete event, it is less clear whether longer duration or directional changes, such as a multicentury drought or unquestionably extreme changes such as the Paleocene–Eocene thermal maximum are “events” or rather reflect long-term change in the state of the Earth system.
Formal statistical approaches to defining extremes often employ probability-based metrics, most commonly using return periods or exceedance probabilities (i.e., how likely a given event will occur over a certain time period). Engineering applications often favor return periods, with infrastructure designed to withstand 100-year or 1,000-year events (corresponding to 1 percent or 0.1 percent annual exceedance probabilities). However, these approaches require long data records to reliably estimate statistical distributions, assume environmental stationarity, and are sensitive to the choice of underlying assumptions. For example, shifts in the long-term mean climate (i.e., nonstationarity) can produce dramatic changes in the expected frequency of extreme weather events (Easterling et al., 2000; Sura 2011; Alizadeh et al., 2020).
A further challenge lies in the tension between physical definitions of an event versus the practical impacts, where an extreme event could be identified through focusing on meteorological or hydrological metrics but could also be defined by its socioeconomic consequences. For example, a 5-foot flood (meaning 5 feet above flood stage) on a small tributary far from any urban environment may not cause as much damage to infrastructure as a 5-foot flood on a river running through a major metropolitan area, making the economic damage in dollars alone more significant in the latter case than the former. However, a 5-foot flood on a small tributary might completely destroy an entire small rural community. In this case, the impact may be smaller in total dollars than the metropolitan example, but the permanent loss of an entire community may be even more devastating. Because of these complications, the committee does not adopt a single technical definition for extreme event. Rather it interprets extreme events in a broad context that can include their impact, magnitude, rarity, or rate.
WHAT ARE PALEOENVIRONMENTAL DATA AND RECORDS?
In the present day, environmental data are collected by a variety of instrumental and direct observational methods. These can include air or
ocean temperature measured by instruments and satellites (Kent et al., 2017), daily rainfall measured by gauges, atmospheric gas concentrations measured by balloons or satellites, and ground motions measured by seismometers or global positioning system satellites. These measurement and monitoring systems provide a highly resolved understanding of the current state of the Earth and are the foundation of contemporary improvements in weather forecasting skill (Magnusson and Källén, 2013; Toth and Buizza, 2019), in the detection of earth movement, in the determination of atmospheric greenhouse gas concentrations, and more. However, these systems are limited to the time window of modern scientific measuring instruments, which extend at most to the late nineteenth century (e.g., weather station networks) and to the late twentieth century for many other observation types (e.g., satellite-based remote sensing). Thus, these measurements and observations are limited in their ability to identify the processes that govern changes in the frequency and magnitude of extreme events over longer periods of time.
To complement these modern instrumental records and extend the time coverage further into the past, environmental information can also be acquired through characterizing natural geological or biological archives (see Figure 2-1). Natural systems record information through physical and chemical processes, such as sedimentation, rainfall, and snow accumulation, and through biological processes of growth that leave distinct physical or chemical signatures (e.g., tree rings or isotopic ratios in shells). For example, trees add a new layer to their trunks each year, and because the growth rate of trees in semiarid environments is limited by water availability, the tree-ring thickness is directly related to the amount of precipitation received in these environments. Consequently, records of tree-ring thickness through time can be used to determine changes in precipitation and other related hydroclimate variables such as streamflow rate (see Figure 2-2). In this example, the tree rings provide a natural, inferred record of hydroclimate.
These indirect and natural indicators of past environmental conditions are referred to as proxy data. Multiple proxies can be recovered from the same archive, each recording different aspects of past environmental change. For example, tree-ring width, which is affected by total rainfall over the growing season, can be combined with measurements of the wood’s oxygen isotopes, which in certain environments can carry a signal of individual intense rainfall events. These proxy indicators can be calibrated against the instrumental and direct observational record for the time period of overlap (e.g., for rainfall data, the 20th and 21st centuries) to ensure that the indirect proxy measurements accurately record changes seen in the instrumental data.
Environmental data that can be used to infer past conditions of the Earth are termed paleoenvironmental data. Whereas decades ago, this term

NOTE: Schematic representation of the typical workflow for how paleoenvironmental information is derived from natural archives, from the initial field collection and long-term storage of natural archives through to the interpretation of past environmental conditions. Archives are first obtained in the field (“Collection”), preserved in repository facilities for future access (“Archive Storage”), and examined and measured in laboratory settings (“Characterization”). This is followed by scientific analysis and contextual explanation to better understand past environments (“Interpretation”). Characterizations used to support interpretations are stored in digital archives (“Primary Data Archive”). Arrows indicate the iterative nature of this process, in which archived materials and primary data can be revisited for new observations or reinterpretation as scientific questions and analytical tools evolve.
SOURCE: Committee generated. Image for Collection is from Nora Nieminski; image for Archive Storage is from Continental Scientific Drilling; image for Characterization is from the International Ocean Discovery Program (IODP), CC BY 4.0; image of Interpretation is from Bradley D. Cramer; image of Primary Data Storage is a screenshot from the Neotoma Paleoecology Database. Erick Bravo, IODP JRSO.
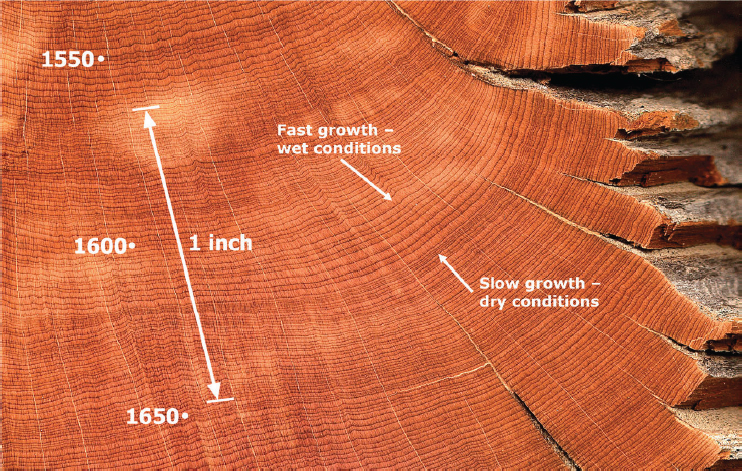
NOTE: Shown is a scanned image of a deadwood sample (GGR100) taken from a Rocky Mountain juniper collected from the northern region of Yellowstone National Park. The specimen covers the period 723–1792 CE. Because tree growth and annual ring width are influenced by various factors, including climatic conditions, relationships between ring widths varies. Climate data, such as air temperature, precipitation, snowpack, and river discharge, are used to reconstruct and interpret past climate variability.
SOURCE: Adapted from an image developed by Shaul Hurwitz, Yellowstone Volcano Observatory, U.S. Geological Survey.
focused on data derived solely from natural archives, it is now understood that written records, oral traditions, and archaeological remains also provide critical information regarding environments of the past. The committee considers all data that are used to infer past environmental conditions to be paleoenvironmental data and does not limit its use to only natural archives in order to reflect the importance of cultural sources of information.
These archives vary in their temporal extent (the length of time covered) and temporal resolution, which is the amount of time represented by a single measurement (see Figure 2-3; Ruddiman, 2008). Some archives, such as tree rings, ice cores, speleothems (cave deposits), lake sediments, and corals, have high temporal resolutions (subannual to decadal) and are well suited for reconstructing environmental changes and extreme events within the past million years (Cutts, 2024), while other archives, such as ocean sediments and sedimentary rocks, extend our understanding of past
environmental change into the distant past, millions and even billions of years ago (see Figure 2-3; Ruddiman, 2008). Through the use of natural environmental archives and the proxy records they provide, scientists can ask compelling questions about how the Earth has evolved and how the Earth’s environment has changed through time.
HOW ARE EXTREME EVENTS RECORDED IN PALEOENVIRONMENTAL DATA?
Some natural archives are well suited to record specific types of extreme events. For example, fire scars in tree rings directly indicate past exposure to wildfire. Wildfire also can be recorded in other natural archives such as charcoal layers in sediments and in isotopic records of corals (see Figure 2-4 and Table 2-1). Some natural archives can record different kinds of extreme events. For example, tree rings record evidence of fire, abrupt heat and cold events, landslides, severe storms, earthquakes, and volcanic eruptions as well as hydrological extremes (see Figure 2-2). In general, most natural archives can record many different types of extreme events through a variety of proxies, and one particular extreme event may be evident in multiple proxies (see Figure 2-4 and Table 2-1). Thus, unlike instrumental data which are bound by space, time, and specific observations, there is no one-to-one correspondence between the types of extreme events and natural archives.
Finally, paleoenvironmental information can record extreme events either directly, such as by a signal of a past extreme event and its effects, or indirectly, by providing information about the background environmental conditions that produce extreme events. Both kinds of information are highly useful. The committee conceptualized the contributions of paleoenvironmental data by defining three tiers based on the type of information and associated constraints on extreme events that they provide.
Tier 1—Direct Records of Individual Events
Tier 1 consists of paleoenvironmental data that directly record individual extreme events or their effects. Such records contain biological, physical, or chemical information that identifies the absolute or relative magnitude, timing, or frequency of specific events. For example, Tier 1 data might include nineteenth century newspaper accounts of hurricanes in Louisiana (Mock, 2008), flood deposits recovered from an oxbow lake or cave deposit (Muñoz et al., 2018), a tsunami deposit in a coastal sediment core (Atwater et al., 2017), tree-ring records of intense tropical cyclone-related rainfall (Miller et al., 2006; Grissino-Mayer et al., 2010), or drowned forests from
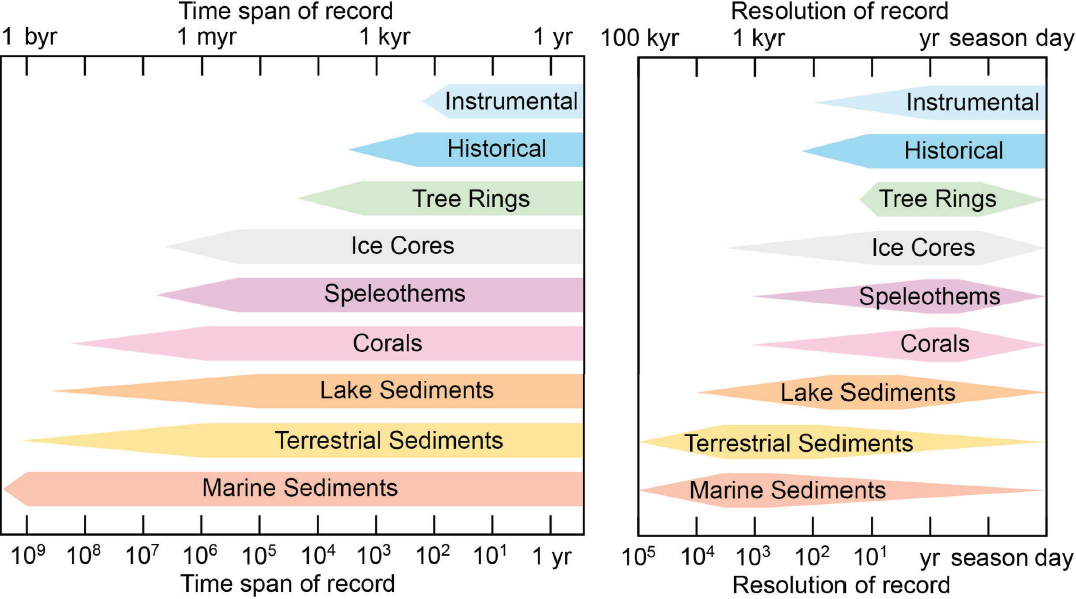
NOTE: byr = billion years; myr = million years; kyr = thousand years. Different natural (proxy) archives record different spans of time and are used to investigate different intervals of Earth history at different temporal resolution. The taper of each colored interval represents diminishing use or continuity of each record.
SOURCE: Committee generated.

NOTE: This figure shows (above) how a single type of extreme event, wildfire in this example, can be recorded in myriad different natural archives, and (below) how a single natural archive, tree rings in this example, can record myriad extreme events.
SOURCE: National Academies Press.
| Event Type | Ice Cores | Terrestrial Sediments (Lakes and Wetlands) | Tree Rings | Marine Sediments | Speleothems | Corals |
|---|---|---|---|---|---|---|
| Volcanic eruption | Sulfate spikes, tephraa | Tephra layersb | Growth anomalies, tree mortality, geochemistryc | Tephra layersd | Trace elements,e ash laminaef | Geochemical anomalies, growth band anomaliesg |
| Earthquake | n/a | Lacustrine sediment gravity flow deposits, soft-sediment deformationh | Growth anomalies, tree mortalityi | Seismites, j sediment gravity flow depositsk | U/Th dating of breakagel | Dating uplifted coralsm |
| Drought | δ18O,n dusto | Microfossil assemblage changes, sedimentology, isotopic signaturesp | Ring width, wood anatomy, stable isotopesq | Microfossil community changesr | O, Ca, and Sr isotopes; trace elements; fluid inclusion isotopic compositionss | δ18O, Sr/Ca ratiost |
| Wildfire | Black carbon, ammoniumu | Charcoal particles/layer, organic moleculesv | Fire scars, wood anatomy, forest age structurew | Charcoal particles/layer, organic moleculesx | Biomolecules, trace elementsy | δ18O, δ13Cz |
| Tsunami | n/a | Clastic layers, marine microfossils, sedimentary structuresaa | Tree mortality, growth anomaliesab | Sediment gravity flow depositsac | Growth hiatuses, fabric changesad | U-series dating over wash depositsae |
| Flood | n/a | Slackwater deposits, lacustrine sediment gravity flow depositsaf | Growth suppression, wood anatomy, tree mortalityag | Diatoms, productivity shifts, sediment gravity flow depositsah | Detritus coatings, magnetic microscopy, fabric changesai | Luminescent bandingaj |
| Event Type | Ice Cores | Terrestrial Sediments (Lakes and Wetlands) | Tree Rings | Marine Sediments | Speleothems | Corals |
|---|---|---|---|---|---|---|
| Temperature extremes | δ18O ak | Biomarkers,al algal pigmentsam | Wood density, wood anatomy, ring widthan | Microfossil assemblages, shell geochemistry Mg/Caao | Fluid inclusion microthermometry and fluid isotopic compositions, noble gas concentrations, clumped isotopesap | Sr/Ca, δ18O, band densityaq |
| Terrestrial landslides | n/a | Tree mortality;ar massive beds, grain-size shiftsas | Growth anomalies, damage scars, reaction wood, tree mortalityat | n/a | Growth interruptions from hydrologic shiftsau | n/a |
| Submarine landslides | n/a | n/a | n/a | Slump structures, chaotic bedding, mass transport depositsav | n/a | n/a |
| Storms (e.g., hurricanes, nor’easters, atmospheric rivers) | Isotopic signaturesaw | Overwash deposits, graded beddingax | δ18O, tree mortality, growth anomaliesay | Storm beds, shell layersaz | δ18O shifts from rainfall eventsba | Dating overwashed coralsbb |
NOTE: This table focuses on instrumental and proxy records and does not include historical data from written and oral sources, including Indigenous knowledge systems. Please see the listed references for definitions and details of scientific symbology.
cPearson et al., 2005; Salzer and Hughes, 2007; Oppenheimer et al., 2017.
lKagan et al., 2005; Braun et al., 2010; Gribovszki et al., 2020.
pLaird et al., 2003; Nelson et al., 2011.
qCook et al., 1999; Treydte et al., 2007.
sCarolin et al., 2019; de Wet et al., 2021; Wortham et al., 2022; Kaushal et al., 2024.
vWhitlock and Larsen, 2001; Denis et al., 2012.
xPatterson et al., 1987; Scott, 2000.
yCampbell et al., 2023.; Kaushal et al., 2024; Smolen et al., 2025.
aaDawson and Stewart, 2007; Morton et al., 2007; Kempf et al., 2017.
abJacoby et al., 1997; Yamaguchi et al., 1997.
acDawson and Stewart, 2007; Morton et al., 2007.
agBallesteros-Cánovas et al., 2015; Meko and Therrel, 2020.
aiZhang et al., 2017; Edwards et al., 2021; Heeter et al., 2023.
anZhang et al., 2017; Edwards et al., 2021; Heeter et al., 2023.
asStoffel and Bollschweiler, 2008.
atStoffel and Bollschweiler, 2008.
awLawrence and Gedzelman, 2003.
ayRodgers et al., 2006; Lewis et al., 2011; Gaglioti et al., 2019.
baFleitmann et al., 2003; Frappier et al., 2014; Wendt et al., 2019; Kluge et al., 2023.
SOURCE: Committee generated.
major earthquakes (Jacoby et al., 1995). Age determinations for Tier 1 data and the events they record can be highly precise, i.e., identified to the year and occasionally the season. Tier 1 data extend our direct observational record of extreme events and can often be directly used in analyses that seek to understand changes in the frequency and relative magnitude of these events over time.
Tier 2—Time-Averaged Indicators of Frequency and Magnitude
Some archives have relatively low temporal resolution, such as sediment deposits that have been mixed during deposition, requiring a greater level of expert interpretation. The depth of mixing can obscure the spatial and temporal fidelity of the archive represented in the deposit but may not erase it completely. Even when annual or individual short-duration events typically cannot be resolved, these records can still provide information about longer-term shifts in the average frequency of storms and other extreme events over centuries or millennia (Maupin et al., 2021; Sun et al., 2021; Bhattacharya et al., 2022, 2023). They may also provide insight into the governing processes of disruption relative to the mean state.
Thus, rather than recording specific events as with Tier 1 data, Tier 2 data provide information about changes in the frequency and magnitude of extreme events averaged over time. For example, coastal sediments from Vieques, Puerto Rico, show that hurricane activity has intensified over the last 250 years after a relatively quiescent millennium, likely tied to shifts in strength of the El Niño–Southern Oscillation and the west African monsoon (Donnelly and Woodruff, 2007). In another example, shifts in the chemistry of lake sediments from northern California on the timescale of centuries
reflect changes in the number and intensity of atmospheric rivers within a particular time window but do not resolve individual storm events (Knight et al., 2024; see Flooding and Drought in the Western United States below).
Tier 3—Large-Scale Environmental Conditions
Tier 3 data provide information on past environmental variables such as sea-surface temperature, atmospheric carbon dioxide concentrations, ecosystem composition (e.g., inferred from pollen data), and volcanic aerosol loadings. These are records of variables that do not directly reflect extreme events themselves. However, these records support efforts to investigate the processes and drivers that alter the frequency, severity, and spatial distribution of extreme events. For example, Tier 3 data can inform the mean climate state of past environments, providing information that is required to accurately model the spatiotemporal distributions of past extreme events. For global-scale Earth-system modeling experiments, which can produce many possible distributions of extreme events given different forcing conditions, Tier 3 data inform the input boundary conditions that are needed to simulate the mean state of the climate system. This in turn is important for evaluating the distribution of extreme events, including their frequency and magnitude.
These comparisons are possible in paleoenvironmental contexts as well and have been used to identify connections between shifts in the frequency and magnitude of extreme events in the southeastern United States over the last 450 years as well as broad-scale shifts in atmospheric circulation (Bregy et al., 2022). In this example, tree-ring-based estimates of hurricane-related precipitation (Tier 2 data) were compared with various records of Tier 3 data representing different potentially causal variables to show an influence of North Atlantic sea-surface temperatures on decadal changes in the amount of hurricane-influenced precipitation in the southeastern United States.
Conclusion 2-1: Paleoenvironmental data provide crucial insight into extreme events by extending the observational records of their occurrence, frequency, and variation to time periods beyond the limited range of direct instrumental observation and by clarifying the drivers that shape extreme events. Each tier offers a distinct but valuable perspective for understanding past extreme events.
EXAMPLES OF USE OF PALEOENVIRONMENTAL INFORMATION
Paleoenvironmental data have already shown remarkable usefulness in helping communities and policy makers understand societally relevant hazards. This section provides illustrative examples in which the use of paleoenvironmental data goes beyond simply advancing science and contributes to societal adaptation, planning, and risk management from extreme events.
Flooding and Drought in the Western United States
Long-term hydrological extremes, such as decade-scale droughts and pluvials (extended wet periods), are among the most pervasive hazards faced by society. Heavy, sustained precipitation can lead to flooding, landslides, public health challenges, and severe infrastructure and ecosystem damage (Kundzewicz et al., 2014; O’Gorman, 2015; Exum et al., 2018; Corringham et al., 2019). Multiyear drought can strain water resources, power generation, navigation, and agricultural production—thus leading to famine. Decade-scale droughts of the 1930s (the Dust Bowl) and 1950s fundamentally altered U.S. population patterns, agricultural practices, and water resources planning (McLeman et al., 2014).
Paleoenvironmental data have provided particularly important perspectives on flooding in California. Historical accounts describing large-scale flooding during the winter of 1861–1862 of the sort that has not been experienced since led to the development of the ARkStorm scenario (with the AR recognizing the importance of atmospheric rivers for West Coast flooding), a tool used by scientists and policy makers to assess the impact of a 1,000-year flood on the West Coast of the United States (Huang and Swain, 2022). The ARkStorm scenario has been adopted by federal agencies to improve flood mapping along the West Coast and improve emergency planning. For example, the Federal Emergency Management Agency (FEMA), the U.S. Geological Survey (USGS), and the Ventura County Public Works Agency used ARkStorm to improve the county’s emergency response planning and mitigation for future flooding (Hosseinipour et al., 2013).
While ARkStorm has been a useful and multiagency tool, it is not perfect. In particular, proxy data from marine and lake sediments, which can preserve layers from distinct storm events or periods of increased storminess (Sabatier et al., 2022; see Figure 2-3), suggest that the ARkStorm scenario could underestimate the magnitude of potential extreme precipitation in California (Du et al., 2018; Kirby et al., 2024). Similarly, lake sediment proxy data reveal periods over the last several thousand years
that experienced more extreme precipitation than in instrumental records (Knight et al., 2024). Additionally, speleothem records from California with high temporal resolution show that past periods of extreme precipitation were also associated with decades of drought, referred to as climate “whiplash” (de Wet et al., 2021; Burstyn et al., 2025; Swain et al., 2025). By incorporating more varied paleoenvironmental data, the ARkStorm scenario could be better calibrated to potential flooding scenarios in California. These examples, along with other similar efforts (Tingstad et al., 2014; Gupta et al., 2023), demonstrate the value of paleoenvironmental information for extreme-event planning and preparedness.
Paleoenvironmental data also have provided crucial information on long-term drought in the western United States. Reconstructions of past hydrological conditions from tree-ring proxies have revealed droughts more severe (megadroughts) than those observed in the mid-twentieth century (Cook et al., 2004, 2016). While past megadroughts were likely the result of precipitation deficits driven by natural climate variability (Coats et al., 2016b; Ault et al., 2018; Carrillo et al., 2022), more recent droughts in the western United States have likely been driven by precipitation deficits coupled to nonstationarity in the climate system (Williams et al., 2020, 2022). Tree-ring data are being increasingly adopted by planners and managers to understand and mitigate the effects of drought, especially in the U.S. West (Rice et al., 2009; Woodhouse et al., 2016). Tree-ring proxy records of past Colorado River flow demonstrate that extremely low flows that have occurred over the past 1,200 years would be devastating if they occurred today (Stockton and Jacoby, 1976; Woodhouse et al., 2006; Meko et al., 2007; NRC, 2007; Woodhouse et al., 2010). The U.S. Bureau of Reclamation has incorporated these data into Colorado River Basin management (Barnett and Pierce, 2009; Rajagopalan et al., 2009; Meko et al., 2012). Similarly, the Salt River Project and Denver Water (major water utilities in Arizona and Colorado, respectively) have supported tree-ring studies on past hydroclimates and directly used the results within their resource planning and management frameworks (Woodhouse and Lukas, 2006; Phillips et al., 2009; Patrick, 2018).
Earthquake-Induced Tsunami Risk: Cascadia and the Caribbean
Earthquakes and the series of events that may immediately follow them, such as fires, landslides, tsunamis, land subsidence, and flooding, are among the most deadly and costly natural hazards and are estimated to cost the United States over $14.7 billion annually (FEMA, 2023). While instrumental records provide crucial insight into recent seismic activity, they capture only a fraction of the full range of earthquake activity over geologic
time. Many regions face the greatest risk from large but infrequent events that have not occurred since the advent of seismic monitoring in the early twentieth century.
Cascadia Subduction Zone: Integration of a Diversity of Paleoenvironmental Records
The Cascadia region, extending from northern California to British Columbia, is one of the areas of highest earthquake risk in the United States (Petersen et al., 2024). Our understanding of the region’s most devastating recent event from January 1700 and of other potential for future hazards comes from integrating instrumental and paleoenvironmental records. Satake et al. (1996) noted that oral histories from Pacific Northwest tribes who describe shaking and entire villages sinking beneath the waves (from coseismic subsidence), coupled with Japanese records of a major Pacific tsunami, helped pinpoint the timing and extent. An earthquake of approximately magnitude 9 is required to produce such effects (Atwater et al., 2005), placing the 1700 Cascadia earthquake among the largest in recorded history.
Extensive paleoenvironmental data further detail the earthquake and tsunami’s extent and impact. Forests of dead trees along the Pacific Northwest coastline killed by inundation of saltwater have been dated with dendrochronology methods as occurring in the winter of 1699–1700 (see Figure 2-5; Jacoby et al., 1997; Yamaguchi et al., 1997). Terrestrial and lake sediments found kilometers inland from the coast and dated to 1700 contain tsunami sand deposits and marine microfossils (Kelsey et al., 2002, 2005). Lake and marine sediments preserve extensive evidence of mass flow associated with the earthquake (Goldfinger et al., 2012; Brothers et al., 2024) as well as longer records, including other earthquakes from which recurrence intervals can be calculated (Atwater et al., 2014; Walton et al., 2021; Nieminski et al., 2024). These data feed into models of earthquake and tsunami effects (Witter et al, 2013; Melgar et al., 2016), which are then used to generate risk assessment plans.
Much of the Pacific Northwest’s infrastructure was built prior to our modern understanding of the region’s severe earthquake hazard, resulting in seismic codes that were insufficient for the risk and development in areas sensitive to liquefaction, inundation, and subsidence. However, paleoenvironmental data extended the region’s earthquake history and led to significant efforts to retrofit buildings and critical infrastructure as well as to an increased awareness of future hazards and risks (Black et al., 2023;

SOURCE: Taken by Jessie K. Pearl; Pearl and Staisch, 2021.
Dura et al., 2025; Rasanen et al., 2025).1,2,3,4 Furthermore, FEMA and the state governments of Oregon and Washington all use the 1700 Cascadia earthquake and a magnitude 9 event recurrence time frame established by paleoseismology as a primary scenario for major earthquake and tsunami planning (FEMA, 2022; Washington Emergency Management Division, 2023; Oregon Department of Emergency Management, 2025).
___________________
1https://cascadiacopeshub.org/ (accessed December 4, 2025).
2https://www.fema.gov/sites/default/files/documents/fema_region10-seismic-mitigation-showcase-showcase-portland.pdf (accessed December 4, 2025).
3https://depts.washington.edu/trac/bulkdisk/pdf/908.1.pdf (accessed December 4, 2025).
4https://www.clarkcountytoday.com/news/5-1-billion-to-repair-replace-all-seismically-vulnerable-bridges-in-oregon-vs-up-to-5-billion-for-interstate-bridge (accessed December 4, 2025).
The Caribbean
The Caribbean also has active tectonics that could potentially cause extreme earthquakes and tsunamis (Mann and Burke, 1984; Mercado-Irizarry and Liu, 2006; Zimmerman et al., 2022). Written records documenting their extent (e.g., Poey, 1857; ten Brink et al., 2011), combined with paleoenvironmental data of coral and sedimentary deposits on land (Atwater et al., 2017) and in the ocean (Leslie and Mann, 2016), reveal events that would be catastrophic if they occurred today. In the late 2000s, a collaboration brought together local authorities from the British Virgin Islands Department of Disaster Management (DDM), USGS geologists, and academic researchers to study tsunami deposits on the island of Anegada in order to characterize the island’s tsunami hazard (McCarthy, 2018). As a result of their findings, the DDM updated its plans and obtained a Tsunami-Ready designation from the National Oceanic and Atmospheric Administration (NOAA) and the United Nations Educational, Scientific and Cultural Organization (UNESCO) for the British Virgin Islands in 2014.5 This and subsequent work (Cordrie et al., 2022; Wei et al., 2024) led to the selection of this area for a major tsunami simulation for the 2024 CARIBE WAVE scenario (Maisonet Gonzalez and von Hillebrandt-Andrade, 2024)—an annual large-scale UNESCO/NOAA tsunami-preparedness exercise.
Mississippi River Valley Flooding
Over the course of American history, flooding has caused billions of dollars in agricultural losses and damage to infrastructure as well as the losses of tens of thousands of lives (Cartwright, 2005). Recent flooding in North Carolina caused by Hurricane Helene in September 2024 and flash flooding on the Guadalupe River in Texas in July 2025 showcase the continued importance of accurate risk assessment and warning systems. Flooding on the Mississippi River, such as in 1993 and 2011, can have particularly far-reaching effects, as approximately $400 billion of annual economic activity relies on this river (UMRBA, 2016; American Rivers, 2022). The devastating Great Mississippi Flood of 1927 caused at least 500 deaths, left hundreds of thousands homeless, and resulted in federal legislation focused on controlling and mitigating the effects of flooding (Henry, 1928; Smith and Baeck, 2015).
Floodplain management, flood mitigation plans, and levee designs can be informed by paleoenvironmental records. Some river gauge stations on the Mississippi have only 20 to 40 years of reliable flood data (Reinders and Muñoz, 2021). Critical infrastructure, such as dams, are often designed based on the probable maximum flood (PMF), i.e., the “largest flood that
___________________
5https://www.weather.gov/itic-car/preparedness (accessed February 23, 2026).
can be reasonably expected to occur at a given site” (England, 2011; Beauchamp et al., 2013; Gangrade et al., 2018; Turner, 2022). The PMF, and the related concept of probable maximum precipitation (PMP), are typically considered as physical upper limits, but that concept now is being revised (NASEM, 2024). For floodplain engineering decisions, choosing an appropriate “design flood” requires quantifying the probability of floods of differing magnitudes, which is particularly difficult for the rare large floods seen in instrumental and written records, especially given the nonstationarity of the climate system as well as long-term changes in human-built infrastructure (Milly et al., 2008).
Paleoenvironmental information is the only way to extend our knowledge past the instrumental era and capture events that occurred in prior centuries, or even prior millennia. Early paleoflood studies focused on rivers in bedrock canyons (Hosking and Wallis, 1986; Baker, 1987), but the field now incorporates sediment records from diverse settings as well as tree-ring data and cave deposits (Frappier et al., 2014; Muñoz et al., 2019; Nguyen et al., 2022; Wilhelm et al., 2022). Paleoflood reconstructions from coarse-grained flood deposits in lakes provide critical constraints on the probability of large Mississippi flooding events and help establish the design flood value (see Figure 2-6; Sangal and Biswas, 1970; Hosking and Wallis, 1986; England et al., 2003; Reinders and Muñoz, 2021). Paleoflood records also have helped show that river engineering—in particular, artificial channelization by levees, revetments, and cutoffs—has contributed to increased flood magnitudes in recent decades (Muñoz et al., 2018).
As a result of these scientific insights, paleoflood evidence is recommended in floodplain management and FEMA floodplain studies (England et al., 2018) and is actively used by the U.S. Army Corps of Engineers (USACE) to evaluate how to best maintain and update infrastructure and operations on American rivers (Raff, 2013; USACE, 2020). In addition, USGS has developed extensive guidance on the acquisition and analysis of paleoflood data and how to incorporate the information into flood hazard assessments (Harden et al., 2021). For example, a USGS study in the Black Hills of South Dakota was initiated to improve transportation infrastructure (e.g., roadways) and accommodate an increasing population in the area (Harden et al., 2021). The study incorporated paleoflood data with recent stream gauge data to show that floods comparable to a particularly hazardous 1972 flood (from Spring Creek, Rapid Creek, Boxelder Creek, and Elk Creek; Harden et al., 2011), which had previously been determined to be an outlier based on 60 years of flood gauge data, have actually occurred multiple times over the past 2,000 years. The inclusion of these data has reduced the uncertainty around large-magnitude events in this region (Harden et al., 2021).

NOTE: Panel (a) depicts peak annual discharge of the Mississippi River at Vicksburg, while (b) shows the flood levels and their associated return period calculated before (black line) and after (red line) incorporating paleoflood data. The inclusion of paleoenvironmental data significantly decreased the uncertainty in the estimates of the return period.
SOURCE: Reinders and Muñoz, 2021. CC BY-NC-ND 4.0.
East Coast Hurricanes
Tropical cyclones, termed hurricanes or typhoons depending on the region, are among the most damaging natural hazards worldwide. Official U.S. data show that hurricanes result in approximately 24 direct fatalities per year on average,6 although those numbers do not include deaths related to flooding, storm surge, inland inundation, or long-term health consequences (Young and Hsiang, 2024). Economic losses from tropical cyclones averaged $34 billion annually from 1980 to the present, rising to $189 billion per year since 2005.7 With roughly 40 percent of the U.S. population living in coastal counties, exposure and vulnerability to hurricane-related impacts, such as storm surges and coastal flooding, are high (NOAA Office for Coastal Management, 2026). Beyond the physical destruction and loss of life, tropical cyclones threaten public health, especially in densely populated coastal areas (Carstens et al., 2025).
Although tropical cyclones occur annually, a given community may experience only a few events over the course of several decades. The long intervals between major storms can exceed local memory, while rapid population growth and coastal development place more people and assets in harm’s way (Peduzzi et al., 2012). As a result, risk perception can lag behind reality in communities with limited recent experience with extreme events. This is evident in the devastation of historic storms, such as the 1900 Galveston hurricane, which struck a rapidly growing coastal city with no protective infrastructure or experience with severe storm surges and resulted in a massive loss of life.8,9 More recent events such as Hurricane Helene demonstrate that the underestimation of severe inland flooding can lead to loss of life and extensive damage (Amorim et al., 2025).
Understanding long-term hurricane risk requires records that extend beyond the instrumental period. Paleoenvironmental records can help close this gap through a variety of ways. For example, along the U.S. Gulf and Atlantic coasts and in the Caribbean, strong waves and storm surges can mobilize and deposit coastal sediments in otherwise quiescent locations, such as coastal lakes, lagoons, and marshes, creating long-term hurricane records in sediment cores (e.g., Liu and Fearn, 1993, 2000; Donnelly and Woodruf, 2007; Brandon et al., 2013; van Hengstum et al., 2014; Winkler et al., 2020; Yang et al., 2024). Intense water cycling in Atlantic hurricanes affecting the Caribbean, Gulf of Mexico, and eastern United States can leave isotopic traces in rainfall (Lawrence and Gedzelman, 1996; Good
___________________
6https://www.weather.gov/hazstat (accessed January 29, 2026).
7https://www.ncei.noaa.gov/access/billions/ (accessed December 15, 2025).
8https://www.history.com/articles/1900-galveston-hurricane (accessed January 30, 2026).
9https://www.nesdis.noaa.gov/news/the-great-galveston-hurricane (accessed January 30, 2026).
et al., 2014) which can be recorded in speleothems (Frappier et al., 2007; Lases-Hernandez et al., 2020) and tree rings (Miller et al., 2006). In some instances, intense rainfall associated with hurricanes has been detected as luminescent banding in corals from Atlantic and Caribbean reefs (Nyberg et al., 2007).
Two major U.S. databases, HURDAT (Landsea and Franklin, 2013),10 which tracks storm paths and intensity, and SURGEDAT (Needham and Keim, 2012),11 which documents storm-surge events along the U.S. coastline, are crucial foundations for forecasting and preparedness. Yet the data in both begin in the late nineteenth century, leaving centuries and even millennia of potentially relevant storm history undocumented. The Paleo-HURDAT database of paleohurricane records12 is intended to help advance science and inform risk assessment, but the integration of paleoenvironmental records with modern databases is a new area of analysis. Other examples demonstrate how transformative paleohurricane studies can be: e.g., along the Florida gulf coast, inclusion of paleoenvironmental data changed the estimated return period for extreme hurricanes from 400 years to 40 years (Lin et al., 2014). Such findings imply that long-term risk for U.S. Atlantic and Gulf coastal regions is highly uncertain and strongly underestimated by using modern instrumental records alone.
Synthesis of Examples
The case studies presented above are examples where studies of paleoenvironmental records of extreme events were initiated or used by policy makers, regulatory agencies, disaster planners, and other stakeholders to inform their risk assessment, decision-making process, and resiliency planning. Paleoenvironmental data play a crucial role in the scientific understanding of other societally relevant natural hazards and extreme events, such as wildfire, volcanic eruptions, landslides, glacial outburst floods, red tides, and water and natural resource management. In other cases, paleoenvironmental data and methods can be applied to study the effects of human-caused extreme events such as oil spills (e.g., Romero et al., 2015; Allen et al., 2025), industrial pollution (Renberg et al., 2002; McConnell et al., 2018), nuclear disasters (Hirose and Povinec, 2022), and induced seismicity (Keranen and Weingarten, 2018).
Some types of paleoenvironmental data translate readily into decision-relevant terms, such as tree-ring chronologies that extend streamflow records. Others, such as sedimentary paleohurricane evidence, are more
___________________
10https://www.aoml.noaa.gov/hrd/hurdat/Data_Storm.html (accessed November 11, 2025).
11https://surge.climate.lsu.edu/index.html (accessed December 4, 2025).
12https://paleohurdat.whoi.edu/ (accessed November 13, 2025).
difficult to integrate because they offer less control over event timing, magnitude, or location and would require more investment in data collection, modeling, and interdisciplinary interpretation to be widely used in modern hazard assessment and planning. The cases discussed above primarily incorporate Tier 1 or Tier 2 proxy data (events, frequencies, and magnitudes). However, understanding and modeling future extremes will also require the incorporation of Tier 3 information (broad environmental conditions), especially as baseline conditions change in the future.
As the cases above illustrate, paleoenvironmental data allow records to extend into the pre-instrumental period, enabling a more comprehensive understanding of a hazard and its associated risks. As such, developing a comprehensive risk framework requires the coordinated integration of social and economic concerns, environmental parameters, instrumental data, and paleoenvironmental data (supported by federal and academic collaboration), followed by synthesis and translation of those records into actionable information for planners, policy makers, and emergency managers. Only by linking the modern and geologic records can scientists, decision makers, and other concerned parties fully grasp and plan for the true frequency and intensity of the most extreme hazards threatening U.S. communities and infrastructure.
Conclusion 2-2: For some regions and types of extreme events, paleoenvironmental data are already being used effectively to improve understanding, preparedness, and policy making. These measures would not have been possible had they relied on instrumental data alone.
WHAT ORGANIZATIONS USE PALEOENVIRONMENTAL DATA?
These case studies offer examples where paleoenvironmental data have been applied to understanding societally relevant hazards in different regions of the United States. In addition to these examples, paleoenvironmental data are produced and used widely by U.S. government agencies (see Box 2-1). Numerous state and regional entities, such as state geological surveys, departments of natural resources, and emergency management agencies, use or maintain paleoenvironmental data to understand societally relevant hazards. Together, these state and federal agencies, along with universities and nongovernmental organizations, produce critical research and decision-support products that inform understanding, prediction, mitigation, and response to extreme events and the consequences of environmental change. These research products about past extreme events are used by a wide variety of stakeholders, including other researchers, insurance companies, state and local agencies, businesses, and property owners.
BOX 2-1
U.S. Federal Agencies that Support Collection of, Provide Access to, and Use Paleoenvironmental Data
Several U.S. government agencies develop and/or use paleoenvironmental data to better understand extreme events.a These data can place environmental change into a longer-term context that enhances understanding of the frequency and severity of extreme events and informs resource management and policy decisions.
The U.S. Geological Survey (USGS) leads efforts in Earth system science, paleoenvironmental and paleoclimate reconstruction, and geohazard analysis, including of earthquakes, floods, and volcanic eruptions and their consequent debris flows and landslides. It maintains large and diverse collections of geologic, paleoenvironmental, and environmental samples. A core part of its mission is to bring together field observations and collections, laboratory analyses, and physics-based models to understand how landscapes, ecosystems, and hazards evolve through time. These data are essential for contextualizing and assessing geohazard risks to and vulnerabilities of communities and infrastructure.
The National Oceanic and Atmospheric Administration (NOAA) provides a primary archive for site-level paleoclimate proxy data and gridded paleoclimate reconstructionsb and uses these data to extend weather and climate records beyond the instrumental era to inform models of the Earth system that simulate changes in the statistics of hurricanes, droughts, floods, and other extreme events. NOAA collaborates with USGS on many topics at the weather–water–climate–ecosystem interface, such as streamflow and flood reconstructions.
The National Science Foundation (NSF) funds fundamental research on the collection, interpretation, and integration of paleoenvironmental data to understand the processes that govern the Earth’s evolution and past environmental change.
The U.S. Army Corps of Engineers (USACE) gathers data about past large flood and storm events, including paleoflood evidence in the geologic record, and uses these data to design and manage civil infrastructure to withstand extreme events and ensure flood control and coastal protection.
The Bureau of Ocean Energy Management (BOEM) analyzes geohazard records for evidence of submarine landslides, seafloor fault activity, gas seeps, and past sea-level fluctuations to guide safe offshore energy and mineral development.
The Environmental Protection Agency (EPA) uses paleoecological records to establish ecological baselines that enhance the assessment of long-term environmental health and to guide management efforts.
The U.S. Fish and Wildlife Service (FWS) integrates paleoenvironmental evidence—such as records of historical wetland conditions; long-term coastal change, including sea-level rise; and ecological changes that affect species habitats—to understand inundation and coastal resilience and to guide restoration, management, and conservation.
The U.S. Forest Service (USFS) uses records of past fire history and ecosystem change to understand the fire regimes in forest ecosystems and the sensitivity of forest ecosystems and fire regimes to changing climates.
The Bureau of Reclamation (USBR) uses tree-ring data and paleohydrologic information to estimate annual streamflows, droughts, and sensitivities to drought extremes for water supply, and it collects and uses paleoflood data to estimate extreme floods for dam safety risk analysis.
__________________
a This list is not exhaustive of all the agencies that develop or use paleoenvironmental data.
b See https://www.ncei.noaa.gov/products/paleoclimatology/climate-reconstruction (accessed December 4, 2025).


