Developing a Guide for Estimating Benefits of Closing Gaps in Active Transportation Networks (2026)
Chapter: 2 Research Approach
Chapter 2. Research Approach
The research team utilized a scan of applied methods, interviews, practical experience, and original research to understanding the current best practices for estimating the benefits of closing gaps in active transportation networks. The work was organized into four phases, culminating in the development of an approachable user guide in Phase IV. The specific approaches planned for each phase are overviewed in this chapter.
Phase I: Exploration
Research Objective: Gain an understanding of the existing methods of quantifying active transportation gap closure benefits, and develop a typology of gaps.
Scan of Applied Methods from Research and Practice
This task included a rapid scan of the available, applied methods of (1) identifying, understanding, and categorizing gaps in active transportation networks; and (2) evaluating and estimating the economic, health, and social benefits of closing those gaps. We drew upon our extensive experience on these topics and supplemented that experience by conducting searches for new methods and recent applications of older methods. Our search included methods and applications from the US and other countries. This broad approach was appropriate as several commonly used methods for measuring benefits, such as the Health Economic Assessment Tool (HEAT) and the Integrated Transport and Health Impact Model (ITHIM), have originated outside the US. Additionally, as part of this scan, we inventoried nationally available datasets and data providers that can assist in identifying active network gaps or providing inputs to benefit estimation methods to provide supplementary guidance for appendixes to be developed in Phase IV.
For the scan of network gap methods, the research team started with the methods included in the FHWA Guidebook for Measuring Multimodal Network Connectivity and the results of the pilot grant program that applied that guidebook. Our scan focused on distinguishing methods that measure network connectivity from methods that identify and characterize gaps in the network. The scan of benefits methods started with methods that estimate changes in active transportation behavior, focusing on walking and bicycling. These methods often provide key inputs to methods that estimate benefits such as reduced emissions and improved health and economic outcomes. They can range from activity-based models to proportional allocation methods. The scan also identified methods of estimating benefits related to safety, health, economy, emissions, mobility and accessibility, and other social benefits.
For both network gap and benefit quantification methods, the scan identified the following:
- Modal applicability (bicycle, pedestrian, micromobility, etc.)
- Consideration of ADA accessibility
- Capacity level, including data needs and level of technical expertise needed for implementation
- Advantages and considerations, including applicability in different contexts/for different user groups
- Recent applications in different contexts
- Applicability to utilitarian vs. recreational facility use
Additional considerations for the benefits methods included the following:
- Network effects: Whether and how the method accounts for the difference between simply expanding a network and closing a particular type of gap. For example, adding a quarter-mile protected bike lane that “unlocks” several miles of disconnected facilities should have a different effect on behavior than adding the same length and type of facility at the outer edge of a network.
- Benefit accrual: Whether the method accounts for benefits accruing to existing users of the (now improved) network. For example, an improved route option in a busy active travel corridor will reduce the generalized cost of travel for existing trips, in addition to potentially drawing new users.
- Overlap management: How measures of benefits overlap between categories. Depending on how different benefit categories are captured, care has to be taken to avoid inadvertently double-counting. For instance, when travel benefits are derived from choice models, some portion of health benefits and route safety are likely considered in individual decisions to walk or bike, and this portion would need to be subtracted from total social benefits of public health and safety calculated separately.
- Benefit timing: Whether and how the method considers and accounts for the timing of benefits.
Development of Active Transportation Network Gap Typologies
The task of analyzing gaps in active transportation networks and calculating the benefits of projects to close these gaps begins with the identification of different types of network gaps. Table 1 illustrates potential factors in analyzing gap typologies. The distinct values in each factor group can be mixed and matched with the values of other factor groups to create many permutations of gap typologies. Part of the task is to expand or contract this list of dimensions and values, considering both the importance and impact of a given type, as well as the data availability on a broad basis to enable analysis of that type. It may be appropriate to include factors and values known to be important even if, in most contexts, the data and resources available will preclude identifying or analyzing that type. The task here is to provide the conceptual understanding of gap typologies, leaving it to Phase II to make choices as to which gap types to identify and analyze in a given context.
The team summarizes the key considerations of these gap typologies and gives examples to illustrate the factors contributing to users’ experience thereof. This highlights the distinctions between typologies as well, such as how some cyclists will choose to travel through a stressful highway on-ramp interchange situation, but more cyclists will choose to traverse a closely parallel bicycle-pedestrian-only bridge across the same highway, or the ability of a pedestrian to traverse a series of stairs between neighborhood streets in a hilly environment and thus have a more direct connection than the circuitous route a cyclist may have to travel to get to the same destination.
Engagement
The identification of gap typologies and scenarios includes an outreach component to a variety of user groups for perspective. Given the short duration of Phase I, we proposed to make use of focus groups and interviews with subject matter experts. The goal of our engagement was twofold: (1) to understand the state of practice in how practitioners, particularly state departments of transportation
Table 1. Potential factions in gap analysis
| Gap Scale |
|
| Barrier Form |
|
| Land-Use Context |
|
| Modes Considered |
|
| Trip Types |
|
| User Types |
|
| Other Factors |
|
(DOT) staff, organize (or would like to organize) their thinking around active transportation network gaps; and (2) how (or if) equity is considered during related planning activities. The interviews and focus groups, which took place between October and December 2022, helped the project team develop a common gap typology framework accessible to all state DOTs that may be used for a variety of purposes:
- Focus Groups: We conducted two focus groups to discuss active transportation gap identification, land-use context, barriers, and trip types. Each focus groups included five to eight participants, with one focus group of practitioners working at the state level and one focus group of practitioners working at the regional/local level.
- Subject matter expert interviews: To augment the focus groups and methods scan, we conducted three interviews with subject matter experts from both transportation and non-transportation sectors. Interviewees were identified through the focus groups and the professional networks of team members. These interviews focused on approaches for gap identification in communities and how the information was used for the benefit of organizations.
Phase II: Product Development
Research Objective: Determine gap types and locations to study, develop benefit estimation methodologies and default values, and calculate benefits for the selected locations.
Identify Gap Types and Locations for Study
The team selected case study locations in a diversity of contexts to analyze. Network gaps were identified according to the typologies developed in Phase I. Not all gap types are present in each case study location, but the locations were selected with the gap typologies in mind so as to have as many of the typologies as possible represented somewhere, ideally in multiple locations. For example, we selected case studies across the rural-to-urban spectrum, with varying topographies, and in different regions. We identified a minimum of five case studies that cover the spectrum of land-use contexts within the typologies.
Relevant data inputs for identifying network gaps included:
- Existing networks (roads by classification, bicycle facilities by classification, sidewalks, and trails)
- ADA curb ramps
- Level of stress assessments on these networks
- Maintenance/state of good repair on these facilities
- Travel volume and trip table data (either from location data products, screen line counts, household travel surveys, or some combination thereof)
- Grade/elevation
- Air quality
- Tree coverage and park locations
- School locations
- Demographics
- Rail stations and major bus hubs
- General land-use classifications
Develop Quantified Estimates of Benefits
Behavioral Response Estimation
Behavioral pathways (see Figure 1) are important because they speak to how different kinds of benefits can accrue.
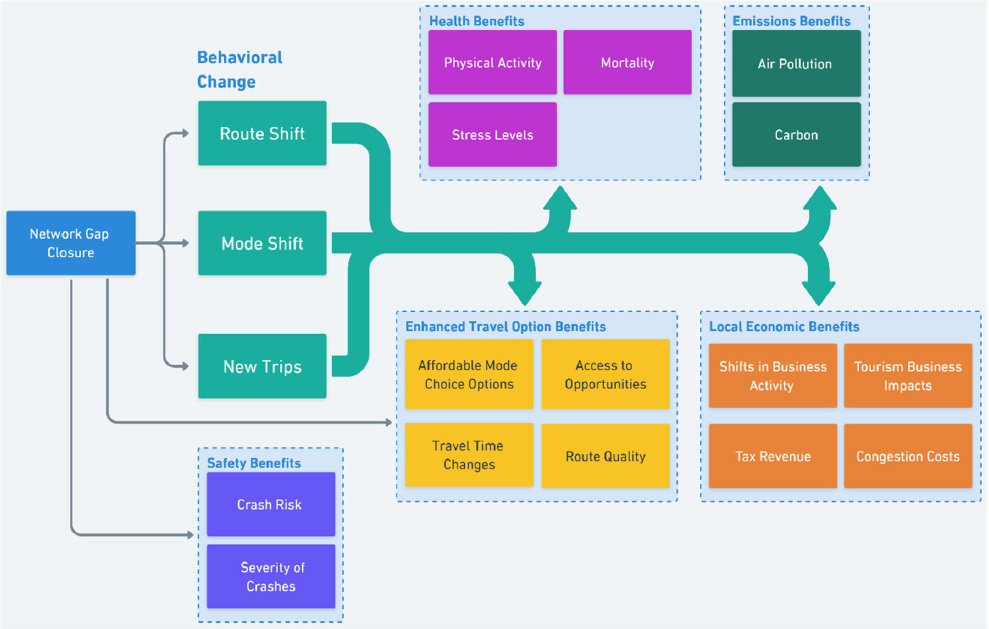
First, when gaps in the active transportation network are filled, existing road users enjoy improved quality of travel even if their behavior does not change. For people walking, bicycling, and rolling, this is realized through reduced risk of crashes and severe crashes, as well as a trip that feels safer and more comfortable. For example, a bicyclist may have been riding in mixed traffic, but once the gap is filled, they use a separated bikeway. Many of the countermeasures that increase safety for active travelers, such as reduced speeds and roadway reallocation, also make streets measurably safer for motorists, so the benefits are broadly shared among all road users. A broader mix of benefits are triggered when the active transportation gap closure induces changes in travel behavior. As referenced in the potential behavior changes column of Figure 1, these include people changing their routes, switching modes, or taking new trips in response to the more complete network. These behavioral pathways are important because they speak to how different kinds of benefits accrue:
- Route shift: Active transportation users may switch from a parallel route to the new gap closure improvement. The new route may be safer and more comfortable. It may provide a faster, more direct option, if they no longer have to detour around the gap.
- Mode shift: People may switch from driving to walking, biking, or transit. The reduction in auto travel can result in reduced air pollution and noise pollution, and these reductions are enjoyed by both active transportation users along the network, as well as by people who live, work, and play
- Activity shift/trip generation: Because there is a safer and more comfortable option now that a network gap has been closed, people may take new trips. For example, they may visit friends more often; make more frequent quick trips to the store; start walking, running, or biking for exercise; or venture out for coffee in the afternoon instead of staying at their desk. Similar to mode shift changes, these new trips bring PA and health benefits. They additionally may generate economic benefits, such as increased expenditures or shifts in business patterns.
in the location. The increase in active travel results in increased physical activity (PA) and reduced burden of chronic disease among people whose modes change.
Accessibility and Connectivity
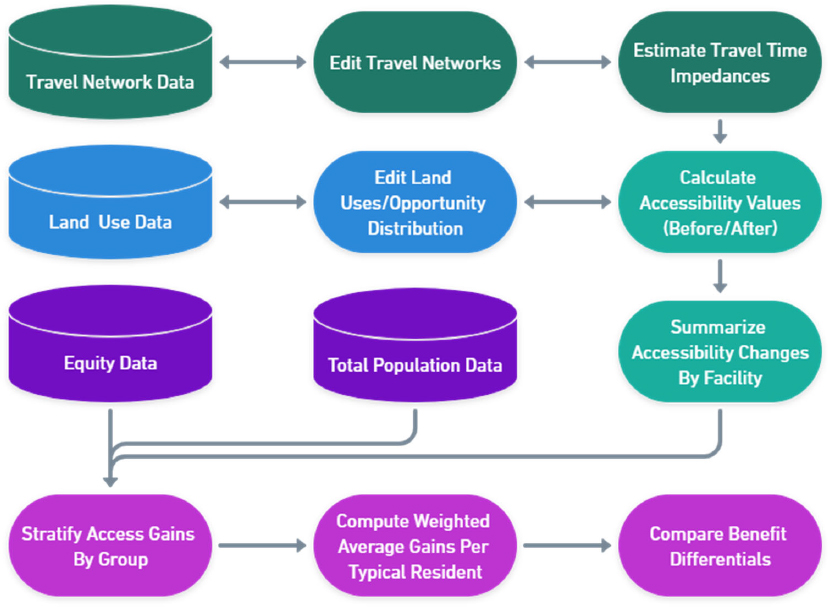
There has been considerable research about approaches to estimating multimodal accessibility and connectivity from a diversity of resources including FHWA Guidebook for Measuring Multimodal Network Connectivity, Transport Access Manual: A Guide for Measuring Connection between People and Places, SSTI’s Measuring Accessibility Guide, and other resources such as Transport Justice: Designing Fair Transportation Systems. These resources highlight that connectivity and access measures can have high utility for estimating transportation demand and identifying who benefits from the changes in access to opportunities that new facilities or changing land uses can provide. One of the challenges to measuring the benefits of active network gap closure impacts on network accessibility is the number of methods that exist for accounting for network quality metrics alongside changes in raw network connectivity. These network quality metrics for active transportation include Oregon Department of Transportation’s (ODOT’s) Pedestrian Level of Comfort or Bicycle Level of Traffic Stress Scores. We identified best practices that can inform guidance on this and whether it can be used to complement other components of benefit estimation (behavior response, land value gains). During product development, we outlined anticipated processes that practitioners could follow to use accessibility and connectivity testing processes to help communicate the benefits of a project and identify who benefits from them. For example, Figure 2 outlines a theoretical framework for how travel networks, land use, and demographic data can be used to strategically measure changes in accessibility as a result of an active gap closure.
Not every practitioner and agency will have the capacity and expertise to employ these methods, but they provide an important evolution of practice that has important implications for both the magnitude of benefits expected from a project and a method to quantify benefit by social group. Our team highlighted case studies applying these approaches for active network gap closures and identified how these complex analysis approaches can inform rules of thumb or adjustment factors for simpler overlay analysis approaches. For communities interested in applying advanced network analysis, we deferred to existing guidance as resources for practitioners or work with other NCHRP research groups advancing those research questions.
Safety Benefits
Safety benefits primarily accrue to existing road users for all modes of transportation. People walking, bicycling, and rolling on the existing network benefit from reduced risk of crashes after safety countermeasures are implemented to close gaps. Many types of gap closure projects, such as roadway reduction or reallocation, also make streets safer for people driving. These benefits can be quantified using crash modification factors (CMFs) and a baseline estimate of crash risk (either crash history or a systemic measurement of risk). Established methods exist for estimating the safety benefit of a transportation project. The method described in USDOT’s 2022 revised BCA guidance uses CMFs from public resources like the CMF Clearinghouse to estimate the number of crashes reduced, by severity, based on a baseline of three to seven years of crash history at the project location. This estimated reduction can be monetized, if desired, using standard values. Despite its ease of implementation and accessible data requirements, the USDOT BCA Guidance’s method has several notable shortcomings.
First, choosing the most appropriate CMFs can be tricky, and for many countermeasures specific to pedestrian and bicyclist safety, there may not be any high-quality CMFs or any applicable CMFs at all. For example, curb extensions are a common treatment to facilitate pedestrian crossings, and they are on the CMF Clearinghouse’s “Most Wanted” list. In the absence of a high-quality CMF for a specific treatment type, DOTs use placeholders adapted from other research; strategies for developing these placeholders or selecting the most appropriate proxies can help bring consistency to this practice until CMFs are developed.
Second, by using crash history as a baseline, this method is retrospective in nature. The safe system approach includes proactive treatment of risk factors, even in locations without a history of severe crashes; projects that aim to proactively address safety risk factors may be undervalued. This is especially important for pedestrian and bicycle crashes, which are statistically rare at any given location, but cumulatively comprise a significant burden to society. Because the perception of risk leads to low exposure in some unsafe locations, paradoxically low numbers of pedestrian and bicycle crashes in network gap locations may also be observed. Underreporting of crashes, especially pedestrian and bicycle crashes, is also widespread, and research shows that these underreporting patterns are non-random, with more underreporting among Black, Indigenous, and people-of-color communities (Edwards & Gutierrez 2023, Lombardi et al. 2022, Sciortino et al. 2005, Younes & Noland 2025).
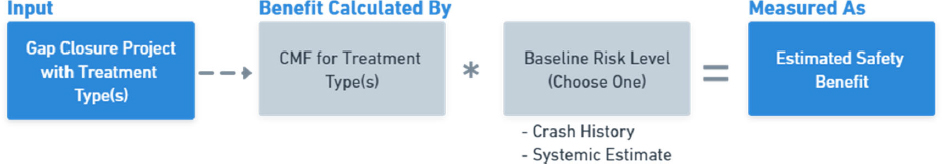
An alternate approach could include an element of systemic safety analysis, so that the baseline risk parameter is derived from latent crash risk, rather than observed crash history. At the highest capacity tier, sophisticated techniques like safety performance functions could be used to generate this systemic risk baseline. Among lower capacity agencies, simple GIS operations like sliding windows analysis can smooth and extend historic crash counts along high crash corridors. Existing safety performance functions could be used to validate the lower capacity methods and estimate simple per-mile baseline proxies based on roadway characteristics or functional class. In this task, our team will adapt the USDOT BCA
Guidance safety methodology to evaluate the benefits of filling active transportation network gaps. We proposed developing a supplemental “systemic baseline” version of the methodology, so that safety benefits can be measured in locations without an observed history of pedestrian or bicycle crashes. This alternate method, shown in Figure 3, will help address practical issues in the standard method that result from relying on crash history alone as the baseline.
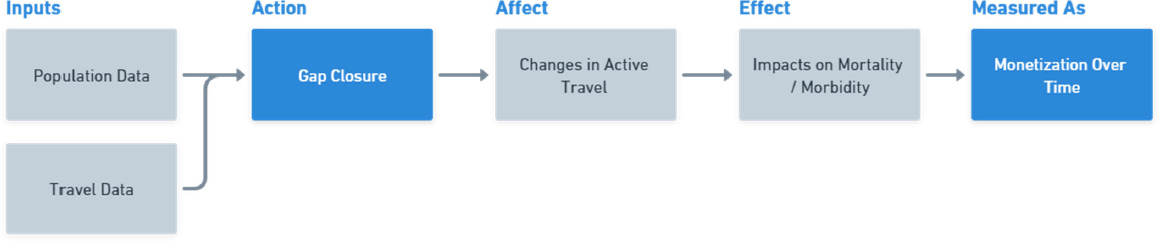
Health Benefits
As shown conceptually in Figure 4, closing active transportation network gaps generates public health benefits primarily through potential increases in PA from active travel. Links between PA and mortality/morbidity are fairly well established, and reductions in disease burden and premature death can be monetized using standard valuation of a statistical life.
Simple rules of thumb may directly apply a multiplier to expected bicycle or walk activity increases. USDOT’s 2022 revised BCA guidance provides a starting point for such multipliers, although only for specific age ranges. More complex health impact assessment (HIA) tools—such as the Health Economic Assessment Tool (HEAT) and the Integrated Transport and Health Impact Modeling (ITHIM) tool—expand on simple multipliers by considering local conditions and different benefit rates by population segment and disease burden. ITHIM, for example, considers a complete disease burden profile when distributing PA impacts over that population to derive more precise health impacts by disease and sociodemographic profiles. Data are available on physical inactivity through the Behavioral Risk Factor Surveillance System for different geographies.
Specifically, we considered medium-complexity options as a way to improve and expand on the simple multipliers currently available. Such options create simplified models calibrated to a local population profile but without the need to link a specific project’s impact to specific population/disease groups. For example, after applying a full HIA tool to a range of project types and contexts for the same local population, simple regression functions have been estimated to calculate expected health benefits directly for a given increase in bicycling or walking, without requiring the underlying, complex HIA tool.
Quantifying health benefits requires at a minimum:
- Expected increase in bicycling or walking activity
- An HIA, HIA-developed function, or a rule of thumb multiplier method to translate increased bicycling or walking PA into reduced mortality, morbidity, or combined disability-adjusted life years
- An economic value of mortality/morbidity/disability-adjusted life years, unless a simplified method estimates dollar benefits directly
- Expert defined assumptions about the timing and discounting of PA uptake and health benefits
Closing gaps in active transportation networks may produce additional health benefits, such as collision avoidance, subjective well-being, out-of-pocket health care cost savings, and emissions reductions. While we considered some of these in other benefit categories (safety, emissions), others are generally small compared with PA benefits. Because of the tremendous value of a healthier population along with the well-covered physical inactivity epidemic in the US, PA benefits are likely to be one of the most impactful outcomes of improved active travel networks. It is imperative to find ways to at least partially capture public health benefits, even where the capability and resources do not exist to enlist full HIAs.
Economic Benefits
Closure of gaps in active travel networks can provide economic benefits through a number of mechanisms:
- Saving active travelers money (through reduced auto operating costs, on-the-clock travel time savings, or reduced crash or health care expenditures), which they can then recycle into the economy through spending on other goods and services
- Saving vehicle drivers money if congestion is reduced due to mode-shifting
- Increasing earnings, to the degree that network improvements make it easier for people to access jobs
- Increasing local business sales, e.g., if there is more pass-by walking or biking traffic
- Increasing property values if people place a premium on neighborhoods with better active travel conditions
- Improved travel options and related changes to travel costs
Emission Benefits
Closure of gaps in active travel networks can reduce criteria air pollutants (such as particulates), and other harmful pollutants such as air toxics. Emission benefits are driven by mode shifts, and specifically, shifts from driving to active travel, as shown in the table that follows, along with examples of data sources and methods for a range of low to high effort.
Table 2. Emission benefits driven by mode shifts
| Key Data Item | Low Effort | Moderate Effort | High Effort |
|---|---|---|---|
| Number of new active trips | Examples from similar facilities/projects | Sketch-plan analysis tools | Location-specific trip modeling/analysis |
| Share who previously traveled by | Average local work trip mode shares from | Average local/regional mode shares from regional travel survey | Location-specific trip modeling/analysis |
| Key Data Item | Low Effort | Moderate Effort | High Effort |
|---|---|---|---|
| personal motor vehicle | American Community Survey | ||
| Average trip length | Average walk and bike trip length from National Household Transportation Survey | Average walk and bike trip length from regional travel survey | Location-specific trip modeling/analysis |
| Emission rate per vehicle-mile | National average rates | Local emission rates from EPA’s Motor Vehicle Emission Simulator (MOVES) runs conducted for other projects | Project-specific MOVES runs using local data/inputs |
| Value of emission reductions | National average value per ton (USDOT BCA Guidance) |
Identifying appropriate emission factors per vehicle-mile can sometimes be a challenge if local agencies have not already developed such factors based on MOVES runs. A national tool such as the Federal Highway Administration’s (FHWA’s) Congestion Mitigation and Air Quality Calculator Toolkit – Bicycle and Pedestrian Improvements is one source for translating changes in active travel into emissions, using national average emission rates.
Emission factors will change over time as vehicles become cleaner and more efficient consistent with federal and state requirements, so emission factors appropriate to a future evaluation year should be used. For projects that are being evaluated for emission benefits well into the future (e.g., 2030 and beyond), it may be important to consider electric vehicle (EV) market penetration. EVs are typically not reflected in MOVES-based emission factors and given the fast-evolving policy and market conditions for electrification, there is no accepted procedure for doing this. However, states, regions, and local agencies are increasingly using policy or market-driven EV forecasts to adjust future vehicle emission rates. The guide developed for this project will provide links to sources of emission rates as well as examples of how adjustments can be made for EVs.
For the purposes of benefit-cost analysis, the benefits of emission reductions can be monetized using values for “damage costs of emissions” stated in USDOT BCA Guidance. Damage costs are based on complex modeling, and it is not expected that project sponsors would want to estimate their own damage costs.
Application of Benefits to Identified Locations
The application of benefits to identified locations was based on identified case studies built on higher capacity estimation approaches identified by the research team and research stakeholders. The identified benefit estimation method developed in Phase II was applied to these case study locations and illustrated the benefit estimation values using the range of approaches from higher capacity to lower capacity. At its simplest form, low-capacity default values were created for different types of gap closure projects and gap closure typologies that can be used to inform benefit estimation. These default values are context
sensitive, and the data used to inform context is limited to publicly available data sources or third-party data that can inform important rules of thumb or estimation approaches.
Phase III: Vetting
Research Objective: Ensure the methods are technically sound and be implemented easily by intended users.
Technical Vetting
To ensure the methods developed in the initial phases were technically sound, we convened a panel of seven experts. Reviewers were selected from a tiered list with primary consideration given to covering each of the main technical topics (behavior change, travel options, health, safety, economic impacts, and emissions). We also elected to include institutional reviewers with technical backgrounds from academia and government. Most of our reviewers had technical expertise in more than one of our topics.
We provided the reviewers with the Phase II Report—augmented with additional technical information that they might need to evaluate the methods—and asked for both written feedback and participation in a two-hour virtual panel meeting to further discuss key feedback topics.
Usability Testing
In addition to presenting sound analysis methods, a technical guide should be accessible to the people who will use it, providing clear, easy-to-use instructions and accompanying narrative and visuals that help explain both the methods and rationale for their use. To help us accomplish this, we invited eight transportation planning practitioners to review various sections of the guide and provide feedback that will be used throughout Phase IV to shape the guide’s look and feel.
The selected reviewers represent regional, state, and federal transportation agencies. While preference was given to practitioners who participated in the Phase I focus groups, other practitioners were invited to participate to represent a variety of technical expertise and agency perspectives. The following agencies were represented in usability testing:
- Multnomah County Health Department, Oregon
- Metropolitan Transportation Commission, San Francisco, California
- Utah Department of Transportation, Utah
- San Diego Association of Governments, San Diego, California
- Washington State Department of Transportation, Washington
- Bureau of Transportation Statistics, United States
- North Carolina Department of Transportation, North Carolina
- Metro, Portland, Oregon
We provided users with the Phase II Report and asked them to review one of the technical methods presented for the guide, and an advanced case study. We also provided the gap analysis process described in Chapter 1 as recommended background reading.
Phase IV: Implementation
Research Objective: The objective of this research is to produce a manual on how to estimate the benefits of closing gaps in active transportation networks.
Develop Guide, Conduct of Research Report, and Implementation Memo
The primary purpose of this task was to develop a practice-ready guide and resource summarizing best practices in measuring the benefits of gap closure in the active transportation network. An implementation memo and this technical report were also developed in this task.
Guide
The Guide was developed to provide DOTs, MPOs, and community practitioners with a clear implementation process for steps from gap identification to communicating final benefits. We drew on work completed in Phases I through III to inform the guide. We envisioned a guide that does several things:
- Defines gaps by typology and context (e.g., economic, health and social characteristics), and how to identify them
- Connects to methods and provides guidelines for quantifying the benefits of gap closure
- Provides direction on method selection based on factors like capacity and step-by-step instructions for use of the concepts and tools described in the guide
- Guidance on considering the costs and impacts alongside benefits
- Approaches to communicating the value of benefit analysis
We focused on creating a guide that is accessible to all users; this will include clear organization and presentation of information in plain language, as well as reliance on graphics, tables, and charts where possible.


