Wolves, Bears, and Their Prey in Alaska: Biological and Social Challenges in Wildlife Management (1997)
Chapter: 5 WOLF AND BEAR MANAGEMENT: EXPERIMENTS AND EVALUATIONS
5
Wolf and Bear Management: Experiments and Evaluations
INTRODUCTION
In addition to many studies on the population ecology of wolves, bears, moose, and caribou, a number of experiments have been conducted in Alaska and elsewhere, in which wolf and/or bear numbers were reduced or their behavior changed, and responses of caribou and/or moose populations were monitored. These control activities have been targeted to specific areas that cover a relatively small part of the state. In most of these experiments, wolves were killed, but some used translocation or diversionary feeding. These experiments provide the best data with which to evaluate the biological basis of control as a management tool to increase ungulate numbers (Theberge and Gauthier 1985; Boutin 1992). In this section, the committee analyzes and evaluates these control experiments.
Although, the primary goal of wolf control and/or bear management in Alaska is to increase the availability of moose and caribou for human harvest, most management actions have not been monitored to directly assess whether, in fact, this goal was achieved. Instead wildlife managers have relied on less-expensive and short-term measurements, such as changes in birth rates (calf:cow ratios) or changes in adult population sizes, to assess the results of predator management experiments. The following cases are presented in order from the most to the least direct measurements of whether predator management resulted in increased human harvest of moose or caribou (table 5.1; figure 5.1).
TABLE 5.1 Predator Reductions Discussed in Chapter 5
| Duration (Years) |
|
|
Method of Predator Reduction* | Wolves | Bears | Prey Response Measured |
Air-assisted | |||
East-central AK (GMU 20A)a | 7 | Not done | Calf survival, adult mortality |
Finlayson, Yukonb | 6 | Not done | Calf:cow ratios, adult mortality, population densities, hunting success |
Southwest, Yukon c | 5 | 5 | Population densities, survival rates |
Aishihik, Yukon d | 4 | Not done | Calf:cow ratios |
Northern BC e | 10† | Not done | Calf:cow ratios; population densities |
Quebec f | 4 | 3 | Calf:cow ratios |
East-central AK (GMU 20E) g | 3 | Not done | Calf:cow ratios; calf mortality |
South-central AK (GMU 13) h | 3 ‡ | 1 | Calf:cow ratios |
Ground-based | |||
Kenai Peninsula, AK i | 3 | Not done | Population densities |
Vancouver Island, BC j | 4 | Not done | Hunting success |
East-central Saskatchewan k | Not done | 1.1 (different areas) | Calf:cow ratios |
* See text for explanation of grouping by methods. Several experiments involved multiple periods of predator reduction. Primary sources: a, Boertje and others 1995; b, Farnell and Hayes 1992; Farnell and others, in preparation; Larsen and Ward 1995; c, Larson and others 1989a, 1989b, Hayes and others 1991; d, Hayes 1992, Yukon Fish and Wildlife Branch 1994, 1996: e, Bergerud 1990, Elliott 1986a, 1986b, 1989; f, Crête and Jolicoeur 1987; g, Gasaway and others 1992; h, Ballard 1991; i, Peterson and others 1984; j, Archibald and others 1991; k, Stewart and others 1985. † The areas in which wolf populations were reduced spanned a 10-year period, but was not done in the same place every year. ‡ A combined aerial shooting and poisoning program is also described under this case study. | |||
AIR-ASSISTED WOLF CONTROL
East-central Alaska (Delta, GMU 20A)
The best documented and most successful example of wolf control in Alaska was conducted from 1976 to 1982 in Game Management Unit 20A (GMU 20A), south of Fairbanks. The 17,000 km2 study area included 7300 km2 in the poorly drained lowlands of the Tanana Flats and 9700 km2 to the south in the foothills
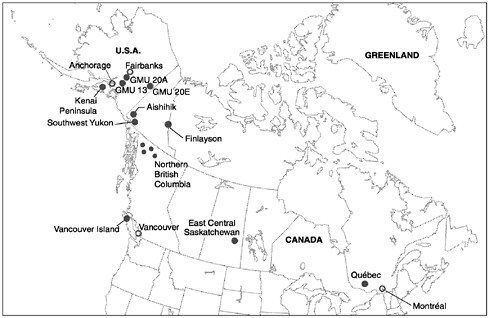
FIGURE 5.1 Locations of case studies discussed in this chapter are indicated by gray dots. Predator control in the northern British Columbia case study was carried out over several distinct areas, as indicated by the 4 smaller dots.
and mountains of the Alaska Range (Gasaway and others 1983; Boertje and others 1995; figure 5.2).
Before wolf control was begun in 1976, the average age of the moose population was very low. Brown and black bear populations were judged to be low. Between 1965 and 1975, moose and the Delta caribou herd in this area were overharvested by humans (Gasaway and others 1983). A record snowfall in the winter of 1970–71 had caused substantial mortality of moose. Local trappers were taking approximately 20% of the wolves annually, but this harvest was not enough to reduce the population of wolves in the area. The caribou hunting season was closed in beginning in 1973.
From 1976 until 1982, a 7-year air-assisted wolf control program was conducted by both ADFG staff and private hunters. Each year during this period, the wolf population was reduced to 55–80% below pre-control numbers. Regular harvest of wolves by private trappers continued throughout the period of wolf control. In 1976 there was an estimated 14 wolves per 1000 km2, in 1982 at the end of the control period there was an estimated 8 wolves per 1000 km2.
During the 7 years of wolf control, survival of moose calves and yearlings increased and mortality of adults, especially middle-aged and old adults, declined. The moose population increased from 183 to 481 per 1000 km2, a mean
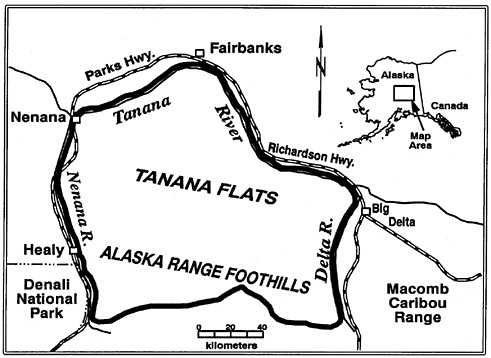
FIGURE 5.2 Study area in interior Alaska (GMU 20A) where wolves were controlled during 7 winters, 1975–76 through 1981–82. Wolves were controlled in a 10,000 km2 portion of the 17,000 km2 study area during winters 1993–94 and 1994–95.
annual rate of increase of 15%. After the wolf control program was terminated, the moose population continued to increase for 12 more years, reaching 1020 moose per 1000 km2 by 1994, a mean annual increase of 5%.
During the period of wolf control (1976–1982), calf survival in the Delta caribou herd increased and adult mortality declined, contributing to an average annual rate of 16% which then continued to increase at 6% for 7 years after wolf control ended (1983–1989). The peak density was 890 caribou per 1000 km 2. The subsequent decline in caribou in the early 1990s coincided with several severe winters that ended the previous 20 years of mild winters. Two adjacent, low-density caribou herds also declined during this period.
By 1985, 3 years after the control programs were ended, wolf numbers had recovered to near precontrol levels in most of the area. After ADFG terminated this wolf control program, private hunters continued to take up to 25% of the autumn wolf population each year. This level of harvest presumably had some impact on the wolf population, even though census data did not reveal a decline in the number of wolves (Peterson and others 1984; Gasaway and others 1992). Human harvest of moose during the 20-year period was restricted to maintain at
least 30 males for every 100 females. Board of Game regulations prohibited the harvesting of female moose. Caribou harvest was kept to loss than 6% during the 20-year period, except for 1983–1986 when it was 11%. With the decline of caribou populations in the early 1990s, legal human harvest of caribou was reduced and then eliminated.
Documentation of the responses of wolves, moose, and caribou in GMU 20A was based on intensive sampling by ADFG personnel and analysis of information from hunter moose harvest reports. Data for wolves were based on aerial surveys; information from local trappers, hunters and pilots, and from tracking radio-collared wolves (Gasaway and others 1992). Estimates of moose abundance were based on data from aerial surveys (Gasaway and others 1992) and estimates of harvest rates. Birth rates of radio-collared female moose and caribou were compared to estimates of birth rates in other surveys. Ten-month-old calves were weighed after they had received immobilizing doses of anesthetics. Estimates of caribou abundance were based on aerial photographs, total aerial searches, and radio-search techniques. Juveniles of known ages were weighed.
Data were also collected from areas where wolf control was not conducted, but they are difficult to interpret. For instance, calf:cow ratios were high for migratory moose that calved in the Tanana Flats (with wolf control), and wintered in the Chena and Salcha areas (no wolf control). But in the Denali, Fortymile, or Tok areas, where wolves were not controlled, calf:cow ratios of moose did not increase in the late 1970s. During this same period, caribou herds in Macomb and Denali were stable.
During and after the 7-year air-assisted wolf control program from 1976 to 1982, moose and caribou populations increased. Further, during the 7 years of wolf control human harvests of moose and caribou were curtailed, and it is difficult to separate the combined effects of wolf control and reduced human harvests. Nevertheless, the positive responses of both moose and caribou lasted longer than in any other control program and no such responses were seen in the untreated areas.
In the winters of 1989–90, 1990–91, and 1992–93, snow reached critical depths and yearling moose survival was low. The growing season in 1992 was particularly short, and no twin moose were reported the following spring. Except for 1992, caribou birth and recruitment were reduced in GMU 20A and in the comparison Denali and Macomb herds. The Delta caribou herd declined from 1989–93 at an annual average rate of 0.78. In contrast, the moose population apparently increased between early winter 1988 and 1994.
During the winters of 1993–94 and 1994–95, a ground-based wolf control program was conducted in the Tanana Flats to determine whether wolf control would reverse the decline of the Delta caribou herd and allow their numbers to increase again. Before control there were 262 wolves in the area. this was reduced by 62% in 1993–94 and by 56% in 1994–1995. The Delta caribou herd appeared to increase in numbers after the winter of 1993–94. However, 2 years of
ground-based wolf control in a 600 km2 area in the early 1990s apparently had no effect on caribou calf:cow ratios.
Finlayson, Yukon Territory
The 14-year Finlayson wolf reduction experiment included 6 years of wolf reductions and 8 years when populations were monitored in the absence of reductions. It is a very important experiment because although it was not conducted with an appropriate experimental design, it provides the best available data to test the two equilibrium or ''predator pit" hypothesis. In addition, wolves were reduced to lower levels for more years than most other experiments and the population ecology and behavior of wolves was studied in detail after control ceased.
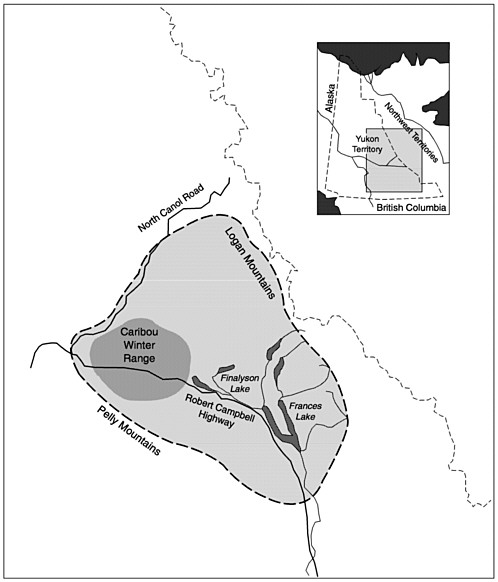
The Finlayson Caribou Herd (FCH) lives on a 23,000 km2 area in the south-central Yukon Territory (figure 5.3). FCH wintered in a complex of hills and small plateaus separated by a several broad, glaciated valleys. The area is typical northern boreal forest with black and white spruce, lodgepole pine, and occasional stands of aspen. The large mammal system includes caribou, moose, 200–300 mountain goats, less than 100 Dall's sheep, a few mule deer, wolves, brown bears, black bears, coyotes, wolverine, lynx, and red fox. Beaver and Arctic ground squirrels were common and the cyclic snowshoe hare populations declined in 1983 and again in 1992. An all-season highway that bisects the FCH winter range facilitates hunting, particularly during the winter when the caribou distribution straddles the road. Another road provides summer and fall access for hunters to the northern portion of the area.
Conditions Before Wolf Reduction
In 1982 the caribou population was crudely estimated to be between 2,000 and 2,500 animals. In October 1982, there were 17 calves/100 cows, a ratio thought to be insufficient to support the estimated harvest of 250 adults per year. In October 1983, a ratio of 34 calves/100 cows was recorded, giving a pre-treatment average of 25.5 calves/100 cows for those two years. In 1982 and 1983, the annual mortality rate of radio-collared adult caribou was 28% (n=5/18). In the winter of 1983, an estimated 215 wolves lived in the study area (9.3/1000 km2) with an average pack size of 9.6 wolves.
Wolf Reduction
Wolves were systematically reduced by aerial shooting in late winter, with an effort to remove entire packs. In the winter of 1983, 49% of the 215 wolves that lived in the study area were shot. Over the next 5 winters, from 80 to 85% of the wolves were shot each year. Of the 454 wolves removed, 77% were shot from
a helicopter. In addition, hunter harvest of caribou was reduced from about 250 per year prior to 1983 to about 25 thereafter.
Response When Wolf Numbers Kept Low
In 1986 there were estimated to be 3073 ± 333 (90% confidence limits) caribou. In 1990, the year following the end of 6 years of wolf control, there were 5950 ± 1055 (90% confidence limits) caribou, an average rate of increase of 18% per year. Mortality rate of radio-collared adult caribou, which was 24% in 1983 after a 49% wolf reduction, decreased further to an average of 11% between 1984 and 1987. The pre-treatment average of 25.5 calves/100 cows almost doubled to 50.2 (42, 50, 45, 55, 47, 62) calves/100 cows during the years of wolf reduction. Two neighboring untreated caribou herds had between 15 and 28 calves/100 cows in 1985 and 1986 when the FCH had 45 and 50 calves/100 cows.
Moose were not the focal prey species of this project and few pre-treatment data are available. Censuses in 2 portions of the treatment area, North Canol (NC) and Frances Lake (FL), were conducted in 1987 during the fourth year of the wolf control program. At that time the moose population was estimated to be 516 in NC and 741 in FL, and there were 67 and 66 calves/100 cows respectively. In 1991, the number of moose had increased to 950 in NC and 1475 in FL for rates of increase of 16% and 18% per year. The number of days it took a hunter to kill a moose decreased from 26 in 1979–1984 to 18 in 1985–1991 in NC. In FL, the number of hunter days required to kill a moose decreased from 31 to 23.
Response When Wolf Control Stopped
Wolves increased from 29 survivors at the end of wolf control (March 1989) to 240 in March 1994, and 260 in 1996, 17% higher than the pre-control level of 215 wolves. The number of packs increased from 7 in 1989 to between 26 and 28 after 1991. Mean number of wolves per pack increased from 4.4 in 1990 to 7.8 in 1994 and 9.3 in 1996; almost identical to the pre-treatment pack size average of 9.6 wolves per pack.
Detailed monitoring of wolf predation rates on moose demonstrated that wolves in small packs had greater kill rates per wolf than wolves in large packs. In addition, wolves were efficient predators when moose were at low densities. Kill rate was density-independent when there were between 250 and 430 moose/1000 km2 for all sizes of wolf packs. This result is important because it demonstrate that in Finlayson study area, when moose densities are low (less than 250 moose/1000 km2 wolves can maintain the population at low densities (estimated to be at 120 moose/1000 km2). Whether or not there is also a high equilibrium remains unknown, but the efficiency of wolf predation suggests it is unlikely for the interior of the Yukon.
After 1989 and the end of wolf control, caribou calves/100 cows gradually
declined from an average of 50.2 when wolves were low to about 44, 32, 20, and 30 in the following 4 years; about the same as in adjacent herds where there was no wolf control. The caribou population decreased from about 5950 ± 1055 to 4550 ± 550 for an average rate of decrease of 5% per year.
A moose census of both NC and FL census areas in 1996 found that the number of calves/100 cows had decreased to 29 and 30 from the 1991 ratios of 52 and 44 respectively. The estimated number of moose in NC had decreased from 1001 in 1991 to 810 in 1996, an average annual rate of decrease of 4%. Similarly, the estimated number of moose in FL decreased from 1475 in 1991 to 1320, an average rate of decrease of 2%.
To summarize, although hunting was reduced during wolf control in Finlayson, the responses of both moose and caribou were clear. The removal of approximately 85% of the wolf population for 6 years and reducing the harvest rate appeared to result in an increase in adult caribou survival, an increase in calves/100 cows of both caribou and moose, and increases of both caribou and moose populations at a rate of approximately 18% per year. Once wolf control ceased, the wolves rapidly increased and pack size recovered in 4 years. Wolf predation rate on moose was independent of moose density, suggesting that a low moose/wolf equilibrium existed. Seven years after wolf control stopped and 3 years after wolves recovered, moose and caribou numbers appeared to be decreasing. This decrease suggests either that a higher equilibrium does not exist in the area, or, if it does exist, it is at a higher density than the ungulates reached during the wolf control years. However, because there was a great increase in mineral exploration in the area in the 1990s, human activity may have prevented moose and caribou from attaining even higher population densities.
Southwest Yukon
In the early 1980s hunter demand for moose in southwestern Yukon exceeded the supply; moose populations either declined or remained stable at low numbers. To assess the effects of brown bear and wolf predation on limiting moose populations, the causes and rates of moose mortality were documented between 1983 and 1987. The effects of hunting, weather, moose reproduction, forage availability, and emigration on moose numbers were also evaluated. The study included 3 experimental wolf reduction areas: Haines Junction (4890 km2), Rose Lake (6310 km2) and Lorne Mountain (1020 km2), and 2 areas in which wolves were not manipulated: Teslin (2580 km2) and the Auriol Range (1190 km2) (figure 5.4). Survival rates and causes of mortality of adult moose and calves were compared among experimental and control areas.
Conditions Before Wolf Reduction
Before wolf reduction, moose populations in two of the three experimental
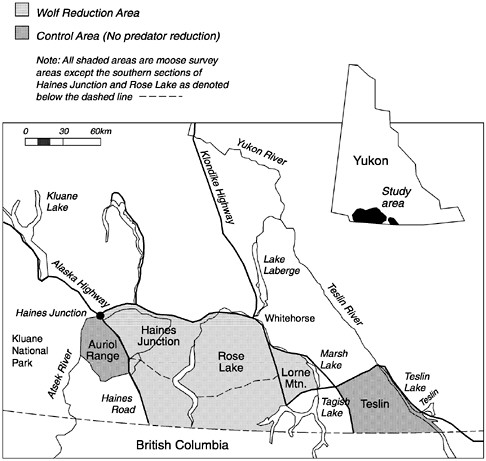
FIGURE 5.4 Location of the wolf control study area in the southwest Yukon, Canada.
areas (Haines Junction and Lorne Mountain) appeared to be declining, but were stable or slightly increasing in the third experimental area (Rose Lake). The moose population in one unmanipulated area appeared to be gradually decreasing while in the other unmanipulated area the moose population was stable or slightly increasing. Calf survival varied greatly between the two years before wolf reduction: In autumn 1980 and 1981, respectively, there were 40 and 11 calves/100 cows in Haines Junction, 20 and 26 in Rose Lake, and 37 and 9 in Lorne Mountain. The overall average in the two years before wolf reduction was 23.8 calves/100 cows. In the unmanipulated areas there was an average of 22 calves/100 cows before treatment. Wolf densities in the 3 experimental areas averaged 12.5 wolves per 1000 km2 before removal and averaged 15 wolves per 1000 km2 in the areas where wolves were not removed.
Wolf and Bear Reduction
Wolf populations in the experimental areas were reduced over a 5-year period through aerial hunting between the winters of 1982–83 and 1986–87 but the level of reduction varied among years and treatment areas. Reduction of the wolf population by more than 40% was thought to be sufficient to influence moose populations, but this level of reduction was attained for only 3 years in Haines Junction and Lorne Mountain and for 5 years in Rose Lake. Population reductions of 80% were attained for 2 years at Rose Lake and for one year at Lorne Mountain. Liberalized brown bear hunting regulations were used to reduce the number of brown bears in the same experimental areas. The average number of bears removed each year increased from 3 to 6 in Haines Junction and from 2 to 8 in Rose Lake. No bears were removed from Lorne Mountain. The bear population was estimated to be reduced by 7–9% but bears are difficult to census, and this estimate may not be correct.
Response to Wolf and Bear Reduction
Because the size of the moose population was not monitored in either Haines Junction or Lorne Mountain after predator removal, the effects of wolf and bear reduction on moose numbers could be assessed only in the Rose Lake experimental area. The moose population in Rose Lake did not increase significantly after 5 years of reducing the wolf population by more than 66% and 4 years of liberalized bear hunting regulations (607 ± 109 in 1981 and 582 ± 163 in 1982 compared to 717 ± 143 in 1986).
In the 3 treatment areas, the average number of calves/100 cows was 23.8 before predator reduction and 22 during experimental reductions. There was no difference in mean annual female moose survival rate in areas and years with wolf reduction (92%) and areas and times without wolf reduction (88%). However, 8 of the 16 female moose that died of known causes were killed by wolves, 4 by brown bears, 2 by either bears or wolves, and 2 from an unknown predator. Eighty percent of 132 collared moose calves died in their first year, and brown bears killed 58% and wolves 27% of these. The percent of calves that survived to 6 months of age was significantly greater in areas with wolf reductions (31%) than in areas without (21%). Multiple regression analysis also indicated that calf survival was greater when wolf population sizes were low. When wolf reduction years were omitted from this analysis, mean calf survival was significantly higher when maximum snow depth was less than 80 cm (22%) compared to when it was deeper (11%).
Thus, although moose populations increased slightly, reducing wolf numbers by more than 60% for 5 years and liberalizing brown bear harvest in southwest Yukon failed to produce a substantial increase in moose numbers. Wolves were responsible for half of the adult female moose mortalities and 27% of the
calf mortalities, but the survival of radio-collared adult moose was similar in untreated and treatment areas. Brown bears caused more than half of the moose calf mortalities. It was concluded that either a greater level of wolf reduction for a longer period of time, or control of both brown bears and wolves would be required to result in substantially increased moose populations. The financial ($1,375,000 CAN) and public relations cost of this program far outweighed the benefits in terms of increased numbers of moose.
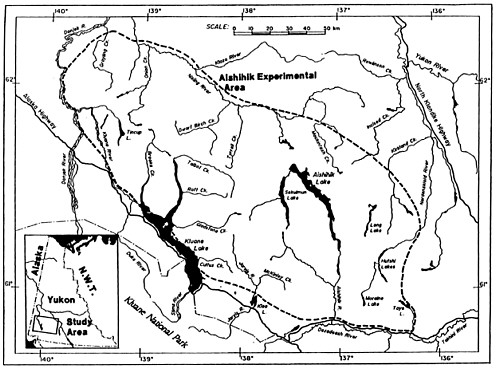
Aishihik, Yukon Territory
A well-planned wolf removal and sterilization experiment is underway in the Aishihik area of southwestern Yukon. The Aishihik study area is 20,000 km 2 of rolling hills, located on the eastern boundary of Kluane National Park, in the rain shadow of the massive St. Elias Mountains (figure 5.5). Moose, woodland caribou, and Dall's sheep are important ungulate prey in the area for a variety of predators including wolves, brown bears, black bears, coyotes, wolverine, lynx, and golden eagles. The experimental area is part of the traditional area of 3 First Nations (aboriginal Canadians). Local and traditional knowledge suggested that moose and caribou numbers were lower than they formerly were. Residents of the area believed that the initial cause of the ungulate decline was overhunting, particularly of cows and calves, even though bears and wolves were more abundant than in previous years.
Conditions Before Wolf Reduction
The Aishihik herd declined from about 1,200–1,500 caribou in 1981 (Larsen and others 1989a) to 785 in 1991 and further to 583 in 1992. In October 1990, 1991, and 1992 there was an average of only 15 calves/100 caribou cows (28.8, 8.6, and 7.3 survived to October each year). The adjacent Kluane caribou herd had an average of 20.4 calves/100 cows (31.7, 29.6, and 0.0) over the same 3 years and 6 other untreated herds averaged 24 calves/100 cows. Biologists predicted that the ratio of calves/100 cows would increase to greater than 30–35 if wolves were reduced.
Survey in two portions of the experimental area indicated that moose populations were decreasing. The pre-treatment densities of 60-114 moose/1000 km2 were among the lowest moose densities in the Yukon (average is 218 moose/1000 km2). The number of moose calves/100 cows in the area where wolves were controlled was 23 in 1981, 52 in 1990, and 12 in 1992 in one census area and 22 calves/100 cows in 1992 in the second area. After 1993 moose recruitment was reported as percent calves of the entire population including bulls instead of calves/100 cows so results are not comparable. Calves represented 10% of the moose population half a year before the onset of wolf control but averaged 9.7 percent (10, 12, and 7) the same year in other areas. Age class
estimates of Dall's sheep in the Aishihik study in 1985–92 averaged 19 lambs/100 ewes; 2 untreated areas averaged 20 lambs/100 ewes during the same period. The wolf population size was estimated at 178 individuals in 1992 (10–11.6 wolves/1000 km2) but only 121 in 1993 just prior to the first control session.
Wolf Reduction
In response to the perceived caribou decline and low moose numbers in an area of traditional importance to the 3 First Nations, hunting of caribou was curtailed in 1990 and moose hunting stopped in 1993. From 1993 to 1996 (4 years), 22–64 wolves were removed each winter, leaving 19–22% of the 1992 population size. Fertility control was begun in 1994. Females were sterilized by tubal ligation and males by vasectomy. As of 1997, 5 pairs, one lone male, and one lone female had been sterilized. The ratio of caribou calves to 100 cows increased from an average of 15 when wolf densities were high to an average of 41.5 (39, 38, 42, 47) during wolf control. During the same period the average number of calves/100 cows in the adjacent but untreated Kluane herd increased slightly from 20.4 to 26.4 (19, 22, 33, 32) and the average of 6 other untreated herds increased from 24 to 27 calves/100 cows. The proportion of the moose population that were calves increased from the 10% measured before wolf control to 19% (18, 18, 16, 24). The percentage of calves in the 3 untreated caribou herds increased from 9.7 to an average of 13.5, but data were highly variable. The number of Dall's sheep lambs/100 ewes increased from 19 before wolf control to 27 during control, with the untreated herds increasing from 20 to 26.
Except for the fact that hunting was stopped during the years of wolf control, the Aishihik experiment was well designed. The removal of approximately 76% of the wolf population by aerial wolf control for 4 years and the elimination of hunting resulted in an even greater increase in the number of caribou calves/100 cows than predicted. The response of moose was not as clear, but there was little change in moose calf survival because of high levels of bear predation in the region (Hayes 1992). The proportion of calves in the treatment area grew less than 4% more than in the control areas and there was great variation both within and among control areas. Because mountain sheep are relatively secure from wolf predation in the rugged terrain that they inhabit, Dall's sheep were not expected to be affected by wolf removal. As predicted, the number of Dall's sheep lambs/100 calves showed no noticeable response to wolf removal. Because the experiment ended less than a year ago, changes in ungulate population densities cannot yet be assessed.
Northern British Columbia
Moose, elk, stone sheep and in particular caribou were thought to be declining in northeastern British Columbia in the 1970s and 1980s. In an attempt to
TABLE 5.2 Summary of wolf Reduction in Northern British Columbia
Year | Location | Area (km2) | Number of Wolves Killed |
1978 | Horseranch | 3,000 | 22 |
1979 | Horseranch | 3,000 | 25 |
1980 | Horseranch | 3,000 | 23 |
1981 | South Kechika | 4,000 | 70 |
1982 | South Kechika | 7,000 | 89 |
1983 | South Kechika | 10,000 | 105 |
1984 | Muskwa | 7,000 | 182 |
1985 | Kechika (including Horseranch) | 18,000 | 157 |
1986 | Muskwa | 14,000 | 198 |
1987 | Muskwa | 10,000 | 125 |
TOTAL |
|
| 996 |
Source: Elliott 1989. | |||
stop the decline and to evaluate the role that wolf predation played in the dynamics of these ungulates, wolves were removed in three areas and wolves and their prey were monitored in these and several other locations (table 5.2). One wolf removal area was in the Kechika drainage in the area of the Horseranch caribou herd between 1978 and 1980 and again in 1985 (Bergerud and Elliott 1986). The second was in the upper Kechika drainage between 1982 and 1985 (Elliott 1986a; Elliott 1989), and the third was in the Muskwa drainage between 1984 and 1987 (Elliott 1986b; Elliott 1989; figure 5.6). To test the effects of wolf removal on ungulate densities and the proportion of young in the population, several non-treated areas were studied: Spatsizi and Level-Kawdy for caribou; and Pink Mountain, Core, and Liard for moose, and 10 census areas for sheep. Elk recruitment rates were recorded only before and during wolf removal. The most thoroughly documented portion of this study was the comparison of caribou in the Horseranch area (wolf removal) to the Spatsizi and Level-Kawdy areas (no wolf removal) (Bergerud and Elliott 1986). Data from the other wolf removal areas and unmanipulated areas were never completely analyzed and published (Bergerud 1990).
Conditions Before Wolf Reduction
The autumn "total count" census of caribou in the Spatsizi control areas was about 1800 in 1976 and 2435 in 1977. 1370 were counted in 1977 in Level-Kawdy. On Horseranch, 246 caribou were seen in 1977 (Bergerud and Elliott 1986). In the Spatsizi and Level-Kawdy control areas, the population averaged 7.4 and 5.2% calves respectively. The Horseranch held consisted of 6.3% calves
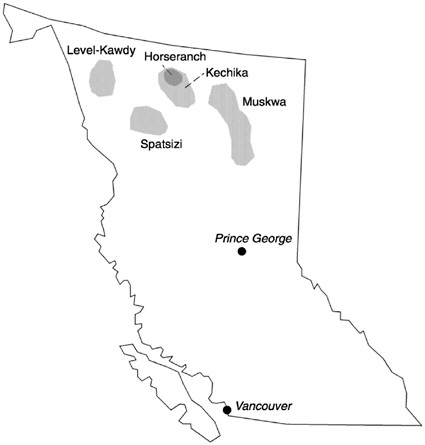
FIGURE 5.6 Location of wolf control areas in northern British Columbia, Canada.
in 1977. Wolf densities were between 9.6 and 11.2 per 1000 km2 in all three areas before wolf reduction, however, systematic surveys of wolves were not conducted in Spatsizi or the Level-Kawdy (Bergerud and Elliott 1986).
Moose densities in 3 control areas were declining: in the Pink Mountain area they declined from 1700 ± 250/1000 km2, to about 1100 ± 100/1000 km2 in 5 years, in the Core area they decreased from 1000 ± 300/1000 km2 to 800 ± 160/1000 km2 in 3 years, and in Liard they decreased from 600 ± 80/1000 km2 to 90 ± 30/1000 km2 in 6 years (Elliott 1989). No single decline was statistically significant (P > 0.05) but all had a similar trend. The control populations contained an average of 12 calves/100 cows.
Census of the number of lambs/100 ewes and the total number of sheep seen were conducted in 10 census areas. An average of 23 lambs/100 ewes was recorded when wolves were not reduced (Elliott 1989). All sheep populations appeared to be decreasing in the early 1980s. Before wolf reductions in the
Muskwa there was an average of 16 elk calves/100 cows over 3 years (21, 14, and 13).
Wolf Reduction
Wolves in a 3000 km2 treatment area in the Horseranch area were poisoned in 1978 and, in the following two winters, they were shot from a helicopter (Bergerud and Elliott 1986). Over 3 years, the wolf population was reduced to 38%, 11%, 11% of the pre-removal density. Wolves increased to pre-reduction levels one year after this first reduction program ended. Although not systematically censused, the wolf population in the untreated Spatsizi area was thought to have been reduced by recreational hunters who shot at least 24 individuals between 1977 and 1980 (Bergerud and Elliott 1986).
Beginning in 1982, the area of aerial wolf removal that focused on removing entire packs shifted to the upper Kechika and gradually increased in size and number of wolves removed. In 1982, 70 wolves were removed from 4000 km2. In 1983, 89 wolves were removed from 7000 km2, and in 1984, 105 wolves from 10,000 km2 and finally in 1985, 157 wolves were removed from a 18,000 km2 area that engulfed the Horseranch area again (Elliott 1989).
In 1984, the Muskwa wolf removal began with 182 wolves being removed from 7,000 km2. In 1985, 198 were removed from an 14,000 km2 area and in 1987, 125 were removed from a 10,000 km2 area. Wolf censuses were conducted each year but in a variety of areas so the actual reduction in wolf densities was poorly documented (Elliott 1989; Bergerud 1990).
Response to Wolf Reduction
By the time wolf removal ended, caribou numbers in the Horseranch wolf removal area had increased from 246 to 311 (6% annual increase) (Bergerud and Elliott 1986). Two years later, caribou numbers increased further to 337. The proportion of calves in the Horseranch caribou population increased from 6.3% one year before wolf reduction to 15.2% when wolves were reduced. Over a longer period, calves/100 cows the year following wolf reduction averaged 31.8 (n=4) compared to 16.4 (n=5) when wolves were not reduced the previous winter. The total number of caribou seen during 2 censuses in each control area was about 55% of the 1977 counts, indicating decreases of 12% at Spatsizi and 11% in Level-Kawady. The proportion of calves in the untreated Spatsizi increased from an average of 7.4% in 1976 and 1977 to 10.8% while wolf control was ongoing in Horseranch. In the untreated Level-Kawady area, the percentage calves increased from 5.2% in 1977 to an average of 13.1% between 1978 and 1983 (Bergerud and Elliott 1986).
In 1981, a radio telemetry study of caribou began in the Spatsizi control area and demonstrated that fall caribou counts were highly variable in intensity—over
half the population was often not counted (Hatter 1987). Biologists debated whether or not the caribou population really decreased from the high count of 2435 in 1977 (Jones 1985). Unfortunately the Spatsizi populations were not adequately censused over the next decade. A late winter count in 1994 found 2145 caribou in alpine areas of Spatsizi, but others were known to be missed in the forest (Chichowski 1994).
While moose densities in the 3 areas from which wolves were not removed appeared to be decreasing, moose in the Middle Creek census area, which was within the Kechika wolf removal area, increased from 690 ± 130 to > 900 in 4 years (Elliott 1989). There was an average of 52 calves/100 cows over the 4 years when wolves were being removed (1982 to 1985) compared to the 12 calves/100 cows in the non-removal areas. Similarly, sheep population sizes in the 10 census areas appeared to increase after wolves were removed and the number of lambs/100 ewes increased from an average of 23 to 40. Elk calves/100 cows increased from an average of 16 when wolf numbers were not reduced to 48 when wolves were reduced.
Once active wolf reduction ended, wolf numbers increased rapidly. In the Kechika wolf removal area there were 4.6 wolves/1000 km2 in the 16,810 km2 area. One year later there were 12.6 wolves/1000 km2. Because the reduction area was small, the 3-fold increase in one year was probably due largely to immigration.
The northern BC wolf reduction was more a management action than a scientific experiment, and did not have a strong experimental design. Treatment areas and wolf census areas changed from year to year and most ungulate censuses were done without the aid of telemetry. Thus no correction is possible for changes in animal distributions and sightability. However, the evidence presented suggests that the removal of 1000 wolves over 10 years (almost 800 in the last 4 years) resulted in increased populations and higher calf survival of all ungulates in the area: moose, caribou, sheep, and elk. When wolf control ended, wolf numbers increased rapidly and calf survival decreased to pre-removal levels.
Québec
Because it has 140,000 moose hunters, the economic value of moose is higher in Québec than any other jurisdiction in North America. Maintaining a high sustainable harvest is important to local culture and economies. In the 1980s, the Ministè re de l'Environment et de la Faune conducted a wolf and black bear control experiment with a more structured design than most other experiments (Crête and Lolicoeur 1987). The Québec experiment, in La Vé rendrey Game Reserve, used 3 areas: a wolf removal area, a black bear removal area, and an unmanipulated area with no removal. The wolf removal area was 2150 km2, the bear removal area was 360 km2 and the unmanipulated area was 900 km2.
Conditions Before Wolf Control
Since the 1960s, moose density appears to have remained relatively stable at 300–400 moose/1000 km2. A limited entry hunt kept hunting pressure low compared to adjacent areas. Wolves were studied in detail in the control area between 1980 and 1984 (Messier 1985), and density ranged from 12 to 15 individuals/1000 km2. Black bears were common, at a minimum density of 230/1000 km2.
Wolf and Bear Reduction
In the wolf removal area, between 7 and 13 wolves were removed each year by trapping or shooting from a helicopter. Indexes of wolf abundance indicated that the number of wolves in the wolf removal area decreased from 21 to 8–11 wolves/1000 km2 during the control effort. In the bear removal area, 30, 26, and 25 bears were removed by trapping and shooting in 1983, 1984, and 1985 respectively (44 females and 37 males). Decreasing mean age in females captured each year (8.5, 4.8, and 3.3 for 1983, 84 and 85 respectively) and a change in trapping success (34 trap days per female in 1983, 109 trap days per female in 1985) suggested the female segment of the population was greatly reduced. The use of wolf leg-hold traps in 1983 allowed many larger male bears to escape and probably made them more difficult to trap in following years.
Response When Wolves and Bear Numbers Were Kept Low
The results of this experiment were unclear. The survival rates of calves of radio-collared cows during the control experiment were not significantly different among the 3 areas. In the unmanipulated area calf survival was 60% (n=20), in the wolf removal area it was 58% (n=24) and in the bear removal area it was 46% (n=13). The ratio of calves/100 cows was measured each year and was lowest in the unmanipulated area. From 1983 to 1986 when effects of the wolf control should have been noticed, there were an average of 24.3 calves/100 cows in the non-removal area and 39.8 in the wolf removal area. In the 3 years when bear control should have had an effect, the average of 24.3 calves/100 cows in the non-removal area compared poorly to the average of 47.3 calves/100 cows in the bear removal area. Thus, removal of neither wolves nor bears resulted in significant increases in moose calf survival. The lack of clear response was thought to be because an insufficient number of predators were removed and the fact that both wolves and bears were not removed from the same area. In addition, the experimental units may have been too small so that predators from adjacent areas hunted in the experimental area.
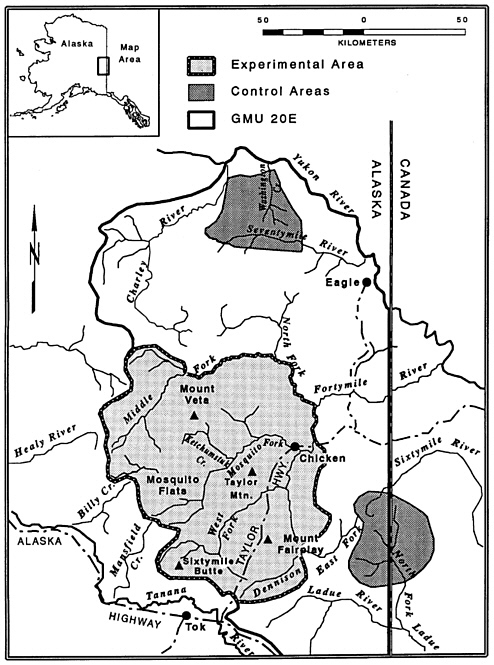
East-central Alaska (Fortymile, GMU 20E)
To investigate the effect of predation on the dynamics of low-density moose populations, the ADFG reduced, by aerial shooting and public harvest, wolf numbers by 28–58% for each of 3 years (1981–2 through 1983–4) in a 15,500 km2 area in east-central Alaska on the Yukon border (Gasaway and others 1992, figure 5.7). During the 3 years of wolf control, which included both ADFG and private harvest, 58, 47, and 28% of the winter wolf population was killed each year. For 4 years after control ended, public harvest took an average of 24% of the wolf population. Black bears were scarce in the experimental area during the 1980s, but in 1984 they nonetheless accounted for 52% of moose calf mortality in the study areas, whereas only 12–15% of calf mortality was caused by wolves.
Wolf control had no measurable effect on moose calf survival. Other studies showed that predation by brown bears was the largest source of moose calf mortality and an important source of adult mortality (Boertje and others 1988). There was no evidence that nutrition, winter weather, or harvest by humans, which continued during the experiments, was limiting the moose population. Gasaway and others (1992) concluded that the combination of bear and wolf predation was limiting moose populations to a density well below habitat carrying capacity. Thus, three years of wolf control alone had no effect on this low density moose population. Therefore, although the conclusion that the population is regulated by the combined predation by wolves and bears may be correct, the experiment was insufficient to allow firm conclusions.
South-central Alaska (Nelchina, GMU 13)
Historical data concerning population changes in Nelchina wolves and caribou have been reviewed and debated by a number of authors (Van Ballenberghe 1981, 1985, 1989, 1991, Bergerud and Ballard 1988, 1989, Eberhardt and Pitcher 1992). During 1948–1954, poisoning and aerial shooting reduced wolf numbers dramatically, and it is likely that the poisoning also affected bear numbers. During and immediately after this wolf reduction period, caribou numbers increased and had more than doubled by the early 1960s. Relatively low predator numbers, favorable range conditions, relatively mild winter weather, and relatively low harvest by humans probably all contributed to this increase, but it is impossible to determine their individual effects. Upon curtailment of wolf control activities, wolf numbers also increased, likely in response to abundant prey. Over a sequence of years the combined effects of more severe winter weather and predation reduced recruitment of calves. Females were also heavily harvested by humans during this period. Again, as a result of this combination of factors, the contributions of specific factors cannot be determined, but the caribou population declined seriously.
As the caribou population declined, wolf numbers remained relatively high
and moose numbers also began to decline. Because of the high incidence of moose hair in wolf scats, wolf control was resumed on an experimental basis in 1987 and wolves were reduced by 42–58% annually (1976–1978) in a portion of the area (Ballard 1991). In this case, wolf control did not result in high annual increases in the moose population; subsequent investigations indicated that most moose calves were killed by brown bears (Ballard and others 1981).
Two other experiments were conducted to measure the effect of bear predation on moose calves when wolf densities were moderately low. First, brown bear density in a small area was lowered by 60% during May and June of 1979 by moving 47 bears to other areas (Ballard and Miller 1990). This resulted in a significant increase in the number of moose calves surviving until autumn, but because most of the bears returned to the area later that year, there were no such increases in subsequent years. Hunting regulations for brown bears were then liberalized to decrease their numbers (Miller and Ballard 1992), but no changes in calf survival could be attributed to decreased bear numbers, nor was there evidence that the bear reduction caused or contributed to the observed moose population increase.
These two experiments did not yield easily interpretable results, both because air-assisted wolf control was not associated with increased survival of moose and because the population of adult moose did not increase after bear removal. In addition, the influences of weather, predation, and habitat quality on increases and decrease of caribou populations cannot be distinguished.
GROUND-BASED WOLF CONTROL
Kenai Peninsula, Alaska
Wolves were not intentionally controlled on the Kenai Peninsula but changes associated with other human activities provide information about predator-prey relationships. During the gold rush years at the turn of the century, prospectors and others eliminated wolves from the Kenai Peninsula by hunting and trapping and poisoning them (Peterson and Woolington 1982). The prospectors also allowed fires to escape. Thus they inadvertently improved moose habitat and, at least for the short-term, deteriorated caribou habitat (Spencer and Hakala 1964). Caribou disappeared in the early 1900s. In the late 1950s wolves began to return by natural immigration (Peterson and Woolington 1982, Peterson and others 1984). During the wolves' absence, moose and bear populations had increased. In 1947, fire burned 1200 km2 of the lowland of what was then the Kenai National Moose Range (Spencer and Hakala 1964). The burn created excellent winter habitat for 25 years and moose numbers were high until the 1970s (Oldemeyer and others 1977). Moose calf:cow ratios increased from 23:100 in 1950 to 40–50:100 in 1962. Sixty percent of the moose herd wintered in the burned area 10–12 years after the fire. Peak populations of moose in the late
1960s (more than 1600/1000 km2) were associated with excellent forage, light hunting pressure, few wolves, and mild winters (Oldemeyer and others 1977).
By the early 1970s, the habitat in the 1947 burn was deteriorating and the moose population was showing signs of malnutrition. Cow moose were legally hunted between 1970 and 1972, there were severe winters, wolf and black bear predation on moose calves was severe (Oldemeyer and others 1977), and wolves were taking moose year round (Peterson and others 1984). The vigor of the black bear population seemed to be linked to the abundance of moose, which in turn was related to the history of forest succession. In 1967, a smaller area burned and began attracting moose in 1975. Then, when the moose population was healthy, black bears ate more moose calves and had higher cub production and survival (Schwartz and Franzmann 1991).
In the late 1970s, in an attempt to reverse a 50% decline in the moose population, private hunters and trappers were encouraged to take more wolves in a ''recreational harvest" that lasted from 1976 to 1979 (Peterson and others 1984). The intensity of the harvest varied from 15% of the wolves in 1976 to 46% in 1978–79, a harvest that was similar in magnitude to air-assisted wolf control programs elsewhere. Estimates of the effects of this harvest on the wolf population were that wolf numbers were reduced following two years when the harvest exceeded 40% but that wolf numbers increased the following year when the harvest was less than 35% (Peterson and others 1984). This result is in general agreement with results elsewhere. Keith (1983) concluded that a removal of 40% of the wolves usually leads to a population decline the following year. On the Kenai, hunting and trapping reduced pack size, took many dispersing subordinate wolves, and permitted their establishment of new packs, demonstrating the extreme resilience of wolf populations to human harvest. Another major fire in 1975 began to attract moose to the burned area the following winter. Burns have a great amount of coarse woody debris and fallen trees, and are dangerous places for wolves to hunt moose. Thus moose that live in these areas are probably less vulnerable to predation and this contributes to higher moose densities in burns compared to other areas in the north. The effects of the wolf harvest on the moose population are confounded with the simultaneous improvement of habitat in the area of the burn.
Because the density of moose on the Kenai is most directly related to the history of fire, the first conclusion that can be drawn from this example is that the history of fire in an area can supersede the impact of predator control on moose. The predator control in some years in the late 1970s did reduce the wolf population and allowed more calf and old adult moose to survive than would have been the case otherwise, but the highest numbers of moose in winter occurred in areas that had been burned 10–25 years previously, regardless of the extent of reduction of wolves. A second conclusion is that a healthy moose population can support a healthy black bear population. Wolf populations were not systematically reduced, and thus, clear interpretation of the effects of increased wolf harvest in the
late 1970s is not possible. The fire history was a possible confounding effect and there were no comparison sites without the treatment before and after the experiment.
Vancouver Island, British Columbia
Despite intensive forest habitat management efforts to increase numbers of black-tailed deer on Vancouver Island, deer numbers and hunter success rates began declining in the northern half of the island in the early 1970s (Archibald and others 1991). The deer declines did not appear to be related to winter severity or disease, and they occurred in both hunted and unhunted watersheds. Furthermore, deer numbers were increasing in the southern half of the island where habitat was judged to be poorer, but where wolves were less numerous. Wolf and deer studies in the late 1980s indicated that deer declines were directly correlated with wolf activity (that is, greater in the core vs. the periphery of pack territories), and that wolf predation was limiting deer population growth (Hatter 1984).
To assess the role of wolves in regulating deer populations, the British Columbia Wildlife Branch conducted an experimental wolf control program in a 2,000-km2 area on northern Vancouver Island from 1982–1985. Over the 4-year period, 64 wolves were killed in an experimental area, reducing wolf density from 44 to 4–5 wolves/1,000 km2. An adjacent area was designated as a non-removal zone. Measures of deer populations, including fawn: doe counts, percent juveniles in spring, and number of deer seen/km of spotlight survey route, all increased following wolf control. These indicators of population growth also increased in a comparison non-experimental area, but as many as 22 wolves were illegally killed there. Therefore, no comparative data are available from areas where wolves were not harvested. In this study, changes in hunter effort (estimated by the number of days spent hunting), a response variable of great interest to management agencies conducting wolf control, was measured. The data indicate that the decline in hunter effort would have been greater in the experimental area had there been no wolf control (Reid and Janz 1995, but see discussion of this case in chapter 5).
Because the experimental control appeared to be successful, a 3-year control program was initiated in the spring of 1986 on about 50% of the entire island, during which overall wolf density was reduced from about 13–17/1000 km2 to 8–12/1000 km2 (Archibald and others 1991, Reid and Janz 1995). Again, increases in fawn: doe counts and percent juveniles in spring were inversely proportional to wolf density, whereas those measures did not change in non-removal areas. Deer numbers appeared to increase during removal efforts. Data from hunters indicated that wolf control resulted in increased deer numbers. The number of hunters using the areas increased, and the number of hunter days per kill decreased in areas of wolf control. From 1983 (the year before wolf control) to 1991, the estimated resident deer hunter days in the management area where
wolves were not removed declined by 73% from 12,758 to 3,618. In the adjacent management area, where wolves were removed, resident hunter days declined by only 31% from 6,359 to 4,357.
Because the 4-year period of experimental wolf removal was followed by 3 years of wolf reductions, during which an estimated 255 wolves were killed, it was not possible to assess whether the wolf reduction program had any long-term effects. Archibald and others (1991) summarized the lessons learned from the project as follows: trapping is a viable, but expensive method of wolf reduction; by controlling wolves, deer numbers will respond quickly, and when control is stopped, wolves respond quickly; and despite considerable public information and education on the value of the research projects, some residents will remain distrustful and conduct their own control programs. This case exemplifies many of the difficulties in carrying out good experimental science in the context of wildlife management.
East-central Saskatchewan
After noting a lack of response by a moose population to altered harvest regulations intended to increase herd productivity, as well as declining calf:cow ratios, biologists in east-central Saskatchewan conducted a small calf mortality study during which black bears likely killed 6 of 12 marked calves (Beaulieu 1984). Subsequently, Stewart and others (1985) removed black bears on two small areas (90 and 130 km 2) during May and June in 1983 and 1984, respectively, and found higher fall calf:cow moose ratios and percent of cows with calves on these experimental areas than on adjacent non-removal areas. For one of the areas, estimates made during the next fall indicated that both indices were nearer the original values, suggesting that the bear population had recovered to some extent. No density estimates of bears or moose were made; thus the proportion of the bear population that was removed was unknown, and no estimates of moose population densities were made. The proportion of yearlings in the population was higher after the second year, indicating a possible lingering effect of bear removal on calf survival.
NONLETHAL METHODS TO REDUCE WOLF AND BEAR PREDATION ON UNGULATES
The Alaska Department of Game and Fish has explored several nonlethal methods—diversionary feeding and sterilization of adult wolves—of regulating the impact of wolf and bear predation on moose and caribou. Fertility control was first applied to wolves in 1954 when one pair of wolves was sterilized using tubal ligation or vasectomy. Three pairs were treated in 1996 and a total of 5 pairs, one lone male, and one lone female were sterilized by 1997. Neither sample sizes nor time are sufficient to evaluate the potential effectiveness of
sterilization as a method of wolf control. There have been four studies of the effectiveness of diversionary feeding on reducing moose or caribou mortality.
Diversionary Feeding of Predators
Case 1 (Boertje and others 1995)
During spring of 1985, 12 metric tons of meat (moose and scrap) were airdropped in a 1,000 km2 moose calving area in east-central Alaska. Brown bears, black bears, and wolves were observed feeding on the meat. The early winter calf:cow ratio in 1982–1984 varied from 26–36:100, whereas it increased to 53:100 during the early winter of 1985 immediately following diversionary feeding, a statistically significant result even though the sample sizes were relatively small (range from 17–25 observed cows). Calf:cow ratios in three untreated areas during 1985 varied between 10 and 19:100 (also significantly different from the treatment area). It was not apparent which predators were diverted. The authors also suggested that the effect of immobilization drugs on bears might have influenced their ability to forage efficiently for up to 4–5 days following immobilization.
Case 2 (Boertje and others 1995)
In the spring of 1990, 26 metric tons of moose carcasses were distributed, in equal proportions, at 61 sites during three time periods in May. Bears and wolves ate 79% of the carcasses by the middle of June. The early winter moose calf:cow ratio from 1982–1989 ranged between 12 and 38:100 cows whereas it increased to 42:100 during the early winter following diversionary feeding. Calf:cow ratios on the untreated sites during early winter 1990 varied between 11 and 27; all are significantly lower than the ratios on the experimental sites.
Case 3 (Boertje and others 1995)
In the spring of 1991, 16 metric tons of moose carcasses were distributed on the same area as in Case 2. The early winter 1991 calf:cow ratio was 32:100 on the treatment area compared with 16–37:100 on nontreatment areas. No statistical comparison was made but judging from the range of values the difference probably was not significantly different. Three alternative explanations for the result are: 1) the treatment had no effect on diverting predation or 2) the amount of supplemental food was insufficient to affect moose, particularly calf, survival rates (suggestion of the authors), or 3) too few packs were treated with supplemental feeding.
Case 4 (Valkenburg, unpublished data)
A pack of eight wolves (Nells Creek Pack) with an active den was provided with caribou and moose carcasses for a three week period during the peak calving season (mid-May to early June 1996) of the Delta caribou herd. Calves were radio-collared in 1995 to estimate their mortality rate (most of the mortality was caused by wolves from this den). Diversionary feeding resulted in a significant decrease in calf mortality during the time the caribou were near the wolf den. However, calf:cow ratios in the fall of 1995 and 1996 were not different, suggesting that 1) additional mortality factors were operating on calves once the caribou left their calving grounds or 2) predation rates increased during the rest of the summer. It is not possible to evaluate the differences between alternatives from the information presented in Valkenberg (unpublished data).
Evaluation of Diversionary Feeding Experiments
Diversionary feeding to divert wolf and bear predation on ungulates is a time-consuming and expensive process (Boertje and others 1995). In the first three examples above, most of the meat provided to wolves and bears was salvaged from auto or train accidents. Diversionary feeding during cases 1 and 2 did increase calf survival rates during the following year. Case 3 may have been unsuccessful because: 1) the amount of meat presented to predators was insufficient to change their predation rates, 2) the presentation of supplemental meat had no effect on predation rates for reasons other than the amounts of meat, 3) environmental conditions varied sufficiently between years to lessen the treatment effect, 4) or some other unknown factor.
Case 4 suggests that wolf predation on caribou calves can be reduced by diversionary feeding, but the fall calf:cow ratios were not different between treatment and nontreatment years. None of the four experiments assessed changes in prey population densities during the winter following the diversionary feeding, so it is impossible to determine whether the feeding influenced other than autumn calf:cow ratios. Also, the effects of diversionary feeding on wolf pup and bear cub survival have not been determined to assess whether diversionary feeding might actually increase predator populations.
EVALUATION OF PREDATOR CONTROL EXPERIMENTS
The results of the predator control experiments are summarized in table 5.3. Each of these control experiments was initiated because it was believed that predator control would result in increased ungulate densities and, as a consequence, increase hunter success. There was also the expectation, or at least the hope, that higher densities of both predators and prey might persist for many years after predator control stopped. Each experiment began when ungulate
densities were low or declining. Hunting was sometimes simultaneously reduced. Indeed, Yukon Territory wildlife management policies stipulate that any wolf control program must be done in areas where prey are not hunted (Yukon Renewable Resources 1992).
Although considerable time and effort was expended to plan, design, and implement these experiments, the results are less informative than might have been hoped. Part of the problem is due to the size of the areas in which the experiments were carried out, the difficulty of gathering the needed information, and budgetary limits. Nevertheless, less has been learned from these experiments than would have been possible because there were serious deficiencies in their design and execution, and in the extent to which the results were monitored.
Problems in Design and Execution
Although extensive data were gathered on populations densities and trends of moose, caribou, and wolves prior to reaching a decision to initiate a control action, data on bear population densities were generally poor. In addition, assessments of habitat quality were generally limited to indirect indices of ungulate nutrition (body weight, fat deposits, bone growth, pregnancy rates, calf:cow ratios). Few direct habitat quality assessments were made. As a result, in most cases, data to support the judgments that habitats in the control area could support increased moose and caribou populations for more than a few years were not available. Several control experiments may have failed to increase ungulate populations either because predation rates by bears were high or because habitat quality was poor.
Inadequate execution makes the results of several control experiments difficult to interpret. The degree to which, and the duration over which, wolf numbers were reduced varied considerably among experiments. Sometimes wolves were reduced for only one year, and levels of reduction often fell short of what was desired. They certainly fell short of the degree that existing evidence suggests is necessary if ungulates are to increase as a result of reduced predation rates. In addition, wolf control was sometimes accompanied by other changes, such as reduction or elimination of hunting and trapping. The presence of such confounding variables makes it impossible to determine which of the factors that were altered might have caused changes in ungulate population densities.
Problems with Monitoring
The results of most experiments have been poorly monitored. In only two cases (wolf control on Vancouver Island and Finlayson) was there an attempt to measure whether hunter success—the primary goal of control—increased. Whether ungulate population densities actually increased following predator control actions was measured in only five experiments. During and after the other
TABLE 5.3 Predator Reduction Experiments Discussed in Chapter 5a
| Predator Reduction |
|
|
Method and Location | Wolves | Bears | Results |
Air-assisted | Wolf population reduced to 55–80% below pre-control numbers for 7 yrs (1976–1982). | Not done | Average annual rate of increase of moose populations was 15% during wolf control, and 5% for 12 yrs after the end of wolf control. Average annual rate of increase of caribou populations was 16%, and 6% for 7 yrs after the end of wolf control. |
East-central AK (GMU 20A) |
|
| |
Finlayson, Yukon | 49–85% of wolf population removed for 6 yrs (1983–1989); human harvest rate of moose and caribou reduced by 90%. | Not done | Increased survival of adult caribou; increased numbers of calves/100 cows for both moose and caribou. Average annual rate of increase for moose and caribou about 16–18%. Hunting success increased. Seven years after wolf control ended, moose and caribou numbers began to decline. |
Southwest, Yukon | Wolf numbers reduced by 40–80% for 5 yrs (Rose Lake; 1982–1987). | Bear population reduction estimated at 7–9% (1982–1987) | No substantial increase in moose populations or cow: calf ratios during predator removal. |
Aishihik, Yukon | Approximately 76% of wolf populations removed over 4 yrs (1993–1996). Moose and caribou hunting curtailed. | Not done | Increased numbers of caribou calves/100 cows. Response of moose highly variable and not clearly related to wolf reduction. Control ended in 1996, too recently to assess long-term trends. |
Northern BC | 1000 wolves removed in 10 years (1978–1987); almost 800 of which were removed in the last 4 yrs of removal. | Not done | Calf survival rates and population sizes apparently increased for all ungulates in the area. When wolf control ended, wolf numbers increased rapidly and calf survival decreased to pre-control levels. |
Québec | Wolf population reduced to 48–62% over 4 years (1982–1985). | A total of 81 bears removed over a 3 yr period in a different area (1983–1985). | No apparent change in moose calf survival rate in either wolf or bear removal area. |
East-central AK (GMU 20E) | Wolf population was reduced by 28–58% for 3 yrs (1981–1984). | Not done | Wolf control had no measurable effect on moose calf survival. |
South-central AK (GMU 13) | Extensive aerial shooting and poisoning reduced wolf numbers dramatically (1948–1954). | Poisoning probably also reduced bear numbers. | During and after this predator reduction period, caribou numbers increased and had more than doubled by the early 1960s. This coincided with favorable weather and range conditions and low harvest by humans. |
| Wolves were reduced by 42–58% for 3 yrs (1976–1978) | After wolf control ended, 60% of the bear population was trans-located or reduced by liberalized hunting regulations. | Wolf control did not result in high annual increases in the moose populations. Calf survival increased after bear removal, but bears returned to the area after summer and moose calf survival returned to levels before bear removal. No change in calf numbers could be attributed to increased bear harvest. |
control experiments only indirect results, such as calf:cow ratios, were assessed, and sometimes they were determined for only one or two years. Calf: cow ratios are not always good indicators of long-term population trends and, in the short term, they can change because of changes in either calf or cow mortality rates. If cow mortality is stable, and birth rate and calf mortality both increase, then calf: cow ratios can increase with no change in the adult population size. However, most calf:cow ratios are not recorded in the late spring (shortly after parturition), but in fall to late winter. Because most calf mortality occurs in the first 6–8 months and sightability tends to be better during the late winter/early spring (pre-parturition), calf:cow ratios, or recruitment, measured at this time are a good indication of population trend and these are what have been measured.
It is apparent that political pressures have created conditions that have favored attempts to achieve quick, short-term results from predator control experiments by altering more than one factor simultaneously. In addition, budgetary constraints have led to the use of indirect measures of success, which are less expensive in the short-term but which are not good indicators of population trends. ADFG did not measure hunter behavior before and after wolf control and cannot empirically show changes in where people hunted, their success per unit effort, and their satisfaction about changes in game densities. Although in some cases prey numbers increased five fold after wolf control (20A), there is no direct empirical evidence that the social goals of predator control were achieved in Alaska.
Interpretation
What conclusions can be drawn from the predator control experiments that have been conducted in North America? Perhaps the clearest conclusion is that the experiments provide only negative evidence for the existence of an alternative stable state with relatively high numbers of both predators and prey. Only two experiments (Finlayson and GMU 20A) were monitored for long enough to reveal the existence of such a state, and the evidence from those studies was negative or equivocal. Therefore, existing evidence suggests that if predator control is to be used as a tool to increase ungulate populations, control must be both intensive and relatively frequent. There is no factual basis for the assumption that a period of intensive control for a few years can result in long-term changes in ungulate population densities.
Second, those experiments that appear to have resulted in increases in moose or caribou populations were conducted where wolves were relatively numerous, where bears were relatively uncommon or were not preying heavily on ungulate calves, where habitat quality was high, and weather was relatively benign. The evidence is not yet conclusive, but there is reason to believe that an intensive control effort, during which wolf populations are greatly reduced for several
years and these other factors are favorable, can result in short-term increases in moose and caribou populations.
Third, control experiments that appeared to have had some success used methods, such as aerial shooting, that are not currently politically acceptable. Whether sufficient reductions in wolf numbers can be achieved by acceptable methods is uncertain. It is too early to evaluate the effectiveness of sterilization of wolves, and diversionary feeding appears to be feasible only in small areas and under very limited conditions. In addition, sterilization of wolves may be unacceptable to some native communities who consider this disrespectful to the wolves and, in fact, more inhumane than simply killing them.
In addition to meat collection, other problems with diversionary feeding include storage of meat over a long period of time and transportation of meat to feeding sites. Provision of commercial meat products would be extremely costly because there is no source of readily available salvage meat in Alaska. Diversionary feeding experiments can be used to evaluate the role of food abundance on predation rates in the dynamics of prey populations but they are not a feasible management tool for controlling predation over large areas.
ADAPTIVE MANAGEMENT REQUIRES AN EXPERIMENTAL APPROACH
Successful management need not be guided by a complete understanding, but enough information should be available to enable managers to make predictions and to estimate their confidence in the reliability of their predictions. To improve predictive abilities, the basic principles of experimental design can be incorporated into sample surveys and experiments. The results of properly designed experiments are more likely to be clear and unambiguous. The feasibility of experimental methods for informing policy appears to be widely underestimated (Moses and Mosteller 1995). Biologically-sound wildlife policy is most efficiently developed through adaptive management—that is, when management and research are combined so that projects are specifically designed to reveal causal relationships between interventions and outcomes. In other words, adaptive management is not simply modifying management in light of experience. It means designing management intervention to maximize what can be learned from the experiments.
Adaptive management involves (1) specification of the problem, including defining the boundaries of interest, (2) gathering all relevant information, (3) organizing it so that comparisons can be made, and (4) evaluating the strength of causal inferences that are possible (Kish 1987). In the present case, the boundaries of the current problem are populations of wolves, black bear, brown bear, moose and caribou in the natural ecosystems of interior Alaska; however, the issue is relevant to all northern ecosystems and other ecosystems where the
outcome of interactions between large mammalian predators and their prey is an important wildlife management issue.
Any intentional perturbation is an experiment, but the reliability of inferences about whether the perturbation caused the observed effect depends on the design of the study. During wolf control and bear management, causal relationships have been assumed to be already known, that is, it was assumed that predators were controlling their prey. If the objective had been to test whether predators were really controlling prey, the experiments might have been planned differently.
An example of a proper design is the experiment on selected British islands to test whether populations of two species of game birds were limited by the small mammals (voles) that preyed on their nests (Marcstrom and others 1988). For five years in a row predators were removed from one area but not from a second, non-removal area. For the next four years, the removal and non-removal areas were reversed. The experiment showed that predators were, indeed, limiting game bird populations on these islands. The conclusion is strong because variation in time was controlled by doing the experiment simultaneously in two places and variation between areas was controlled by using each area for its own comparison through time. Replication, that is repetition of this design on more islands, would have yielded data on the generality of the results but would not have strengthened the conclusion.
Using the notation of Campbell and Stanley (1966), this experimental design can be represented as:
population 1 | X0 | X0 | X0 | X0 | X0 | 0 | 0 | 0 | 0 | |
population 2 | 0 | 0 | 0 | 0 | 0 | X0 | X0 | X0 | X0 | |
| time → |
| ||||||||
where X represents the annual removal of predators, and 0 represents observation of the game bird population. The rows represent sets of observations through time and the columns represent simultaneous observations at a time period. It is a design leading to fairly strong causal inference because nearly all possibly confounding effects are accounted for. If the game birds had been randomly placed on different islands the design would have been a true experimental design. As it is, it has to be called a quasi-experimental design (James and McCulloch 1995). Most field experiments are in fact quasi-experiments in this sense.
Using this notation, the design of the experiment in wolf control and bear management for the Delta caribou herd in Game Management Unit 20A is:
Population 1 | 0 | 0 | 0 | 0 | X0 | X0 | X0 | X0 | 0 | 0 | 0 | 0 | 0 |
Population 2 | 0 |
|
|
|
|
|
| 0 |
|
|
|
|
|
Population 3 | 0 |
|
|
| 0 |
|
|
| 0 |
|
|
|
|
Population 4 | 0 |
|
|
|
|
|
| 0 |
|
|
|
|
|
Population 5 | 0 |
|
|
| 0 |
|
|
| 0 |
|
|
|
|
| time → |
| |||||||||||
This is a multiple time series design in which the treatment (wolf removal) was applied for four consecutive years and the caribou population (0s) was monitored for a series of years both before and after the treatment in the treatment area, as well as sporadically in the four nontreatment areas. With more observations in the nontreatment areas this would be a multiple time series design, another quasi-experimental design. It allows weaker causal inference than the above design of Campbell and Stanley's study of predation on game birds, because initial differences among sites are possibly confounding. In the Delta caribou herd experiment, the results suggest that wolf removal did result in an increase in the caribou herd. The design for most of the other experiments in wolf control and bear management are either one time case studies
X 0,
or one group pretest-posttest designs
0 X 0,
or static group comparisons
X 0
0,
X 0,
all of which are inadequate for causal inference, because even though the management effort may have caused the result, the design of the experiment was inadequate for causal inference. In the first case, there was no nontreatment group and no comparison. In the second case, one group was studied before and after the treatment. This design uses the group for making the comparison, but there may have been other causes that occurred at the same time as X. In the third case there is no assurance that the initial groups did not differ. The danger is that of falsely concluding a cause and effect relationship.
None of the above designs incorporate more than one species of predator or prey. If predators switch from one prey to another, these simple designs may be able to test the hypothesis of the effects of control but modeling will be required to characterize the system satisfactorily.
To understand the degree to which predation by both wolves and brown bears limit a prey population, an experimental design like the following would be needed:
population 1 | 0 | 0 | 0 | X | 0 | 0 | 0 |
population 2 | 0 | 0 | 0 | Y | 0 | 0 | 0 |
population 3 | 0 | 0 | 0 | XY | 0 | 0 | 0 |
population 4 | 0 | 0 | 0 | 0 | 0 | 0 | 0 |
| time → |
| |||||
where X represents wolf removal, Y represents bear removal, and 0 represents observations of the prey population.
The GMU 20A experiment does not reveal whether weather initiates population declines in general because it seems to have done just that in the Fortymile caribou herd as wolves switched from eating moose to eating caribou, and adult cows did not breed in some years with severe winters (Boertje and Gardner 1996). In the Porcupine and Denali herds calf mortality is apparently nutrition related (Whitten and others 1992; Adams and others 1995, respectively). All these ideas could be checked by studies designed by the criteria above.
In its analyses of the Delta herd (appendix C), the committee found that although calf survival was correlated with annual snowfall, incorporation of snowfall into the model did not improve its explanatory power. Modeling the dynamics of population regulation to estimate what factors are behaving in a density dependent way involves assuming a framework for how things are happening and then estimating the parameters. When based on a carefully designed and controlled experiment, one can assess cause and effect relationships. The same kind of modeling based on purely observational studies cannot distinguish between factors that regulate population densities from those that are merely correlated with them.
Prey: predator ratios (Gasaway and others 1983; Keith 1983) are more readily obtained than are full-scale area-specific studies of density, but they are subject to several major confounding variables. If prey populations are low, predators might eat more of the carcass and the prey: predator ratio will become lower. Hayes (1995) observed that wolf packs tend to kill prey at similar rates, regardless of pack size—suggesting that more of the prey carcass may be eaten when wolf packs are large. Preying on alternative prey species and prey switching may affect the results. If prey populations are close to their nutrient/climate ceiling, predation may be primarily compensatory rather than additive (Theberge 1990). Even calf:cow ratios can be misleading because they are affected by changes in mortality rates of both calves and cows. A better alternative to using ratios as response variables is to monitor the density of the population by age class and sex.
MAKING A DECISION TO INITIATE A PREDATOR CONTROL ACTION
The committee's evaluation of the predator control experiments suggest that predator control is likely to achieve its intended goals only if a decision to initiate control is made after a thorough evaluation of the existing situation. The questions to be asked are 1) Under what circumstances is predator control justified? 2) Are there other management options than predator control available that will bring about the desired results? 3) Has an adequate analysis been made of the biologically, economically, and sociologically relevant information? and 4) Is it possible to design a control program that will include the ability to monitor the outcome and assess the degree of success?
Even if killing predators can be reasonably expected to cause an increase in ungulate numbers, it is worthwhile to consider if there are alternative, nonlethal means available to reduce the impact of predation. Under certain specific circumstances, they may be more cost-effective, and commonly, they are more socially acceptable (Boertje and others 1995). Perhaps habitat can be manipulated (burned, logged, or otherwise set back successionally) to improve its structure, quality, and distribution. A fire policy integrated with other agencies may be critical for maintaining optimal long-term habitat that will support relatively higher ungulate numbers. Also, the distribution of quality habitat, not just its quantity, may have significant positive effects on ungulate populations.
Translocation of wolves or bears is frequently only a temporary solution unless individuals are translocated to sites far enough from the study area so they do not return. However, it has been shown to be temporarily effective in some studies, and it may be applicable in special circumstances—such as in the Kenai Peninsula, where development in the Anchorage area creates a partial barrier to migration. Sterilization of wolves to offset their high reproductive rate is currently under investigation as a effective technique to keep wolf numbers at lower levels. Its effectiveness may be compromised by the tendency of wolf packs to kill at similar rates, regardless of pack size (Hayes 1995), and by the frequency with which unrelated wolves join packs, particularly in Alaska (for example, Meier and others 1995).
Diversionary feeding is likely to be more effective for bears than for wolves because the period of bear predation on ungulates is restricted to a much shorter time period. Saving calves from wolves during June is of little value if they kill calves during the remainder of the year. However, diversionary feeding of bears in combination with wolf reductions may be an effective strategy.
A decision to reduce predator numbers dramatically over a relatively short period of time will have consequences for the predators themselves. The time it takes for a species to recover to pre-control numbers or more depends not only on their inherent rates of reproduction, but also the magnitude of reduction of human-caused mortality. Wolves breed much more rapidly than bears, and thus
their potential rate of increase is higher, and they can withstand higher mortality rates.
Also, the proximity of other wolf or bear populations that might provide immigrants will affect the rates of local population increase following control. In comparison to bears, wolves can more easily repopulate an area through immigration, because both males and females disperse from natal ranges. Consequently, an assessment of the geographic scale of removal efforts is important not only with regard to ungulate populations of concern, but also to the effectiveness with which the predator population can be held at necessary low levels.
Finally, wolf control may provide more food per capita for bears, but the numerical response of bears to changes in food abundance are also much lower than for wolves. Thus bears are more susceptible to control efforts, and will take much longer to rebuild their population.
An additional but certainly important concern is what the larger, unintended ecological consequences of such control will be. Even in a qualitative sense, the potential changes on other plant and animals species and systems must be considered. If ungulate numbers increase, competition with other herbivores will likely increase, and perhaps the numbers of those competitors, such as beavers, will go down. With reduced wolf and/or bear numbers, predation on alternate or less common prey species will decrease. One can imagine that in some areas, sheep numbers might increase to or above their carrying capacity, with a subsequent deterioration in habitat and a major population decline. Although this is a ''what if …?" kind of assessment, it points out that potential unintended consequences can ultimately have large repercussions, biologically and politically.
It is clear from the experiments already done that killing a substantial proportion of the population in the target area is essential if wolf control is implemented to increase ungulate numbers. A wolf population probably should be reduced so that it is no greater than 40% of its original numbers, and then maintained there for at least 3, and probably 5 years, depending on the response of the ungulate populations. Bears, on the other hand, may need to be removed at lower rates for shorter periods of time to achieve notable results. However, since wolves have a greater per capita effect on ungulates than do bears, and bear predation behavior may be more unpredictable, results of any bear control efforts have less chance of being reliably predicted.
Another concern is which individuals in the population are going to be killed. Usually, wolves are killed by a combination of private and government efforts from the air and/or ground that targets whole packs. Focusing on specific geographic areas increases the chances that most or all of identified packs might be removed by ground-based efforts, and aerial hunting particularly if one or more pack members have been radio-marked, increases the chances of removing an entire pack (e.g., Hayes and others 1991). This is important because the removal of 60% of the members of each pack, for example, will probably have less of an effect on ungulate population change than will removal of 60% of the
packs (for example, Walters and others 1981); this is particularly likely if experienced individuals are the ones left in partially affected packs. Logistical constraints likely limit the opportunities to remove entire packs, and good data comparing the consequences of different removal regimes need to be collected to identify costs and benefits of each.
Seasonal changes in predator-prey ecology are another area of concern. Reducing pack size in late autumn has little effect on winter predation rate (Hayes et al. 1991, Hayes 1995), but it should have a greater effect in summer when pack cohesion disintegrates during denning, subadults roam alone or in small groups, and many more moose or caribou calves are available than in winter. Reducing the number of wolves in summer reduces the number of independent hunting units, which in turn should reduce the predation rate of the whole population. Predation will be little changed by reducing the number of wolves in winter because the pack acts as a single unit, and kill rates of various size packs are similar (Hayes 1995).
The economic and public relations cost of predator control is high, and consequently, detailed planning is necessary to ensure a successful program. A cost effective decision process involves a series of steps beginning with the least expensive and progressing to those that are more costly.
Guidelines for Decision-making
The following is a set of guidelines, which, if followed, should increase the probability of success from implementing a management option. The committee emphasizes, however, that even if proper procedures are followed, success cannot be guaranteed, and presenting guidelines does not constitute endorsement by the committee of specific control or management activities.
The first step in deciding whether or not to reduce predators is to identify the reasons for wanting more ungulates because not all reasons are equally important. Some reasons for wanting to increase prey numbers include:
I. Reasons for increasing ungulate populations.
A. Biological emergency. It has been suggested that predator control be considered if there is a "biological emergency"; that is, when a local ungulate population is at risk of extirpation. Local extirpations, and recolonizations have likely occurred frequently in the past, but recolonization may be less likely today in areas where people have substantially altered habitats. If it is determined that a biological emergency exists, the management agency should proceed to III.
B. Subsistence emergency. In portions of Alaska where indigenous people rely largely on ungulates, extirpation or greatly reduced populations of moose and caribou would cause significant hardship. In the past, indigenous peoples moved during periods of scarcity to where game were more abundant, but human
migrations are difficult or impossible in most areas today. If predator management to maintain a satisfactory abundance of ungulates to support an indigenous subsistence lifestyle is a high priority, proceed to II.
C. Lifestyle and recreational demands. Abundant ungulate numbers are desired by people whose lifestyle includes recreational hunting. If game numbers and resulting hunting success is low, other protein source are available. Predator reduction to support higher ungulate numbers to satisfy recreational demands is currently a lower priority than for biological or subsistence emergencies.
D. Viewing and tourism demands. Abundant ungulate numbers are of value to tourists and the tourist industry. Predator reductions to stimulate an abundance of ungulates to increase tourist satisfaction is also currently a lower priority than for biological or subsistence emergencies.
II. Quantifying demand and investigative modeling. Once a compelling reason for predator reduction has been identified, the demand for an increase in ungulate populations should be quantified. Combining the use of questionnaires, personal interviews, historic hunter success records, and comparisons among areas should quantify the unmet demand and indicate the degree that ungulate numbers must increase to meet the demand. Simple population projection models and benefit/cost models should be used to determine the level and duration of predator removal that may be necessary to increase ungulate numbers to where the demand would be met, and to estimate the costs of predator removal. If, after quantifying the demand and investigating the costs of control, predator reduction might be effective, then the agency should proceed to section III.
III. Ecological investigations. Ecological investigations are expensive but are needed to assess the likelihood that a predator management activity would achieve its desired goals. The needed data include:
A. Historic trends. Are there fewer ungulates now than before, how reliable are the data, and what has changed? Could changes be explained by weather patterns, habitat changes, or human harvest?
B. Current trend. Is the population currently decreasing? This is an expensive but important step that is best estimated by monitoring adult survival using telemetry and/or a precise series of censuses.
C. Emigration. Do adjacent areas have increased ungulate populations that indicate possible emigration from the area of interest?
D. Habitat condition. Are the prey at or close to current environmental carrying capacity? Combining winter severity indices with body condition indexes such as body weight, body fat content, growth rates, pregnancy rates over a series of winters should indicate if habitat is limiting. Direct habitat monitoring should also be used, recognizing that relationships between food and cover quantity, quality, and distribution are complex.
E. Predator ecology. What are the densities of wolves and bears in the area and what are their major seasonal foods? Which predator species might be depressing ungulate numbers, and how difficult and expensive would reduction programs for each species be in the particular area?
F. Limiting factors. An expensive yet critical step is determining the relative importance of the various limiting factors.
G. Ecological consequences. Would predator control cause other negative ecological consequences, such as disrupting scavenger populations or other predator species who might depend on prey killed by wolves or bears?
IV. Management Options. If the availability of prey is significantly less than the demand, the following options should be investigated.
A. Habitat manipulation. Is it feasible to increase ungulate reproduction or decrease predation rates by improving the quantity, quality, or distribution of habitats?
B. Nonlethal methods. What is the potential for diversionary feeding, sterilization, and translocation?
C. Selective removal. Would selectively removing individual bears or individual wolf packs be effective?
D. Timing of removal. Are there certain times of the year when removal of predators would be most effective?
E. Removal methods. Assess removal methods to determine how recreational and economic benefits (hunting and trapping) might be realized while encouraging the most humane and efficient methods that are politically acceptable.
F. Removal Locations. Can predator control be concentrated in the most critical areas to maximize effectiveness while minimizing effects on the predator population?
V. Monitoring Predator Reductions. Most past predator management programs have resulted in unclear results. Control actions have sometimes been of insufficient magnitude, duration, or geographic extent to show clear results. Additionally, pre and post-treatment monitoring have sometimes been insufficient, non-experimental areas have not been maintained, and climatic conditions have often been poorly measured. Wherever possible, predator control programs should be incorporated into a reviewed experimental design to ensure that knowledge is one of the benefits of the reduction program.
REFERENCES
Adams LG, BW Dale, and LD Mech. 1995. Wolf predation on caribou calves in Denali National Park, Alaska. In LN Carbyn, SH Fritts, and DR Seip, Eds. Ecology and conservation of wolves in a changing world. Canadian Circumpolar Inst, Univ Alberta, Edmonton, 1995.
Archibald WR, D Janz, and K Atkinson. 1991. Wolf control: a management dilemma . Transactions of the North American Wildlife and Natural Resources Conference 56:497–511.
Ballard WB, TH Spraker, and KP Taylor. 1981. Causes of moose calf mortality in southcentral Alaska. J Wildl Manage 45:335–342.
Ballard WB. 1991. Management of predators and their prey: the Alaskan experience. Transactions of the North American Wildlife and Natural Resources Conference 56:527–538.
Ballard WB and SD Miller. 1990. Effects of reducing brown bear density on moose calf survival in south-central Alaska. Alces 26:9–13.
Beaulieu R. 1984. Moose calf mortality study. Saskatchewan Parks and Renewable Resources, Wildlife Population Management Information Base, 84-WPM-8. 5 Pp.
Bergerud AT and JP Elliott. 1986. Dynamics of caribou and wolves in northern British Columbia. Can J Zool 64:1515–1529.
Bergerud AT and WB Ballard. 1988. Wolf predation on caribou: the Nelchina herd case history, a different interpretation. J Wildl Manage 52:344–357.
Bergerud AT and WB Ballard. 1989. Wolf predation on Nelchina caribou: a reply. J Wildl Manage 42:344–357.
Bergerud AT. 1990. A review of the dynamics of ungulates and wolves in Northeastern British Columbia 1976–1990. Draft Copy. Bergerud and Associates, Fulford Harbour, BC.
Boertje RD, WC Gasaway, DV Grangaard, and DG Kellyhouse. 1988. Predation on moose and caribou by radio-collared grizzly bears in east central Alaska. Can J Zoology. 66:2492–2499.
Boertje RD, DG Kellyhouse, and RD Hayes. 1995. Methods for reducing natural predation on moose in Alaska and Yukon: an evaluation. Pp. 505–513 in LN Carbyn, SH Fritts, and DR Seip, Eds. Ecology and conservation of wolves in a changing world. Canadian Circumpolar Institute, Occasional Publication No. 35, Edmonton.
Boertje RD, P Valkenburg, and ME McNay. 1996. Increases in moose, caribou, and wolves following wolf control in Alaska. J Wildl Manage 60:474–489.
Boutin S. 1992. Predation and moose population dynamics: a critique. J Wildl Manage 56:116–127.
Campbell DT and JC Stanley. 1966. Experimental and quasi-experimental designs for research. Rand McNally, Chicago.
Chichowski D. 1994. Summary—BC Parks Skeena wildlife surveys, March 1994. BC Parks Branch, Smithers, BC.
Crête M and H Jolicoeur. 1987. Impact of wolf and black bear removal on cow: calf ratio and moose density in southwestern Québec. Alces 23:61–87.
Eberhardt LL and KW Pitcher. 1992. A further analysis of the Nelchina caribou and wolf data. Wildl Soc Bulletin 20:385–395.
Elliott JP. 1986a. Muskwa wolf management project of northeastern British Columbia: 1985–86 Annual Report. Wildl. Work. Rep. No. WR-21. Wildlife Branch. Ft. St. John, BC. 15 Pp.
Elliott JP. 1986b. Kechika enhancement project of northeastern British Columbia wolf/ungulate management: 1985–86 Annual Report. Wildl Work Rep No. WR-20. Wildlife Branch, Ft. St. John, BC. 17 Pp.
Elliott JP. 1989. Wolves and ungulates in British Columbia's northeast. In Wolf-prey dynamics and management. Proceedings. May 10–11, University of British Columbia. Vancouver, Canada. Wildl Working Report No. WR-40. BC Ministry of Environment, Victoria, BC.
Farnell R and RD Hayes. 1992. Results of wolf removal on wolves and caribou in the Finlayson study area, Yukon, 1983–92. Dep Ren Res Whitehorse, YK.
Farnell R, RD Hayes, and N Barichello. In preparation. Effects of reducing the number of wolves and human hunting on a population of caribou in the east-central Yukon from 1983–91.
Gasaway WC, RO Stephenson, JL Davis, PEK Shepherd, and OE Burris. 1983. Interrelationships of wolves, prey and man in interior Alaska. Wildlife Monographs 84:1–50.
Gasaway WC, RD Boertje, DV Grangaard, DG Kellyhouse, RO Stephenson, and DG Larsen. 1992. The role of predation in limiting moose at low densities in Alaska and Yukon and implications for conservation. Wildl Monogr 120:1–59.
Hatter DF. 1987. Perspectives on inventory of caribou in British Columbia. Spatsizi Association for Biological Research Rep No. 4. Wildlife Report No. R-14. BC Ministry of Environment, Victoria, BC. 93 Pp.
Hatter IW. 1984. Effects of wolf predation on recruitment of black-tailed deer on northeastern Vancouver Island. MS thesis, University of Idaho, Moscow. 156 Pp.
Hayes RD, AM Baer, and DG Larsen. 1991. Population dynamics and prey relationships of an exploited and recovering wolf population in the southern Yukon. Yukon Fish and Wildl Br Final Rep. TR-91-1. Whitehorse. 67 Pp.
Hayes RD. 1992. An experimental design to test wolf regulation of ungulates in the Aishihik area, southwest Yukon. Yukon Fish and Wildlife Branch. Whitehorse.
Hayes RD. 1995. Numerical and functional response of wolves, and regulation of moose in the Yukon. M.Sc. thesis., Simon Fraser University, Burnaby, British Columbia.
James FC and CE McCulloch. 1995. The strength of inferences about causes of trends in populations. Pp. 40–51 in TE Martin and DM Finch, Eds. Ecology and management of neotropical migratory birds: a synthesis and review of critical issues. Oxford University Press.
Jones G. 1985. Management of caribou in Spatsizi Plateau Wilderness park. In R Page, Ed. Caribou research and management in British Columbia. Proceedings of a workshop. BC Ministry of Forests, Research Branch, WHR-27, Victoria, BC. Southwest Yukon.
Keith LB. 1983. Population dynamics of wolves. Pp. 66–67 in LN Carbyn, Ed. Wolves in Canada and Alaska, Canadian Wildlife Service Report Series 45 . 135 Pp.
Kish L. 1987. Statistical design for research. Wiley, New York.
Larson DG, DA Gauthier, and RL Markel. 1989a. Causes and rate of moose mortality in the southwest Yukon. J Wildl Manage 53:548–557.
Larson DG, DA Gauthier, RL Markel, and RD Hayes. 1989b. Limiting factors on moose population growth in the southwest Yukon. Yukon Fish and Wildl. Br. Rep. Whitehorse. 105 Pp.
Larsen DG and RMP Ward. 1995. Moose population characteristics in the Frances Lake and North Canol areas. 1991. Yukon Fish and Wildlife Branch PR-95-1.
Marcstrom V, RE Kenward, and E Engren. 1988. The impact of predation on boreal tetraonids during vole cycles: an experimental study. J Anim Ecol 57:859-72.
Meier TJ, LD Burch, D Mech, and L Adams. 1995. Pack structure and genetic relatedness among wolf packs in a naturally regulated population. Pp. 293–302 in LN Carbyn, SH Fritts, and DR Seip, Eds. Ecology and conservation of wolves in a changing world. Canadian Circumpolar Institute, Occasional Publication No. 35, Edmonton.
Messier F. 1985. Social organization, spatial distribution and population density of wolves in relation to moose density. Can J Zool 63:1068–1077.
Miller SD, and WB Ballard. 1992. Analysis of an effort to increase moose calf survivorship by increased hunting of brown bears on south-central Alaska. Wildlife Society Bulletin 20:445–454.
Moses LE and F Mosteller. 1995. Experimentation: Just do it! Manuscript.
Oldemeyer JL, AW Franzmann, AL Brundage, PD Arneson, and A Flynn. 1977. Browse quality and the Kenai moose population. J Wildl Manage 41:533–542.
Peterson RO and JD Woolington. 1982. The apparent extirpation and reappearance of wolves on the Kenai Peninsula, Alaska. Pp. 334–344 in FH Harrington and PC Paquet, Eds. Wolves of the world. Noyes Publ, Park Ridge, NJ.
Peterson RO, JD Woolington, and TN Bailey. 1984. Wolves on the Kenai Peninsula, Alaska. Wildl Monogr 88:1–52
Reid R and D Janz. 1995. Economic evaluation of Vancouver Island wolf control. Pp. 515–521 in LN Carbyn, SH Fritts, and DR Seip, Eds. Ecology and conservation of wolves in a changing world. Canadian Circumpolar Institute, Occasional Publication No. 35, Edmonton.
Schwartz CC and AW Franzmann. 1991. Interrelationship of black bears to moose and forest succession in the northern coniferous forest. Wildl Monogr 88:1–52
Spencer DL and JB Hakala. 1964. Moose and forests on the Kenai. Tall Timbers Fire Ecology Conf 3:11–33.
Stewart RR, EH Kowal, R Beaulieu, and TW Rock. 1985. The impact of black bear removal on moose calf survival in east-central Saskatchewan. Alces 21:403–418.
Theberge JB. 1990. Potentials for misinterpreting impacts of wolf predation through prey: predator ratios. Wildl Soc Bulletin 18:188–192.
Theberge JB and DA Gauthier. 1985. Models of wolf-ungulate relationships: when is wolf control justified? Wildl Soc Bulletin. 13:449–458.
Van Ballenberghe V. 1981. Population dynamics of wolves in the Nelchina basin, south-central Alaska. Pp. 1246–1258 in JA Chapman and D Pursley, Eds. Proceedings of the Worldwide Furbearer Conference, Worldwide Furbearer Conference, Inc., Frostburg, MD.
Van Ballenberghe V. 1985. Wolf predation on caribou: the Nelchina herd case history. J Wildl Manage 49:711–720
Van Ballenberghe V. 1989. Wolf predation on the Nelchina caribou herd: a comment. J Wildl Manage 53:243–250
Van Ballenberghe V. 1991. Forty years of wolf management in the Nelchina basin, south-central Alaska: a critical review. Transactions of the North American Wildlife and Natural Resources Conference 56:561–566.
Walters CJ, M Stocker, and GC Haber. 1981. Simulation and optimization models for a wolf-ungulate system. Pp. 317–337 in CW Fowler and TD Smith, Eds. Dynamics of large mammal populations. John Wiley and Sons, NY.
Whitten KR, GW Garner, FJ Mauer, and RB Harris. 1992. Productivity and early calf survival in the porcupine caribou herd. J Wildl Manage 56:201–212.
Yukon Fish and Wildlife Branch. 1994. An evaluation of calf survival in the Aishihik caribou herd, Southwestern Yukon.
Yukon Fish and Wildlife Branch. 1996. Summary of wildlife information Aishihik-Kluane caribou recovery program.