Evaluating Traffic Safety Campaigns: A Guide (2025)
Chapter: 5 Naturalistic Driving Studies

CHAPTER 5
Naturalistic Driving Studies
Naturalistic driving studies (NDSs) can be useful in evaluating the effectiveness of traffic safety campaigns by monitoring driverʼs real-world behavior over time without interference (i.e., during their day-to-day driving). These studies use in-vehicle data-collection tools, such as cameras, sensors, and GPS, to capture continuous participant driving. By comparing driving behaviors before and after a safety campaign, researchers can assess changes in key safety metrics, like speed adherence, seatbelt use, or responses to hazardous conditions. NDSs also allow for the examination of how environmental factors, such as road type, weather, and traffic density, interact with campaign messaging to influence driver behavior. This comprehensive data helps determine whether a campaign has effectively changed actual driving behavior and provides insights into specific conditions under which the campaign was most impactful. The quick reference guide for using the NDS costing tool is available in BTSCRP Web-Only Document 7.
Staffing
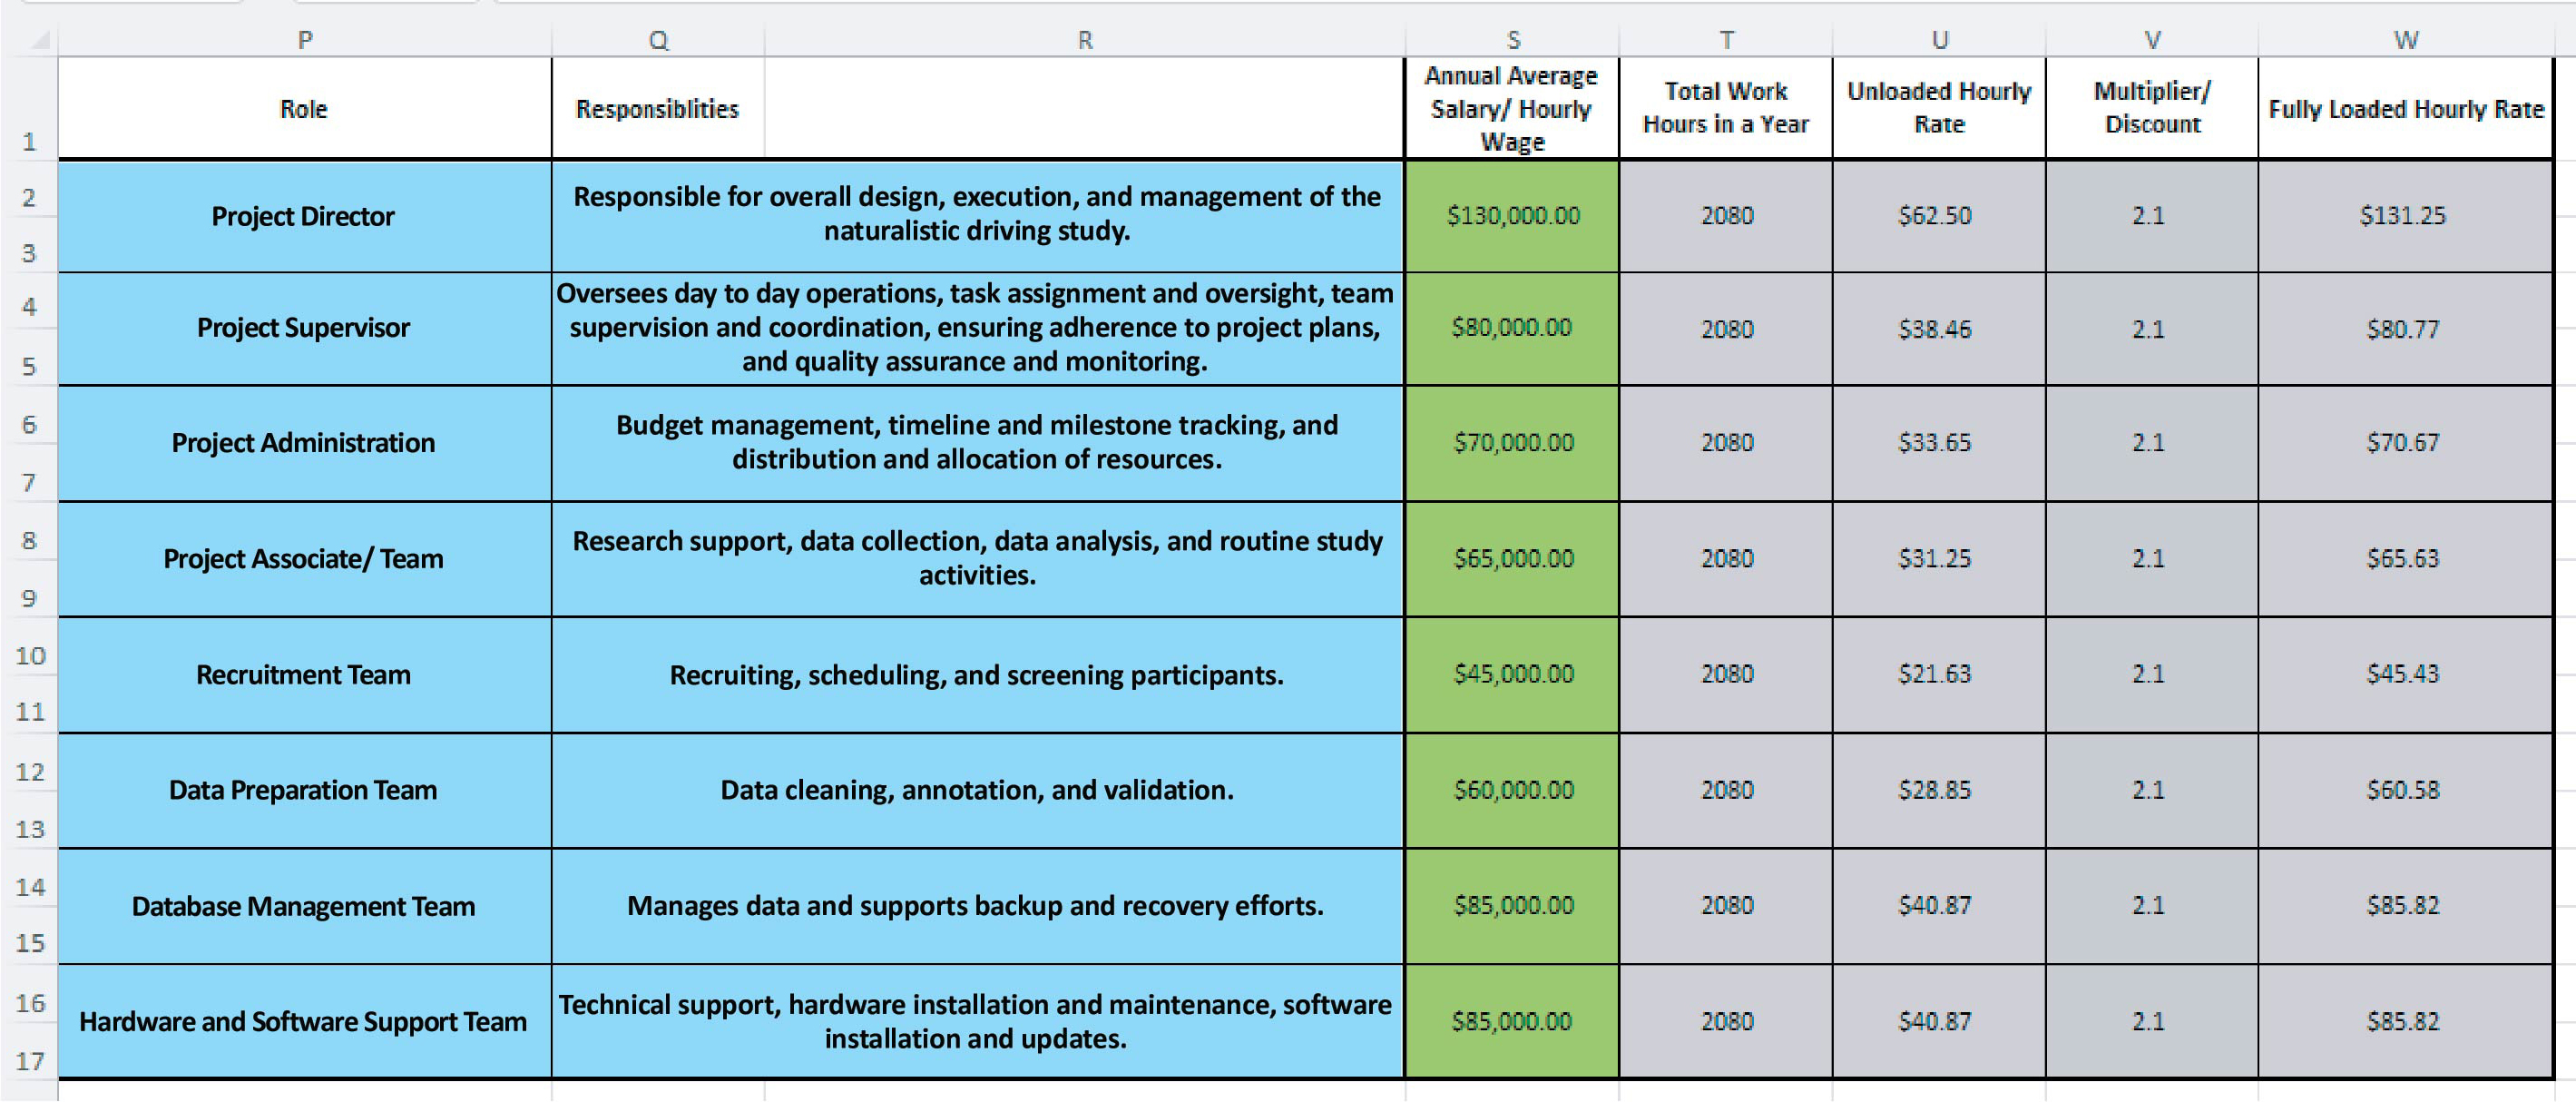
Staffing salaries in the salary role table were calculated from rounded averages based on state and national employee salary numbers. Salaries for each role are found in Cells P1 descending to W17 (Exhibit 5.1). These cells are then divided by total work hours in a year (Column T), to find the unloaded hourly rate (Column U), then use the multiplier/discount (Column V) to calculate the fully loaded hourly rate (Column W) based on a multiplier/discount used to calculate fringe benefits or other costs incurred for salaries. The calculated salaries are then automatically applied to the labor hours specified for each task in the main spreadsheet to generate costs in Column K (Exhibit 5.2), which are then automatically added and input into the cost breakdown table located in Columns P and Q between Rows 33 and 43 (Exhibit 5.3).
The following are explanations of roles shown in Exhibits 5.1 and 5.3.
- Project Director. The project director plays a crucial role in overseeing the complex coordination of real-world, in-vehicle data collection. This role includes strategic planning for data acquisition, making sure that all installations, timelines, and logistics align with project goals and safety standards. They collaborate closely with stakeholders to outline study objectives and ensure compliance with legal, ethical, and budgetary requirements. Additionally, the project director manages risk in data collection and participant interactions, implementing safeguards and protocols to address any potential issues on the road.
- Project Supervisor. The project supervisor coordinates day-to-day operations, focusing on the logistics of data acquisition system (DAS) installations, participant scheduling, and ongoing data collection in real-world driving conditions. This role includes close coordination with field teams to manage participant onboarding, vehicle installation schedules, and the troubleshooting of any technical or logistic challenges. The supervisor ensures all equipment and data meet quality standards and that the project remains adaptable to on-the-ground challenges, like varying traffic conditions or weather impacts on data collection.
Long Description.
The column headers under columns P through W are role, responsibilities, annual average salary or hourly wage, total work hours in a year, unloaded hourly rate, multiplier or discount, and fully loaded hourly rate. The data are given from rows 2 to 17.
Long Description.
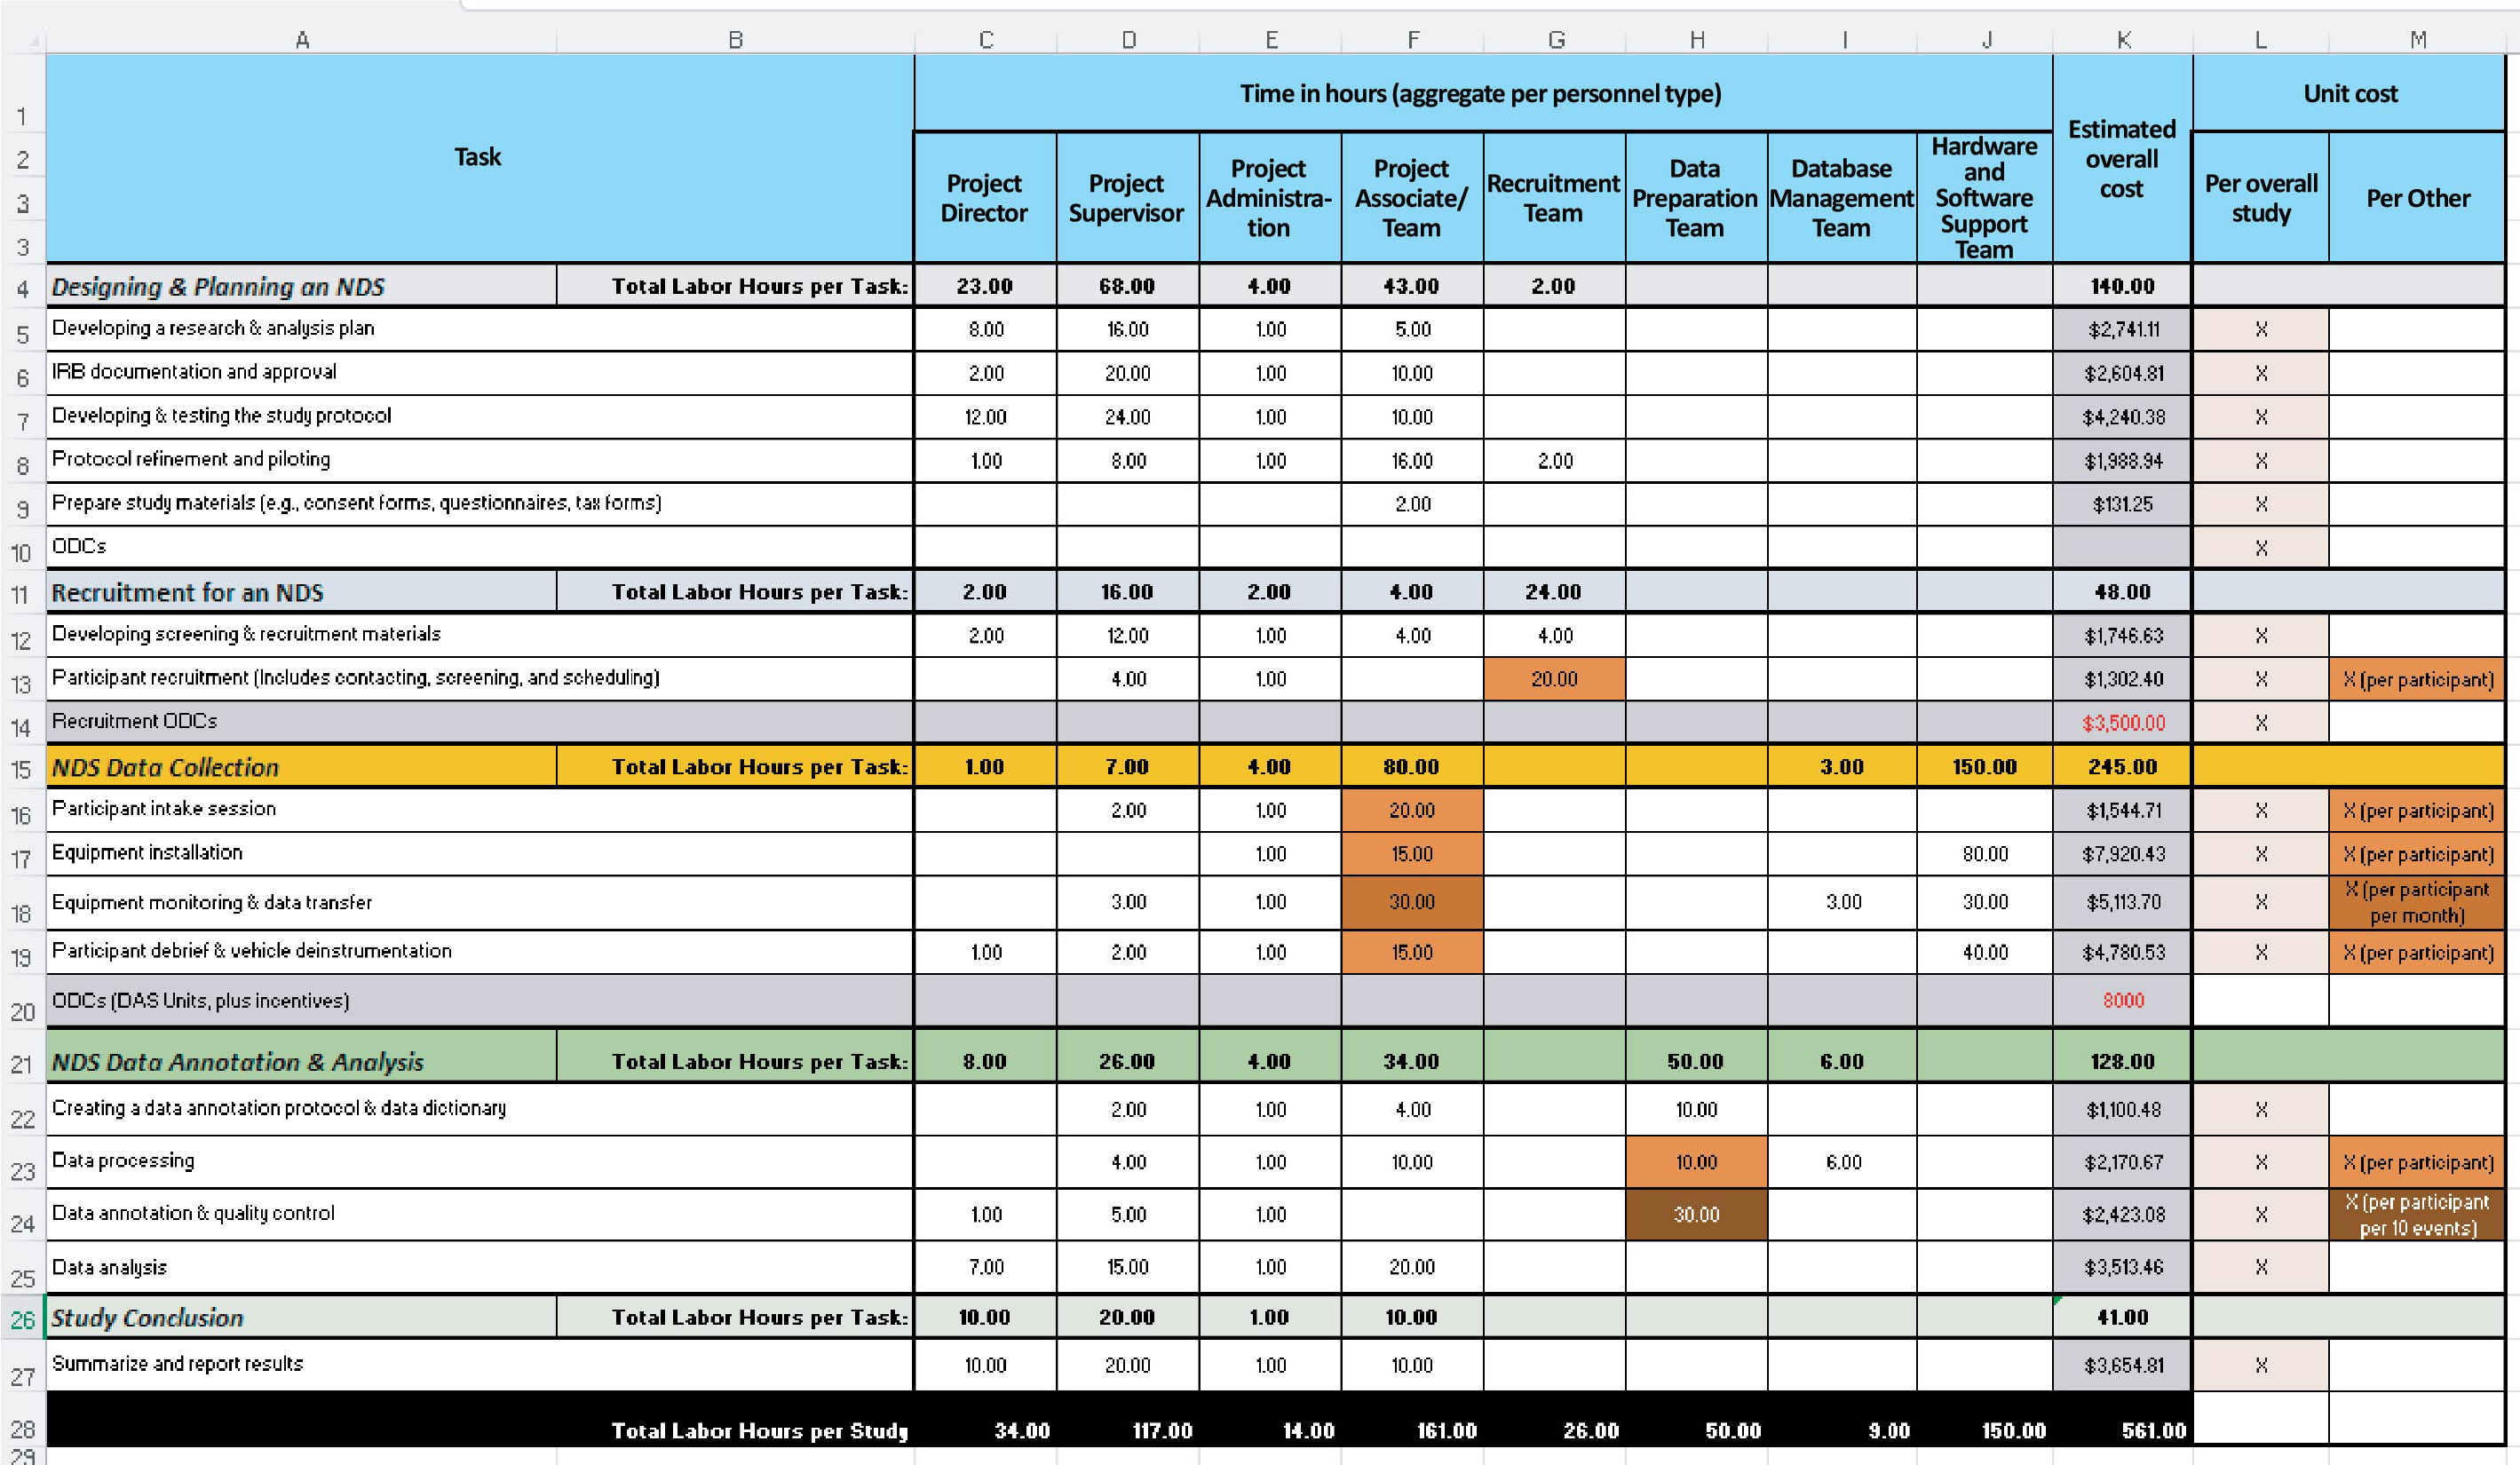
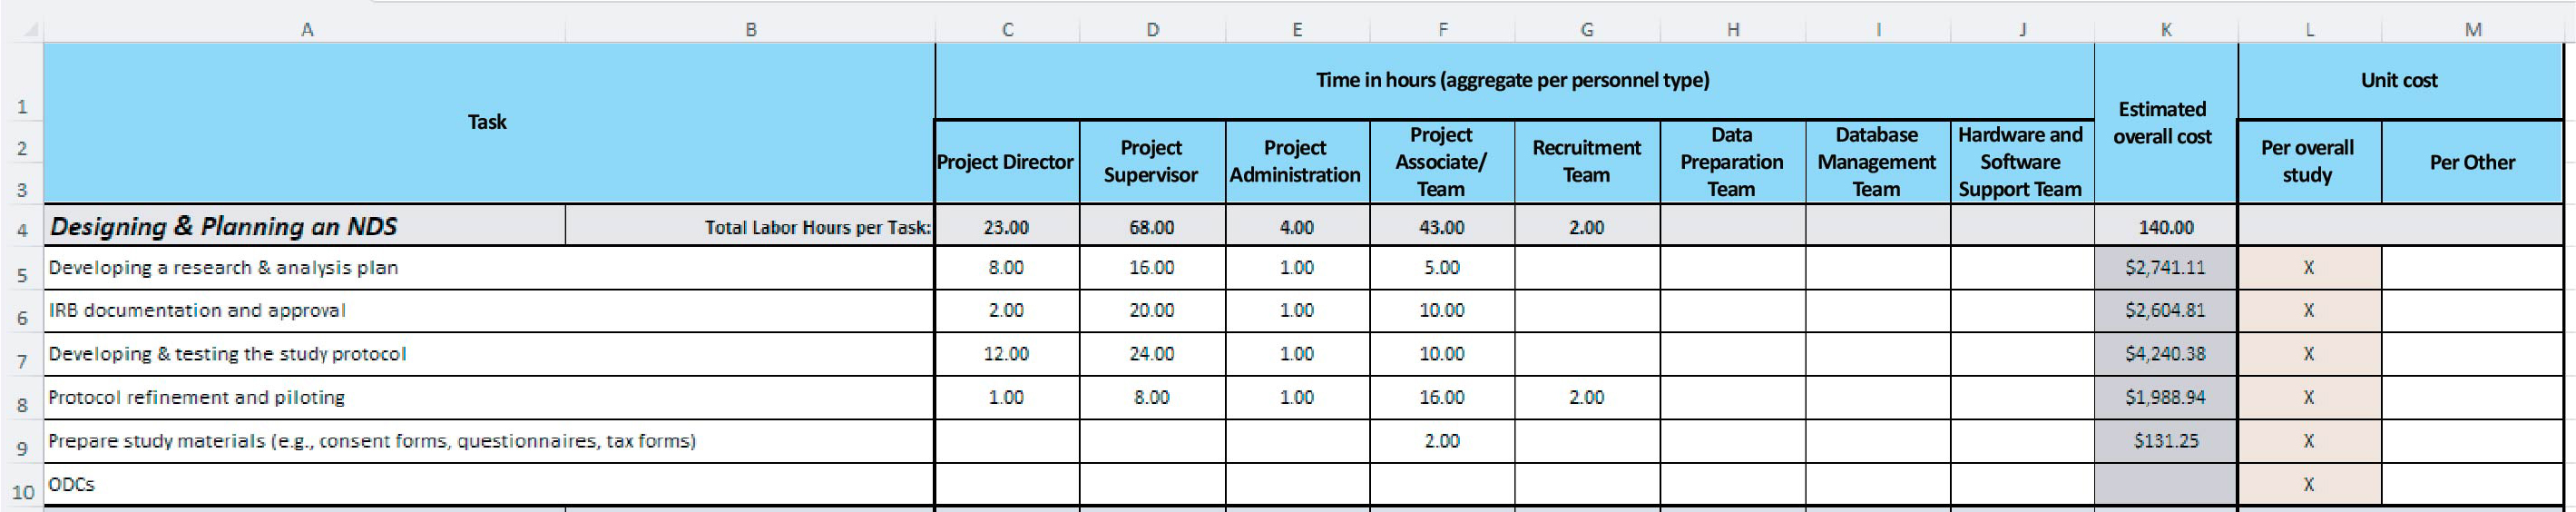
The column headers are task, time in hours, estimated overall cost, and unit cost. The 8 sub-headers under time in hours are titled project director, project supervisor, project administration, project associate team, recruitment team, data preparation team, database management team, hardware and software support. The two sub-headers under the unit cost are titled per overall study and per other. The headers in rows 4, 11, 15, 21, and 26 are designing and planning an NDS, recruitment for an NDS, NDS data collection, NDS data annotation and analysis, and study conclusion. Each header lists the total labor hours per task. Total labor hours per study is provided at the end of the sheet.
Long Description.
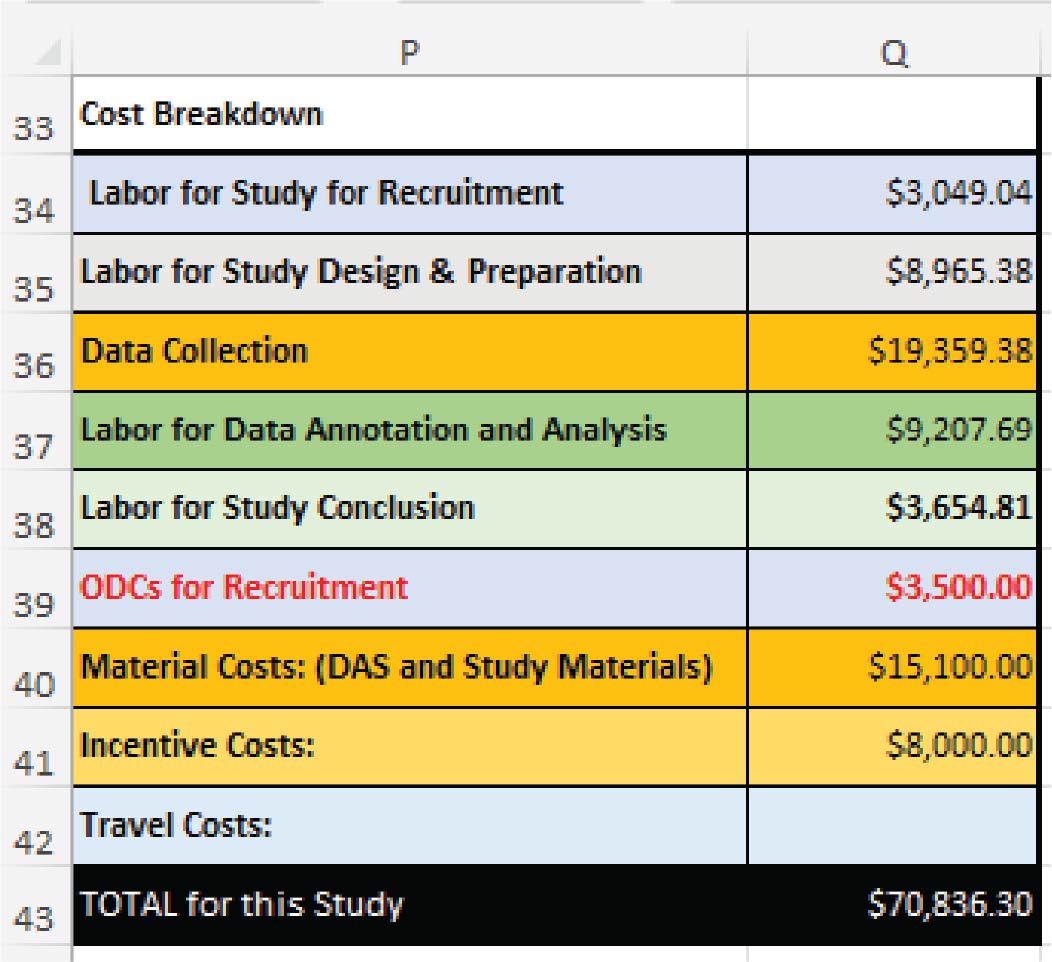
The column headers in columns P and Q are cost breakdown and cost. The data are provided from rows 34 to 43.
- Project Administrator. The project administrator provides support through careful management of participant documentation, communication, and logistics. They maintain detailed records of participant interactions, including scheduling, consent forms, and payment tracking, to ensure a seamless experience for participants. Additionally, the administrator coordinates internal communication among teams to keep everyone informed of progress and any changes in scheduling or protocol. The project administrator is given an estimated 1 hour of work per task to maintain budget and project tracking tasks, Row E (Exhibit 5.2).
- Project Associate/Team. Project associates support field operations, including DAS installation and data-collection setup. They are trained to work with sophisticated data acquisition systems and might assist with troubleshooting and calibrating equipment in vehicles. They also support the research team by monitoring data quality and assisting with early-stage data organization. Their on-the-ground presence is essential for maintaining the reliability and continuity of data collection.
- Recruitment Team. The recruitment team identifies, contacts, and screens potential participants who fit the studyʼs demographic and behavioral criteria. They design and implement targeted recruitment strategies, like using social media advertisements, to attract a diverse sample. Their responsibilities include screening participants, answering questions about the study, and managing onboarding logistics. They work closely with participants throughout the recruitment process to ensure a strong and reliable study sample.
- Data Processing Team. The data processing team handles complex datasets involving video, sensor data, and GPS coordinates. They are responsible for data cleaning, quality checks, and preparing the data for analysis, often integrating multiple data streams into a cohesive dataset. This team ensures all data is accurate and ready for behavioral analysis, playing a key role in maintaining data integrity and usability throughout the project.
- Database Management Team. The database management team ensures the secure and efficient handling of vast amounts of data collected from in-vehicle systems. They manage database architecture, data storage, and retrieval systems to support continuous data input from multiple sources. This team also implements security measures to protect participant data and ensures the database infrastructure can support real-time data uploads and regular backups.
- Hardware and Software Team. The hardware and software team manages the technical aspects of in-vehicle data systems, making sure that hardware components are correctly installed and software functions as expected. They handle troubleshooting, maintenance, and updates of both hardware and software, making sure all systems function smoothly. Their expertise is critical for managing real-time data-collection technology and maintaining the functionality of DAS units throughout the study.
Other Direct Costs
ODCs might include subscription services like comma ai, equipment, software, and any non-labor expenses directly related to the study. These costs will vary based on the specific requirements of the study and the organizationʼs available non-labor resources. When conducting an NDS, use of advertisements might be needed for participant recruitment. When inputting costs in the costing tool for advertisements, it is important to input the number of social media advertisements (Column R, Row 20), the cost per ad on social media (Column R, Row 21), and the number of days the advertisements will be available (Column R, Row 22). All these costs factor into the overall cost for NDS recruitment (Exhibit 5.4).
The main material costs for an NDS are the DASs and other material costs like paper, pen, and other consumables. The DAS cost is a direct input, per unit, (Column R, Row 23) that will then use the number of vehicles/participants (Column R, Row 27) to calculate the cost for the study. Study material costs will be input to give a cost estimate for required consumables for the study.
Travel
Travel costs vary depending on factors like location, distance, mode of transportation, and number of travelers. Options like flights or rental cars might incur greater costs, while trains, buses, or personal vehicles might reduce costs. Depending on the governing body or business policies, the company might be required to pay mileage or other costs for researchers taking a personal vehicle. In addition, employers will likely be required to pay for researchersʼ meals (i.e., daily per diem), which can vary based on the destination (i.e., cities such as Washington, DC, have a higher per diem rate than small towns due to the difference in cost of living in cities).
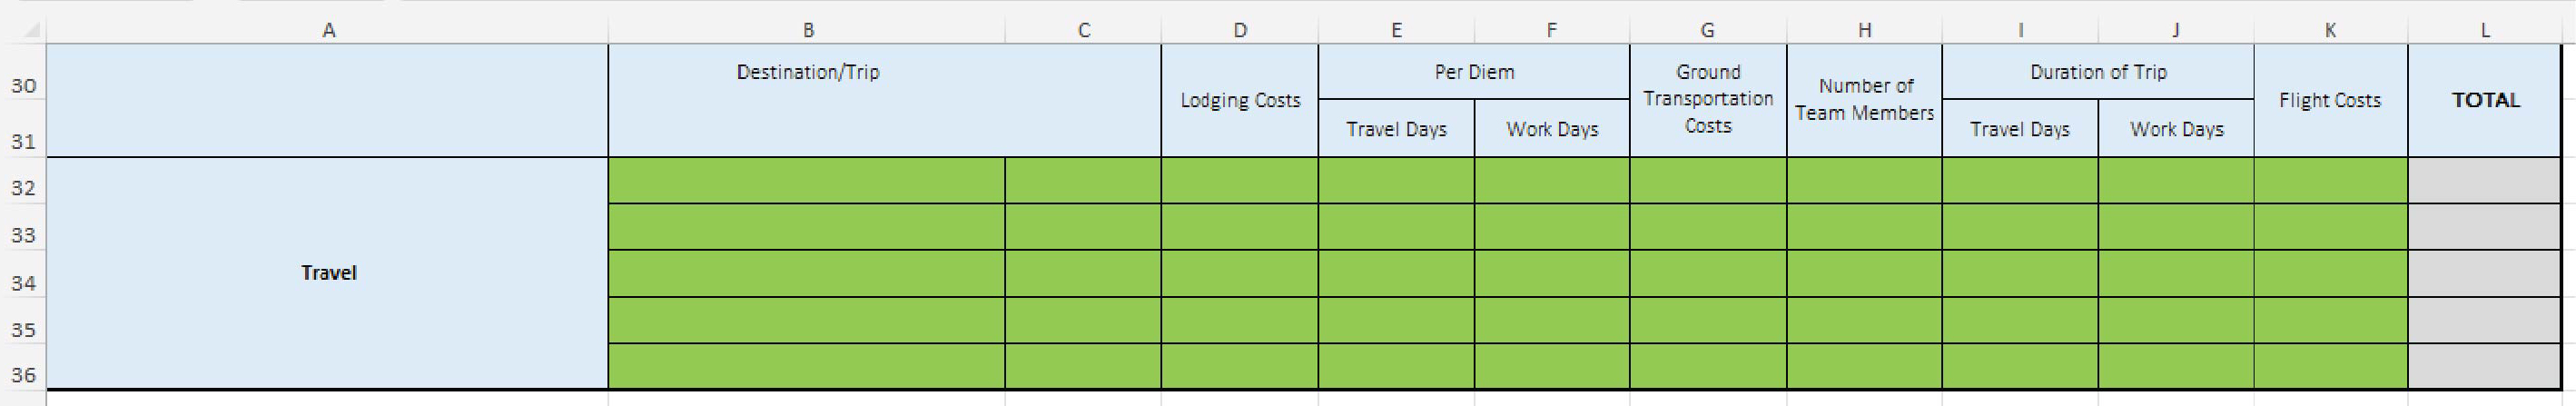
To use the costing tool, a variety of fields must be filled out (Exhibit 5.5). Costs like lodging (per day), ground transportation costs (rideshare, bus, parking fees, or other transportation costs), and per diem costs must be input into the costing tool. These costs, where applicable, are then multiplied by travel days, workdays, and the number of team members to calculate total travel costs.
Travel-related expenses include items such as lodging, ground transportation, and per diem rates, in the travel sections provided in each study type sheet. Travel costs for overnight travel to destinations greater than 50 miles can be input in Rows 30–36 of Columns B–K as described and shown in (Exhibit 5.5):
- Destination/Trip (Column B/C): Location of travel destination.
- Lodging Costs (Column D): Cost of hotel, or other overnight accommodation.
- Per Diem (Columns E/F): Number of days for the trip.
- Travel Days (Column E): In most cases, this will be two assuming that the traveler will be returning to the location of origin.
- Work Days (Column F): Number of days for which data collection is planned (not counting travel days if there is overlap).

Long Description.
The column headers from columns P through U are cost factors, notes, fillable fields, calculations, and notes. The data are provided from rows 20 to 31.
Long Description.
The column headers from columns B through L are destination or trip, lodging costs, per diem with sub-headers travel days and work days, ground transportation cost, number of team members, duration of trip with subheaders travel days and work days, flight cost, and total. The entire data-sheet is empty.
- Ground Transportation Costs (Column G): Includes any costs associated with travel in a vehicle, such as parking, gas, and mileage reimbursement.
- Number of Team Members (Column H): How many people are traveling?
The travel values input will be used to calculate the total travel cost for each trip in the corresponding cell in Column L. The total for all trips will be combined and reported in Cell Q42.
Steps for Conducting an NDS
To measure the effectiveness of traffic safety messaging campaigns using an NDS, a series of steps must be followed. Development of the study design and approval or clearance to collect data must be carried out. The next steps involve participant recruiting and arrangement of logistics for those participants, data collection, and data analysis and reporting.
Step 1: Designing and Planning an NDS
To design an NDS focused on evaluating traffic safety campaigns, a clear research and analysis plan needs to be developed with campaign-specific goals, aims, and research questions. These questions should focus directly on assessing the campaignʼs effectiveness in changing driver behaviors. This phase must outline the specific data to be collected (e.g., driver reaction times, adherence to road safety laws, and instances of risky driving behaviors), and how each data point will address the studyʼs objectives or hypotheses related to campaign impact. Overall, the labor hours given in the costing tool for Designing and Planning an NDS remain constant (Exhibit 5.6), regardless of other parameters, such as NDS sample size and duration. Each task involves planning and small-scale efforts, which would be less dependent on changing variables than other tasks.
The study plan should detail the methodology for data collection, covering tools like in-vehicle sensors, video recording, and GPS tracking that will provide real-time data on driver behavior. This setup must also define analysis techniques, like comparative analysis of pre- and post-campaign behaviors, or assessing trends over time to determine sustained behavioral change. Once the study framework is outlined, the research protocol needs to be prepared for review by a relevant safety or ethics board, like an IRB. Following approval, protocol refinement might involve tailoring data-collection methods to fit the limitations of the DAS and the specific goals of the traffic safety campaign. Refinement might also address logistic challenges, like the duration and frequency of data collection, making sure that the study balances thoroughness with the participantsʼ convenience and safety.
Before full implementation, a pilot study can be conducted to test the protocolʼs feasibility in capturing meaningful, high-quality data specific to campaign assessment. This pilot phase is critical for identifying any protocol or data-collection issues that could compromise campaign evaluation, and adjustments made here might require reapproval by the ethics board. Any issues found during piloting need to be corrected in study materials (e.g., consent forms, protocols, questionnaires), and updated study materials can be prepared for the onset of data collection.
Step 2: Recruitment for an NDS
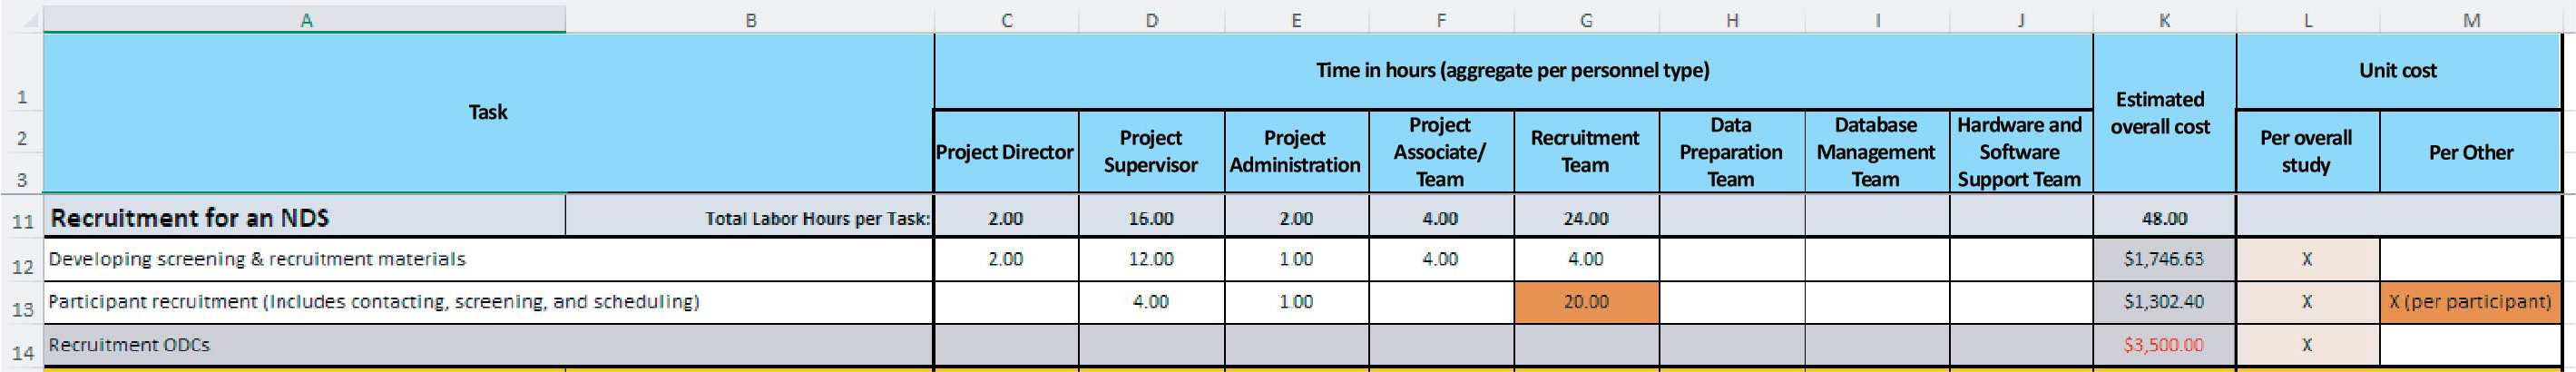
When beginning study recruitment, the first step is identifying the participant sample demographics. It is important to make sure there is a diverse study sample that aligns with addressing the research goals or questions. Factors like gender, age, driving experience, feature usage, and vehicle types are important to account for to have a study sample that is generalizable to the public population. To account for, organize, and identify these factors a screening form and other recruiting documents must be created. The screening form will create an organized set of requirements that will establish participant eligibility based on the requirements set forth by the
Long Description.
The column headers are task, time in hours, estimated overall cost, and unit cost. The 8 sub-headers under time in hours are titled project director, project supervisor, project administration, project associate team, recruitment team, data preparation team, database management team, hardware and software support. The two sub-headers under the unit cost are titled per overall study and per other. The header given below is designing and planning an NDS. The data are provided from rows 5 to 10.
research team. Next, is creating materials to contact participants, whether they are advertisements for social media, fliers, or other means of communicating possible participants. Development of these materials is considered a non-scalable cost as they are used across the study and are not based on study size, duration, or other factors.
Recruitment costs are found in the cost factors table in Columns P–U, in Rows 20–22 (Exhibit 5.4).
Cell R20 allows the user to input the number of social media advertisements used. Typically, between one and three advertisements are used based on study parameters such as targeted demographics. In some cases, different advertisements will be made to identify different age or gender populations. Cell R21 allows the user to input the cost per social media advertisement, which is often around $150 to $250 per day; however, these costs can be variable based on the social media platform used, number of views desired, and how long those views take to achieve. Cell R22 allows the user to input the number of days the advertisement will run. Cells R20, R21, and R22 are then multiplied together to give the overall cost for recruiting shown in Cell Q34 in the cost breakdown table (Exhibit 5.3). Once contacted and screened as eligible, participants need to be scheduled.
This costing tool requires the user to input the sample size to establish recruiting costs. Sample size (Cell R25) is a direct input variable that is used in calculations for recruitment costs (Exhibit 5.7) as the greater number of participants requires a larger number of individuals to be recruited and screened for eligibility (Cell G13).
Incentives
Incentives or payments to participants are an important cost to an NDS and are shown in the cost factors table in Columns P–U and Rows 28–31 (Exhibit 5.4). Incentives are often distributed in installments across the duration of the study. The first payment (Cell R28) is usually distributed during the initial interaction with the participant like installation, the informed consent session, or other initial interaction, which takes on average 2 hours. Commonly, the incentives for participants are $50 an hour, which is reflected in the costs given in the costing tool. Payments during data collection (Cell R29) can be distributed in installments set forth by the research team or during monthly check-ins as the study progresses, for $100 per month. The final payment (Cell R30) to participants is then typically given after data collection concludes, like at deinstallation or debriefing, which takes an estimated 2 hours of the participantʼs time at $50 per hour.
A variety of tasks need to be completed during the latency period between recruiting and data collection. During this time, the data acquisition systems must be acquired, then any preparations for installation must be planned or completed, and installations must be scheduled. During this time any paperwork like informed consent, tax documents for payment, other payment needs, or other required paperwork must be created and organized. To save time and effort at the end of the study, documents that organize metrics of data collection like participant numbers, progress of data collection, and any documented problems as well as files to assist with data reduction and analysis can be created. This also allows time for document iteration and addressing any discrepancies in collection and analysis, like incorrect variable names or issues with data ingesting. Furthermore, if possible, installation of the DAS into a test vehicle where researchers can briefly collect, ingest, and review collected data might be beneficial to verify that the correct and valid data is being collected.
Step 3: NDS Data Collection
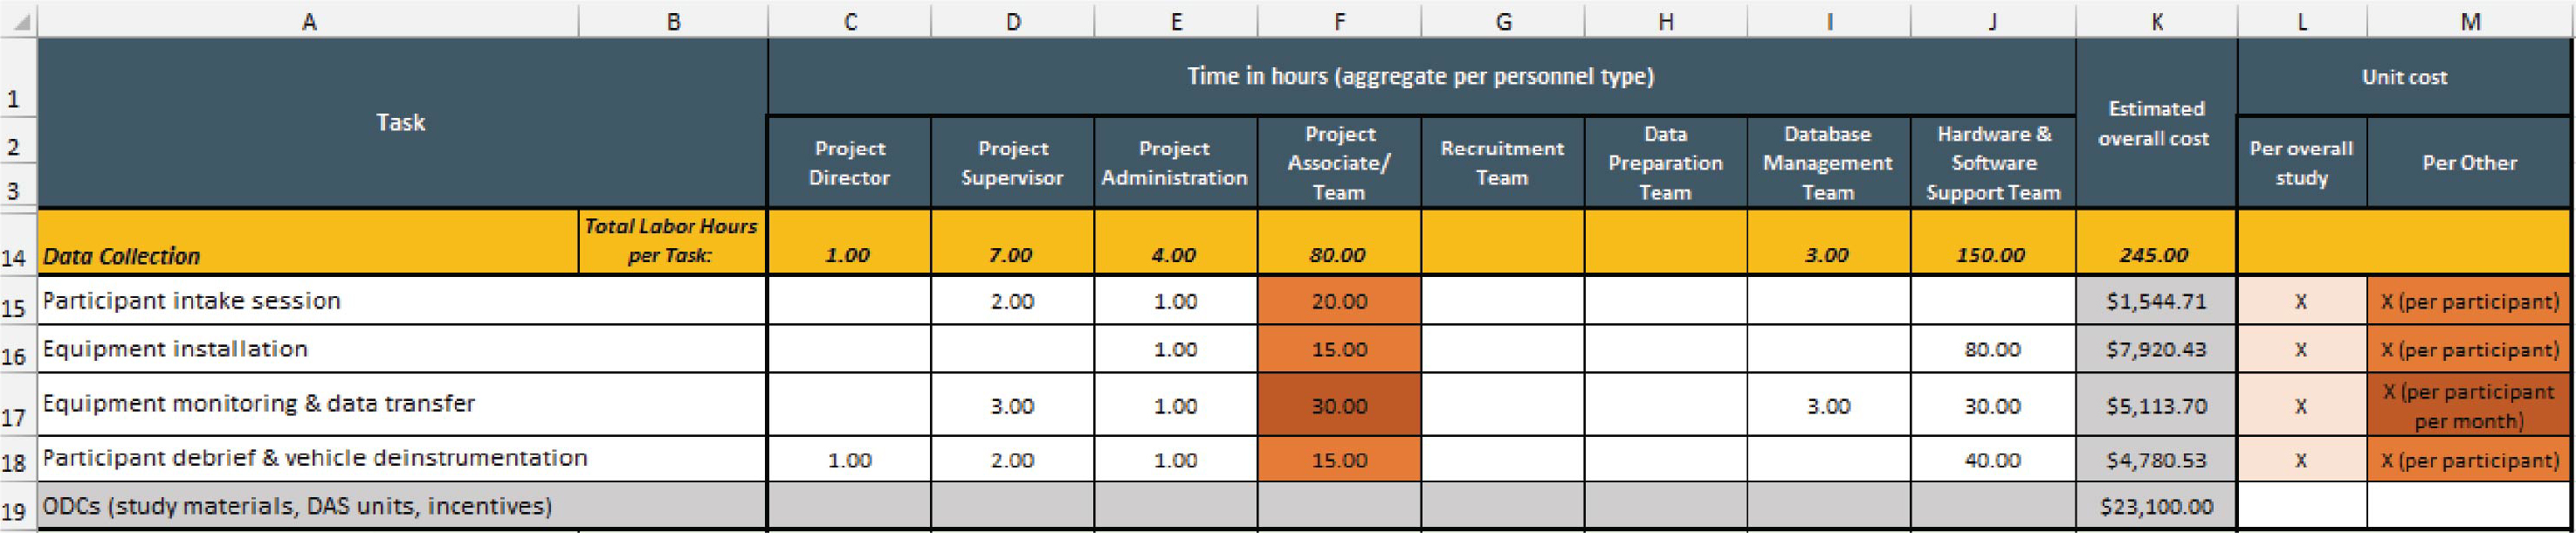
Data collection commences with the participant intake session. The intake session can be done in person or remotely using video conferencing software. During this session, researchers
Long Description.
The column headers are task, time in hours, estimated overall cost, and unit cost. The 8 sub-headers under time in hours are titled project director, project supervisor, project administration, project associate team, recruitment team, data preparation team, database management team, hardware and software support. The two sub-headers under the unit cost are titled per overall study and per other. The header given below is the recruitment of an NDS. The data are provided from rows 12 to 14.
will require the participantsʼ driverʼs license to verify their identity and ensure they have a valid driverʼs license. During the intake session, researchers typically collect demographic data like age, race, ethnicity, and gender as well as different driving experiences, like technology or safety feature experience. The intake session also allows the researcher to explain the purpose of the study, requirements of participation, what is being collected, the duration of data collection, participantʼs rights, and incentives. If research is being conducted at an academic institution, these details will be covered in the informed consent form. Throughout the study, the project supervisor should maintain contact with the project associate and team to oversee progress, but in a minimal role (Cells D16, D18, and D19) (Exhibit 5.8).
Once the intake session is complete, the DAS will be installed in the participantʼs vehicle. Installation is completed by the hardware and software support team. Time for installation is estimated at 8 hours per DAS and is automatically scaled by the number of participants in the study, Cell J17 (Exhibit 5.8). A project associate will also need to be available during equipment installation with an estimated 90 minutes required per participant and scaled by the number of participants, Cell F17 (Exhibit 5.8).
As data collection begins and continues through the duration of the study, researchers must monitor the health and progress of the data collected. It is best practice to monitor data collection as closely as possible to reduce the risk of data loss and increase the likelihood of collecting valid data. The project supervisor will help in an advisory role to the research team with an estimated 30 minutes required per month of data collection Cell D18 (Exhibit 5.8). During data collection, the project team will be required for 30 minutes, which is scaled by the number of months and number of participants in Cell F18 (Exhibit 5.8) for reconsenting, participant interactions, and incentive payments. Similarly, the hardware and software team and data management team will also require 30 minutes scaled by the number of months of data collection with the addition of the hardware and software teamʼs time also being scaled by the participant number Cell J18 (Exhibit 5.8).
After data collection is completed, the DAS with the required hardware and software needs to be removed and participants need to be debriefed. Similar to installation, each DAS needs to be removed by the hardware and software team, which is estimated to take 4 hours (Exhibit 5.8). Researchers also typically schedule a 90-minute debriefing session per participant, Cell F19, which can be conducted virtually or in person. During this time, the final incentive payment will be distributed. Often both de-installation and debriefing are done in parallel to reduce the time required of researchers and participants. During this final subtask of data collection, the project director, Cell C19, and project supervisor, Cell D19, will oversee data-collection completion in an advisory role, with 1 and 2 hours allocated, respectively.
It is important to note that the recruitment team may be involved with scheduling times and have interactions with participants throughout the data-collection process. The costing tool does not reflect this in the NDS Data Collection section as it is embedded in the time needed under the recruitment for an NDS task and is scaled along with other time factors as participant number increases.
Step 4: NDS Data Annotation and Analysis
Analyzing the data involves processing large amounts of real-world data to gain insights into driver behavior. This type of data often includes video recordings, vehicle sensor data (like accelerometer and pedal position), GPS location, and contextual factors like weather, road type, and traffic conditions, providing a comprehensive view of driving behaviors that may have been influenced by safety campaigns. One of the first challenges in analyzing NDS data is managing
Long Description.
The column headers are task, time in hours, estimated overall cost, and unit cost. The 8 sub-headers under time in hours are titled project director, project supervisor, project administration, project associate team, recruitment team, data preparation team, database management team, hardware and software support. The two sub-headers under the unit cost are titled per overall study and per other. The header given below is NDS data collection. The data are provided from rows 16 to 20.
the massive data volume, often collected continuously over long durations, resulting in extensive video footage and sensor data. Thus, a critical step is creating a data annotation protocol and data dictionary, where members of the entire research team (i.e., project supervision, project team, data processing, and data management teams) work to create a document that specifies how data should be annotated, what metrics are annotated, and what each of the variables are (Cells D22–F22 and H22) (Exhibit 5.9). During this time, specific events related to safe and/or risky driving behaviors—like vehicle speed, vehicle following distances, seatbelt usage, or reactions to hazardous situations—are identified.
Automated algorithms are commonly used to detect these behaviors, but manual verification is often necessary to ensure accuracy, especially for nuanced actions like appropriate responses to pedestrian crossings or yielding.
Next, data must be processed (Exhibit 5.9). For this task, the project supervisor keeps an advisory role (Cell D23) and the project team will work with a non-scaled time requirement (Cell F23). The project team will communicate with the data processing and database management teams during data processing. Data preparation is scaled by the number of participants and the duration of the data collection (Cell H23), and the database management teamʼs time is non-scaled (Cell I23).
NDS data is inherently multimodal, meaning it encompasses varied data streams of events, including video, telemetry, GPS, and potentially biometric indicators (like eye movements or heart rate if available). To analyze the impact of a safety campaign, researchers typically integrate these data streams to capture a complete picture of changes in driving behavior. For instance, GPS data combined with video can reveal how campaign messaging impacts driver actions at intersections or in school zones. Similarly, telemetry data can indicate whether drivers are more cautious following campaign exposure (e.g., by reducing speed in adverse weather conditions or applying brakes more gradually in heavy traffic). Video of the driverʼs face/eyes can also be analyzed to identify distracted or drowsy driving behavior to determine whether these risky behaviors are less prevalent following campaign exposure.
Once data processing is completed, the project director and project supervisor have non-scaled allocated time where they oversee data annotation and QC (Cells C24 and D24). During this time, the project team completes the majority of the time allocation that is scaled by the number of events and the number of participants, Cell H24 (Exhibit 5.9). The greater detail in identified events, such as driving behaviors mentioned in the previous paragraph, requires more time. Analyzing this integrated data enables researchers to evaluate the direct influence of a traffic safety campaign on driver decision-making in real time, providing valuable insights into which behaviors are positively affected and under what conditions. By aligning these findings with campaign goals, researchers can quantify campaign impact, assess its real-world effectiveness, and identify areas where messaging might need refinement to achieve desired safety outcomes. Data analysis is completed with the project director (Cell C25) and project supervisor (Cell D25) guiding the project team (Cell F25) through the analysis process (Exhibit 5.9). These times are non-scaled as this process generally requires similar time and effort with minimal changes from data size.
Study Conclusion
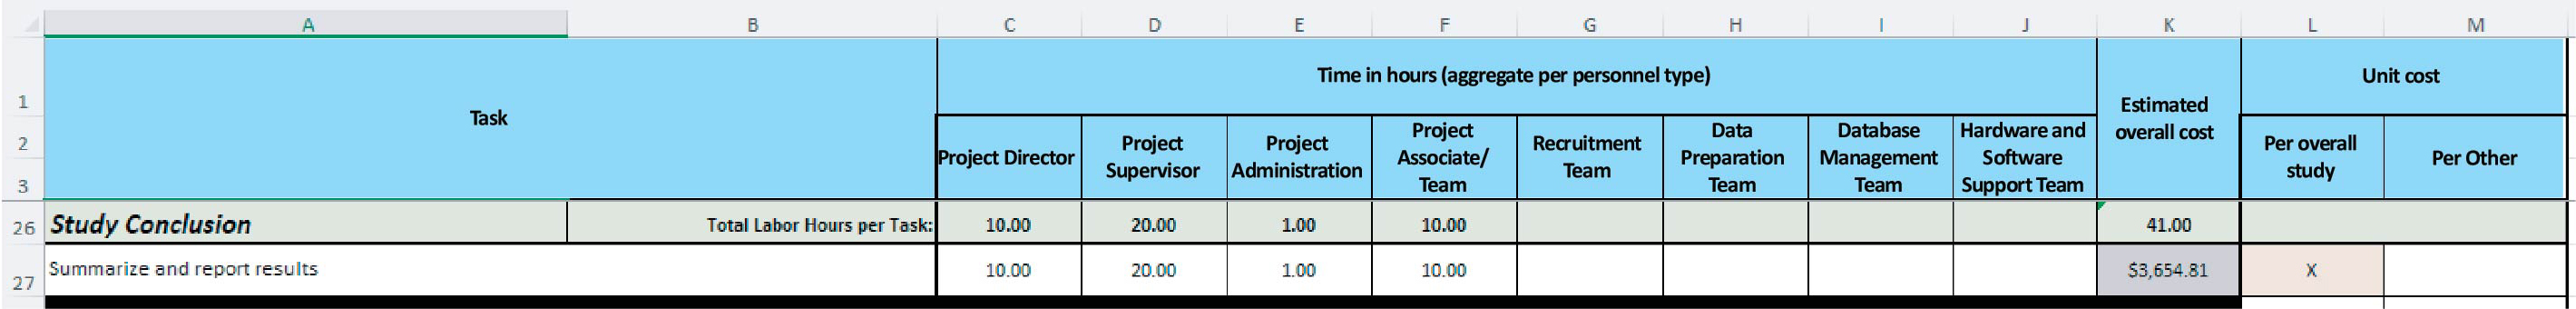
Reporting the study outcomes and conclusions provides a narrative that contextualizes the findings from the results of extensive data analysis, linking specific behavioral changes to campaign elements and situational factors (like road type or traffic density) to give a complete picture of campaign effectiveness (or lack thereof). Where applicable, case studies of notable driving events

Long Description.
The column headers are task, time in hours, estimated overall cost, and unit cost. The 8 sub-headers under time in hours are titled project director, project supervisor, project administration, project associate team, recruitment team, data preparation team, database management team, hardware and software support. The two sub-headers under the unit cost are titled per overall study and per other. The header given below is NDS data annotation and analysis. The data are provided from rows 22 to 25.
(e.g., incidents where drivers exhibited heightened caution in response to campaign themes or significant changes in the prevalence of risky driving behaviors) are highlighted to add depth to quantitative data. Clear, actionable reporting ensures stakeholders, like policymakers, campaign developers, and safety organizations, understand the studyʼs outcomes and can make informed decisions about future interventions aimed at improving road safety. Often in this process, the project team (Cell F27) will provide a significant allocation to complete the summary and reporting of results, which is overseen by the project director (Cell C27) and project supervisor (Cell C28) (Exhibit 5.10). The project director and project supervisor are then tasked with reporting the results to stakeholders or other sponsors in the form of presentations at conferences, workshops, or via other means of data dissemination. Time allocated for the summary and reporting are also non-scaled as variables such as participant number, duration of the study, and number of events do not alter the time required.
Long Description.
The column headers are task, time in hours, estimated overall cost, and unit cost. The 8 sub-headers under time in hours are titled project director, project supervisor, project administration, project associate team, recruitment team, data preparation team, database management team, hardware and software support. The two sub-headers under the unit cost are titled per overall study and per other. The header given below is the study conclusion. The data are provided in row 27.


