Evaluating Traffic Safety Campaigns: A Guide (2025)
Chapter: 7 Epidemiological Studies

CHAPTER 7
Epidemiological Studies
Epidemiological studies provide direct metrics of behavior changes in an area after exposure to a safety message. For example, a campaign is deployed that focuses on the safety benefits of wearing a seatbelt. Researchers assess related metrics (e.g., seatbelt violations and fatalities due to not wearing a seatbelt) in state databases before campaign deployment and again after the campaign has concluded. A reduction in these particular metrics from predeployment to post-campaign conclusion is indicative of a behavior change that is likely due to the seatbelt safety campaign. However, an epidemiological study does not provide an absolute measure of cause and effect as it is impossible to conclude with 100% certainty that the behavior change was the result of the safety campaign. Violations data and crash data do not provide the opportunity to follow up with questions about why drivers changed their behavior; thus the behavior change could be attributable to some other factor. Epidemiological studies are typically cost-friendly as they do not involve data collection (i.e., other agencies/departments collect the data), although a downside of not being involved in data collection is not having any say in what data is collected. It can also be difficult (or not possible) to link different datasets to get a broader picture of outcomes (e.g., linking driver crash reports to hospital records). These types of studies can be useful to identify particular issues that may need to be targeted with a traffic safety campaign with the understanding that other study types may be more suitable for an evaluation of the campaign (e.g., media metrics to assess exposure or focus groups to understand changes in attitudes). The quick reference guide for using the epidemiological study costing tool is available in BTSCRP Web-Only Document 7.
Staffing
Staffing for the epidemiological study is based on a calculated selection of roles essential to achieving project objectives efficiently and effectively. The roles included in the costing spreadsheet represent a range of functions from leadership to specialized support, each necessary for completing the project within its defined scope, budget, and timeline. Salaries for each role are listed in the projectʼs costing tool (Exhibit 7.1), where they are allocated based on specific functions required for seamless project execution. These calculated roles ensure that each element of the project (Exhibit 7.2) is supported by the appropriate expertise, facilitating a coordinated and successful study outcome.
The following are explanations of the roles shown in Exhibit 7.1.
- Project Director. The project director in an epidemiological study oversees overall study planning and works closely with data providers and stakeholders to define the studyʼs objectives, select appropriate datasets, and determine key variables.
- Project Supervisor. In an epidemiological study, the project supervisor oversees the collection and integration of large datasets, making sure that each phase of data handling adheres to regulatory standards. The supervisor coordinates data requests, tracks dataset availability, and organizes team efforts to manage high-volume data processing. They also monitor progress on data cleaning and validation, making sure that timelines and objectives are met for each dataset.
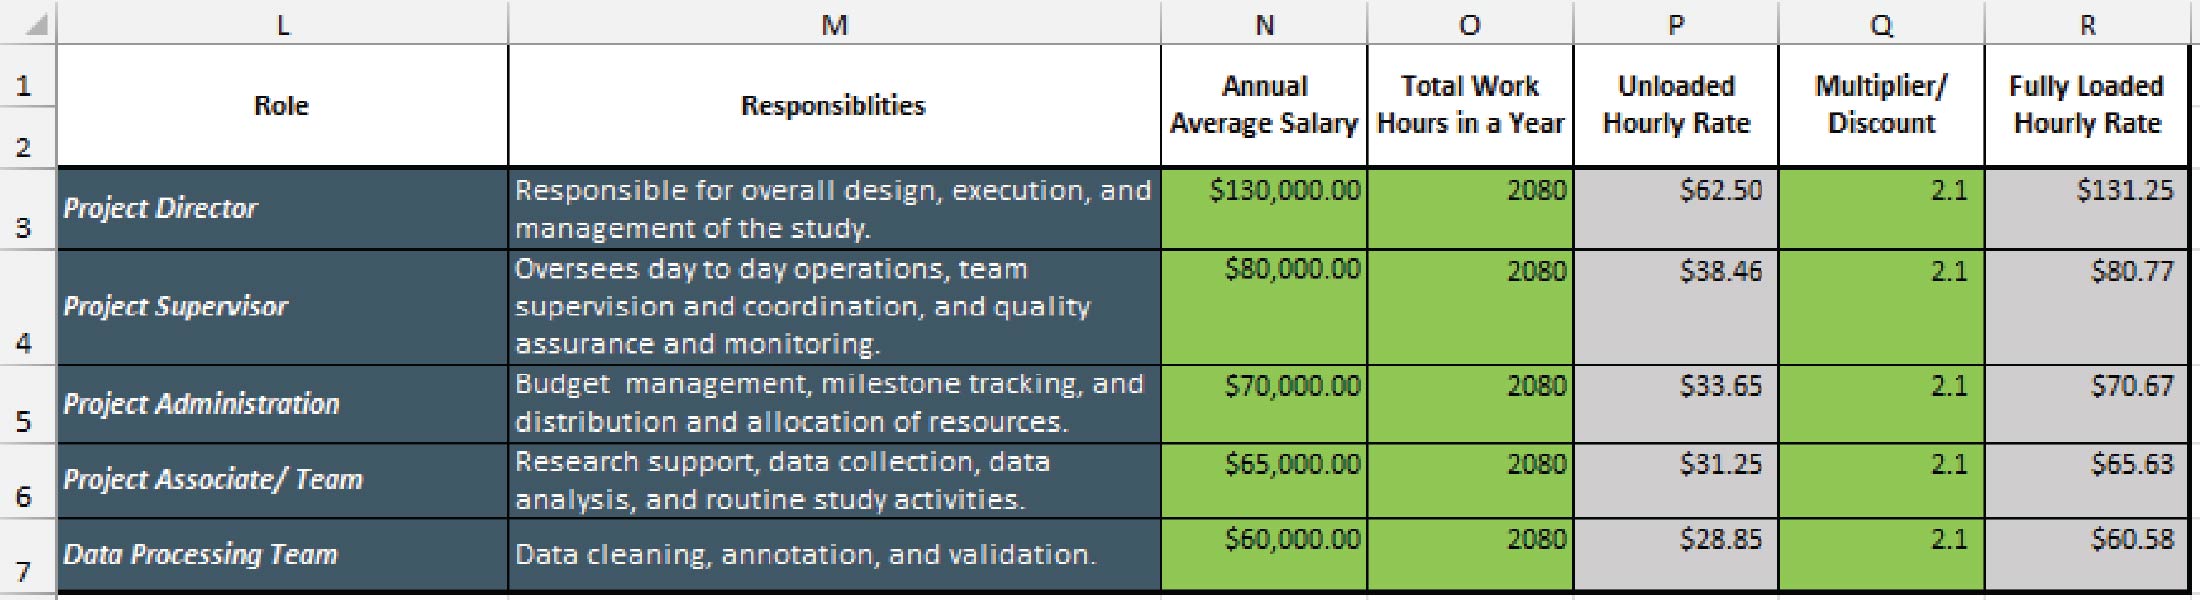
Long Description.
The column headers under columns L through R are role, responsibilities, annual average or hourly wage, total work hours in a year, unloaded hourly rate, multiplier or discount, and fully loaded hourly rate. The data are given from rows 3 to 8.
- Project Administrator. The project administrator in an epidemiological study manages administrative tasks related to data access, including handling data licensing agreements and coordinating with data providers. They ensure proper documentation of all datasets and maintain clear records of the studyʼs data sources and expenditures. The administrator also assists with team coordination, scheduling, and communication to keep project activities organized and efficient.
- Project Associate/Team. Project associates support data retrieval and preliminary data processing. They work closely with senior staff to compile datasets, making sure that data is properly formatted and integrated for further analysis. Project associates might also assist with data validation, conducting preliminary quality checks to verify data accuracy and identify potential inconsistencies.
- Data Processing Team. The data processing team prepares raw epidemiological data for analysis by performing essential cleaning and validation procedures. Given the complexity and size of epidemiological datasets, the team ensures all data is accurately formatted and cross-checked for errors. They implement data transformation processes, merge datasets, and restructure variables to facilitate analysis, and perform quality assurance to maintain data integrity.
For each study type, input other direct non-labor costs, such as software subscriptions, advertisements, and study materials, in the respective study cost sheet. Make sure to review each typeʼs specific sheet for itemized cost inputs.
Steps for Conducting an Epidemiological Study
Step 1: Study Design
The first step in developing any epidemiological study is choosing the most appropriate design (Exhibit 7.3). For evaluating driving safety campaigns, common designs include time-series studies and cohort studies. A time-series study allows researchers to compare data collected before and after the campaign to observe trends or changes in outcomes, like traffic accidents or violations. Alternatively, a cohort design can be used to compare two groups: one exposed to the campaign and another unexposed (control group), tracking both groups over time to assess differences in driving outcomes. The choice of study design depends on the campaignʼs scope, the availability of data, and the studyʼs objectives.
Step 2: Planning
In addition to timeline and budgetary forecasting, the primary focus of planning for epidemiological studies involves selecting appropriate study populations, identifying reliable data sources, and determining the most suitable analysis methods. These elements ensure the study is designed to effectively answer the research questions while accounting for confounding factors and ensuring statistical validity (Exhibit 7.4).
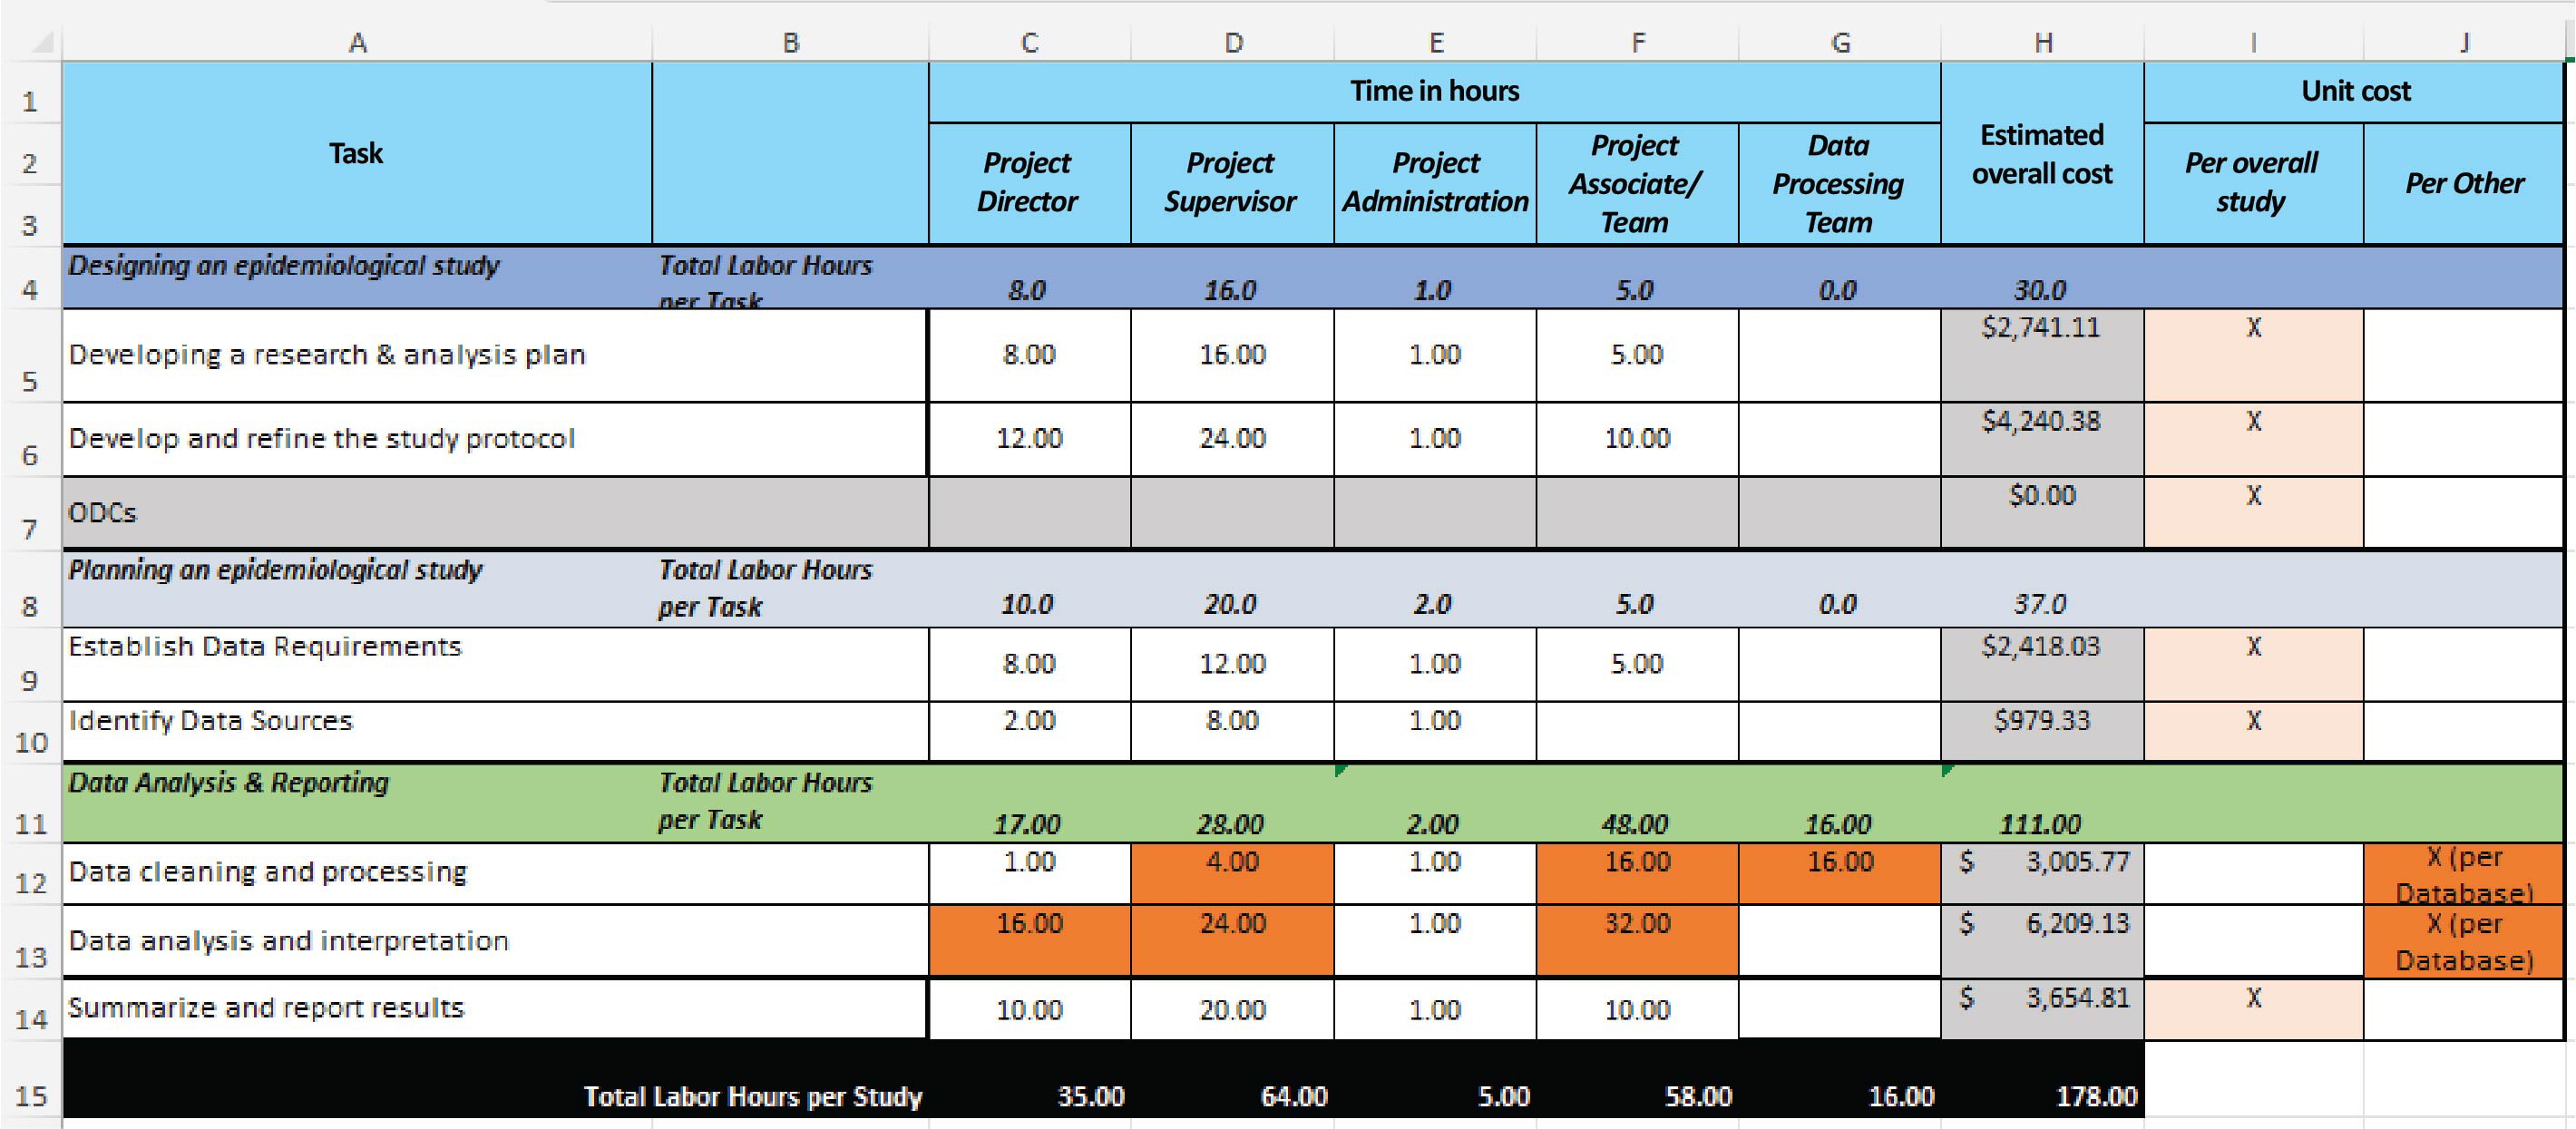
Long Description.
The column headers are task, blank, time in hours, estimated overall cost, and unit cost. The 5 sub-headers under time in hours are titled project director, project supervisor, project administration, project associate team, and data processing team. The two sub-headers under the unit cost are titled per overall study and per other. The headers in rows 4, 8, and 11 are designing an epidemiological study, planning an epidemiological study, and data analysis and reporting. Each header lists the total labor hours per task. Total labor hours per study is provided at the end of the sheet.
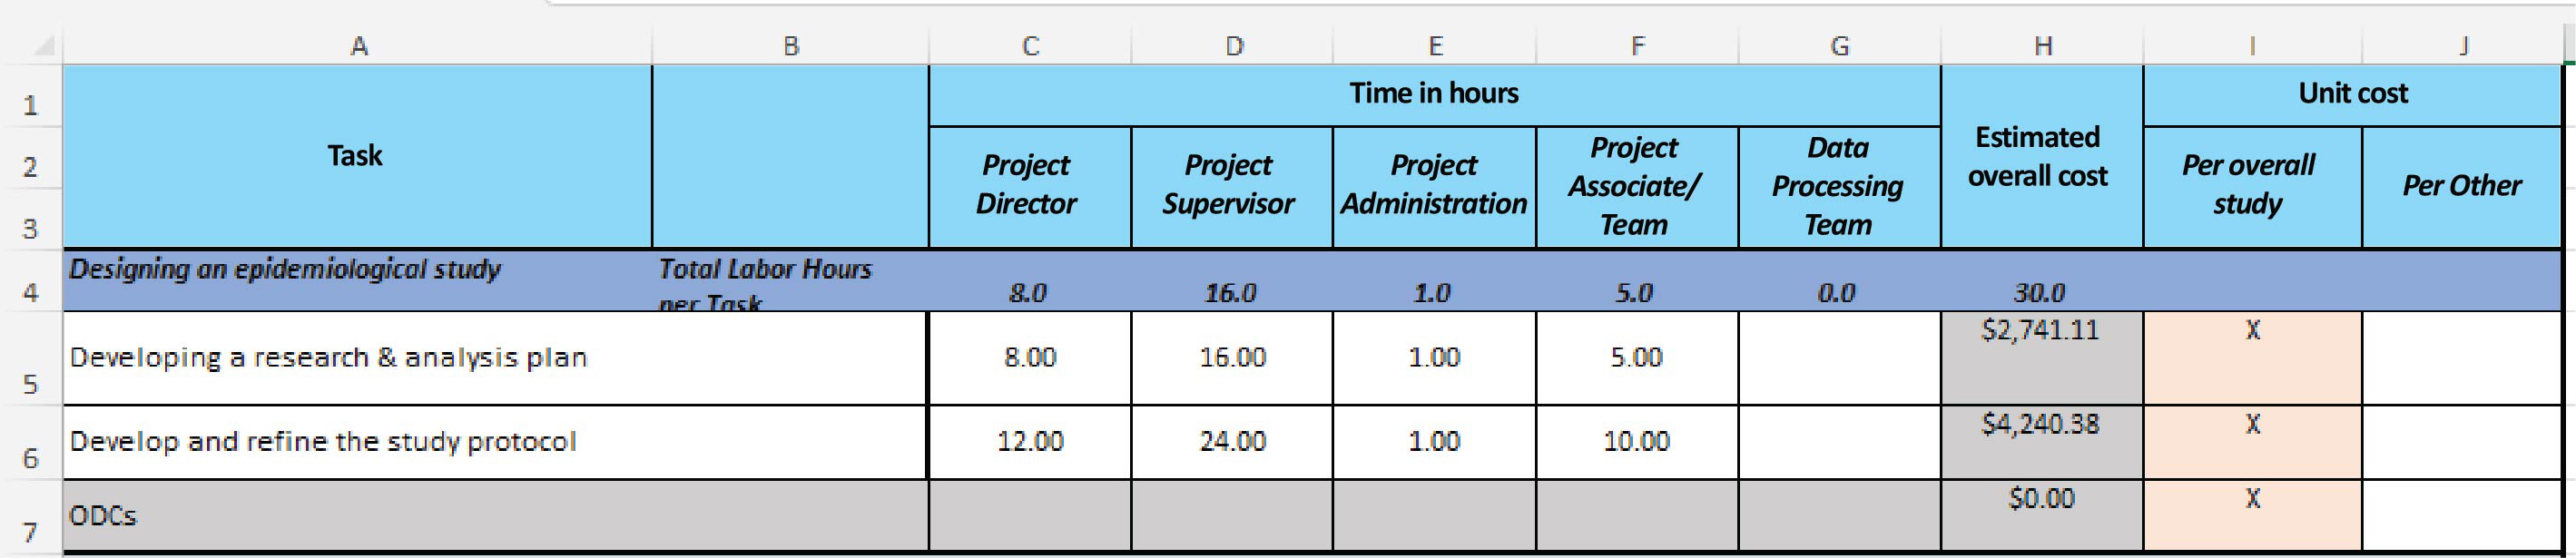
Long Description.
The column headers are task, blank, time in hours, estimated overall cost, and unit cost. The 5 sub-headers under time in hours are titled project director, project supervisor, project administration, project associate team, and data processing team. The two sub-headers under the unit cost are titled per overall study and per other. The header given below is designing an epidemiological study along with the total labor hours per task.
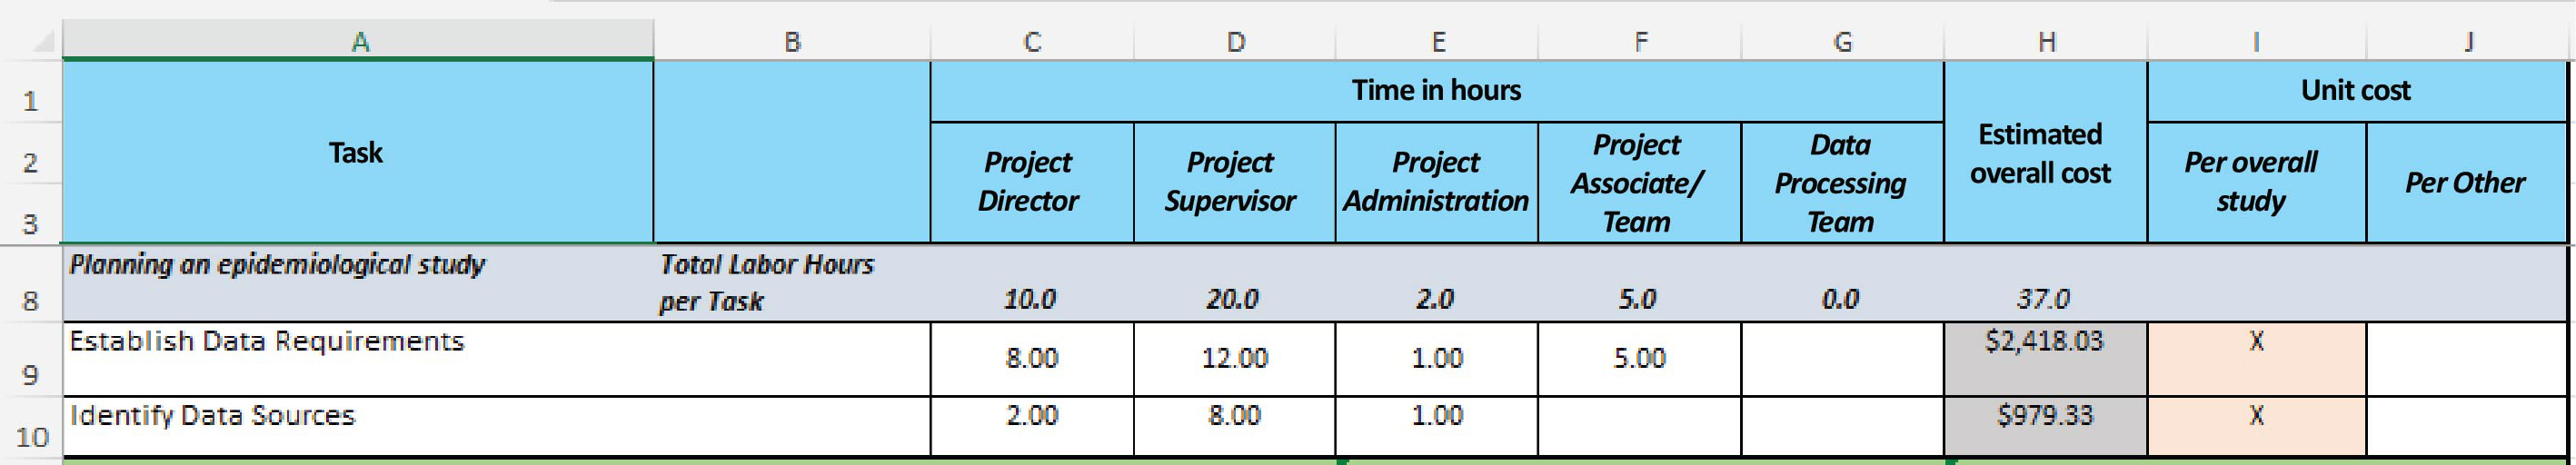
Long Description.
The column headers are task, blank, time in hours, estimated overall cost, and unit cost. The 5 sub-headers under time in hours are titled project director, project supervisor, project administration, project associate team, and data processing team. The two sub-headers under the unit cost are titled per overall study and per other. The header given below is planning an epidemiological study along with the total labor hours per task.
In addition to expected labor costs shown in Rows 9 and 10 (Exhibit 7.4), additional costs to consider may be database access fees and any database-related software that is required for accessing, transferring, and reading data from the database (Exhibit 7.5). Although many databases are open to the public, there are databases containing data that is proprietary, or otherwise unavailable to the public that may require consideration. These values can be entered in Cells N11–N13 (Exhibit 7.5).
Step 3: Analyze and Report
Analyze
Once the data is extracted from the source, statistical analysis is required to evaluate the campaignʼs impact. Researchers might use methods like interrupted time-series analysis (for pre- and post-campaign data) or regression models (to adjust for confounding variables). The choice of statistical methods depends on the study design and the type of data collected. For instance, if comparing two cohorts, a difference-in-differences approach (i.e., comparing changes in outcomes over time between the two cohorts) might be useful to compare changes between the exposed and unexposed groups.
The costs associated with data analysis are typically only labor-related, and can be found in the costing tool in Rows 12–14, Columns C–H (Exhibit 7.6). These costs are scaled based on the total number of datasets used, which can be input in Cell N13.
Report
The final step is interpreting the results in the context of the studyʼs objectives and the broader environment in which the campaign was implemented. Researchers must consider limitations, like biases, potential data inaccuracies, or external factors that might have influenced the outcomes. The results should be presented clearly, with a discussion of their implications for road safety policies and future campaigns. Effective reporting also involves making recommendations for further research or adjustments to safety interventions based on the findings. Costs associated with reporting are only labor-based and can be found in Row 14, Columns C–H. (Exhibit 7.6). The total labor cost for data analysis and reporting can be found in Cell M18 (Exhibit 7.7).
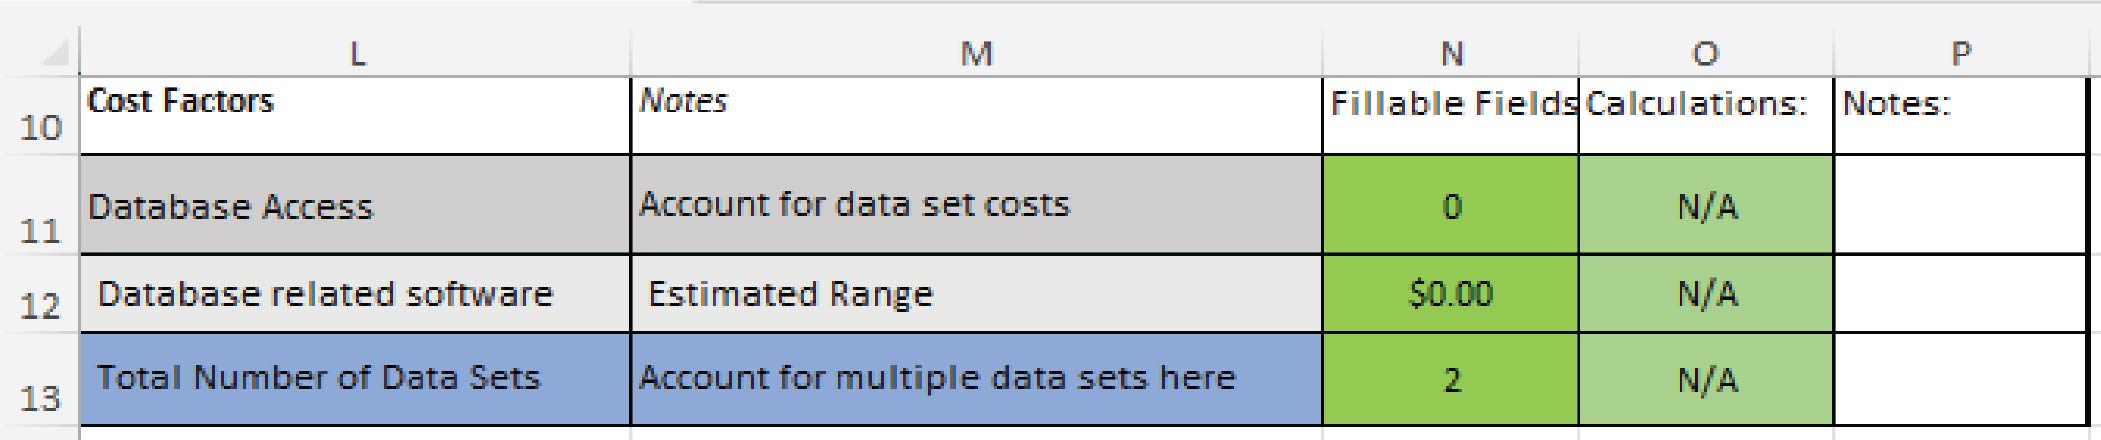
Long Description.
The column headers from columns L through P are cost factors, notes, fillable fields, calculations, and notes. The data are provided from rows 11 to 13.
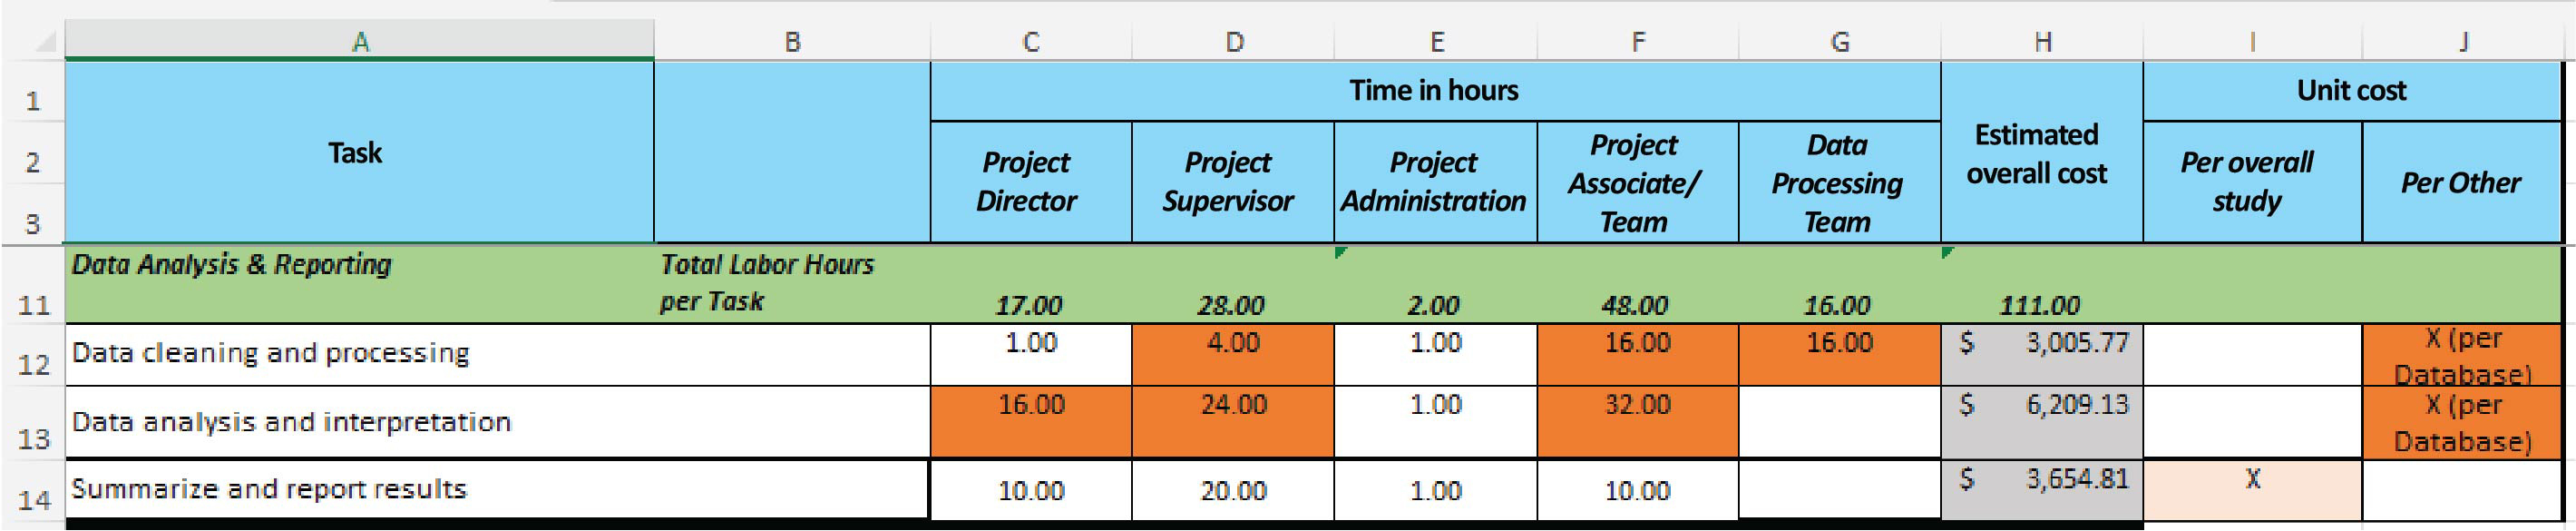
Long Description.
The column headers are task, blank, time in hours, estimated overall cost, and unit cost. The 5 sub-headers under time in hours are titled project director, project supervisor, project administration, project associate team, and data processing team. The two sub-headers under the unit cost are titled per overall study and per other. The header given below is data analysis and reporting along with the total labor hours per task.
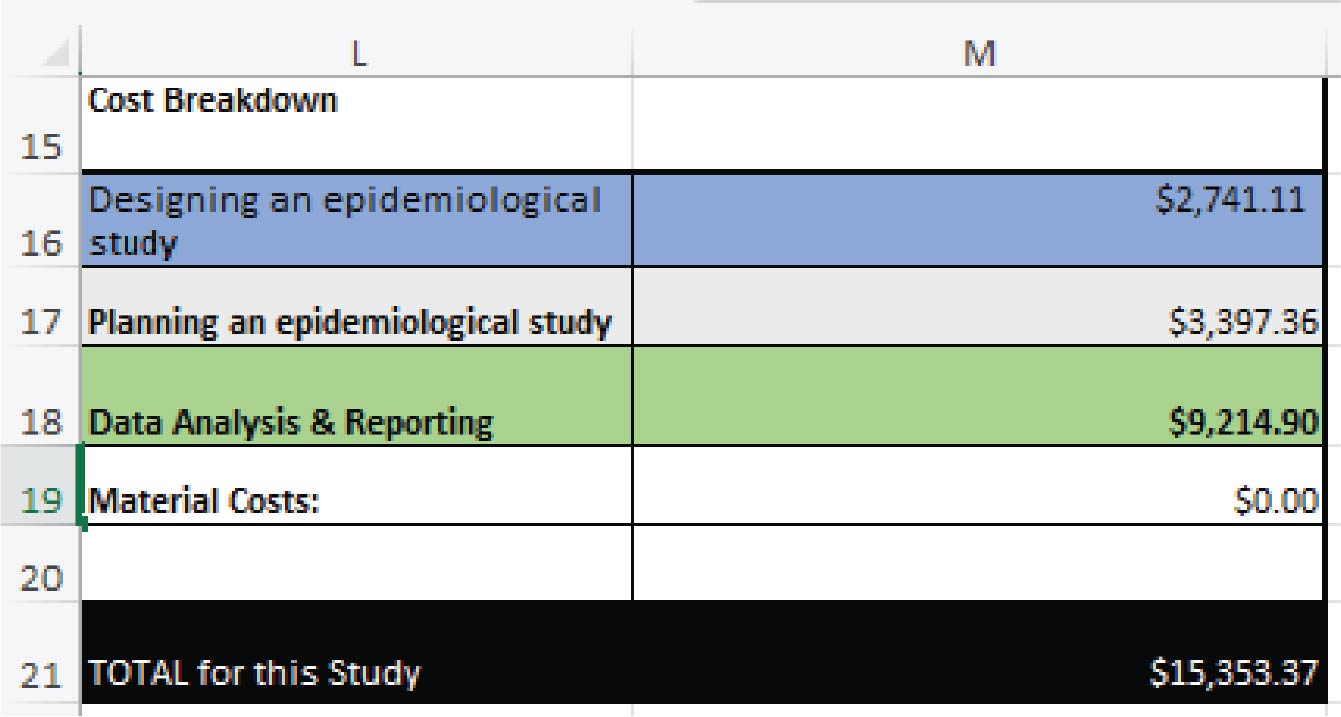
Long Description.
The cost breakdown is given from rows 16 to 19 and the total for this study provided in row 21 is 15,353.37 dollars.


