Snapshots of Planning Practices (2025)
Chapter: Economic Analysis to Support Decision-Making
SNAPSHOTS OF PLANNING PRACTICES:
ECONOMIC ANALYSIS
TO SUPPORT DECISION-MAKING
WHY INTEGRATE ECONOMIC ANALYSIS INTO DECISION-MAKING?
This ensures that infrastructure investments align with broader economic development goals. By coordinating transportation planning with anticipated economic activities, resources can be allocated more efficiently, leading to improved connectivity, reduced costs, and enhanced access to markets and labor. This approach also helps in forecasting future demands, preventing bottlenecks, and supporting sustainable growth, ultimately leading to a more resilient and competitive economy.
FOLLOW THESE LINKS TO LEARN MORE IF YOU ARE LOOKING FOR….
- Resources on starting to integrate economic analysis into decision-making →
- Resources to understand the economic impact of my program(s) →
- Examples of economic development stakeholders that I can engage →
- Key practices for starting to integrate economic analysis into decision-making →
- Examples of what other DOTs are doing with economic analysis →
- Examples of what MPOs are doing with economic analysis →
SNAPSHOTS OF PLANNING PRACTICES:
ECONOMIC ANALYSIS | KEY PRACTICES
Different organizations might optimize their approach towards economic analysis by focusing on one or more “levers of change” within their organization. These levers of change – Organization, Workforce, and Partnerships; Data and Performance Management; and Policy and Program Design – are the organizing framework of these key practices. This structure is intended to offer practices in each area so that organizations can choose where to focus their energy and resources. The practices are divided into three categories: 1) “Designing” describes practices, examples, and resources relevant to agencies who are new to the topic area or setting up a new program, 2) “Enhancing” describes practices among agencies that are expanding or growing their efforts in a area and taking on increasingly complex aspects of the topic., and 3) “Advancing” describes practices, examples, and resources relevant to agencies that are innovating or establishing new practices in a topic area.
DESIGNING
Exemplary practices for agencies who are new to using Programmatic Economic Measures for Evaluation & Prioritization.
ORGANIZATION, WORKFORCE, AND PARTNERSHIPS:
Establishing relationships within the organization, with other agencies, and with other planning organizations with responsibilities related to economic development (e.g., economic development, workforce, or business development organizations).
DATA AND PERFORMANCE MANAGEMENT:
Conducting an inventory of available macroeconomic and other data required for economic analysis. Start to collect and consolidate relevant data and identify gaps.
Building tools such as matrices that allow high-level project scoring or screening based on economic analysis factors..
POLICY AND PROGRAM DESIGN:
Assessing pre-project phases, such as needs assessments and planning studies, where economic analysis could be integrated.
Assessing project planning, scoping, and screening processes and identifying the phase (prior to prioritization) where economic analysis could be integrated.
ENHANCING
Exemplary practices for agencies who are expanding or growing their use of Programmatic Economic Measures for Evaluation & Prioritization.
ORGANIZATION, WORKFORCE, AND PARTNERSHIPS:
Utilizing relationships established in the “Designing” phase to encourage metropolitan planning organizations (MPO), regional transportation planning organizations (RTPO), and local governments to collect and share their own economic performance measure data.
Maintaining the relationships with economic development and workforce organizations established in the “Designing” phase, determining stakeholders’ data needs, and evaluating opportunities to expand partnerships. This could include establishing a working group or advisory committee for regular communication.
DATA AND PERFORMANCE MANAGEMENT:
Working collaboratively with partner agencies and stakeholders to determine ongoing responsibilities related to collection and maintenance of transportation data relevant to economic analysis. Integrating the understanding of these roles into organizational policies.
Building tools such as matrices that screen projects or provide high-level scoring along economic analysis factors. Considering how this tool might later be used to prioritize projects.
Translating relevant data into a GIS layer which can be layered with other geographic data to help understand how economic development, workforce development, and transportation data interact. Developing guidance on how to integrate this information into planning and project scoping processes.
POLICY AND PROGRAM DESIGN:
Working collaboratively to incorporate economic analysis into both short- and long-term planning processes. This could include topics such as identification of major economic centers, workforce trends, forecasts for passenger and freight demand and economic growth opportunities.
Establishing economic factors into project prioritization process.
ADVANCING
Exemplary practices for agencies who innovating & establishing new best practices in their use of Programmatic Economic Measures for Evaluation & Prioritization.
ORGANIZATION, WORKFORCE, AND PARTNERSHIPS:
Hiring staff as needed to conduct and lead economic impact analyses.
Providing sufficient funding to continue economic impact analyses and institutionalize this process.
Fostering partnerships for economic data collection and management through regular stakeholder meetings.
DATA AND PERFORMANCE MANAGEMENT:
Institutionalizing economic performance measure analysis as an integral component of major transportation projects, including standardized and automated processes for data collection, management, and sharing.
Developing the ability to produce in-house data and performance-based reports and share models for replication by stakeholders.
POLICY AND PROGRAM DESIGN:
Identifying and addressing any emerging challenges around geographic equity in economic analysis (e.g., by limiting competition for funding to regional pools, comparing projects in similar urban contexts, or adjusting criteria or weighting).
GAPS AND FUTURE RESEARCH
How can agencies obtain more granular economic data useful for project-level analysis? Who is gathering this type of information and how can agencies obtain and use it for their work?
What are some quick-response tools that allow for high level understanding of a project’s economic benefit, without needing to complete a large, complex calculation?
SNAPSHOTS OF PLANNING PRACTICES:
ECONOMIC ANALYSIS | EXAMPLES
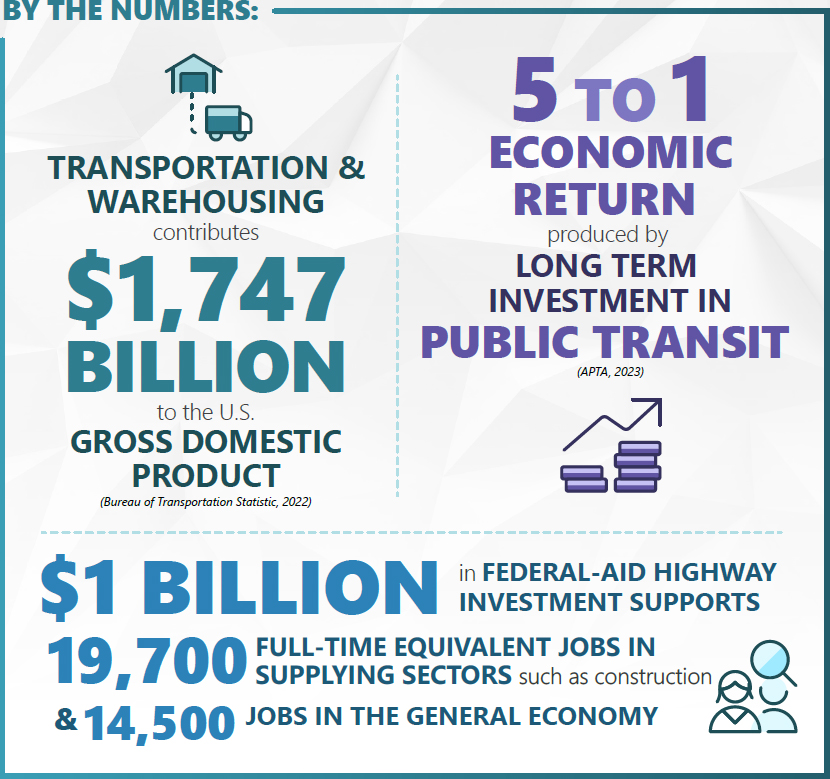
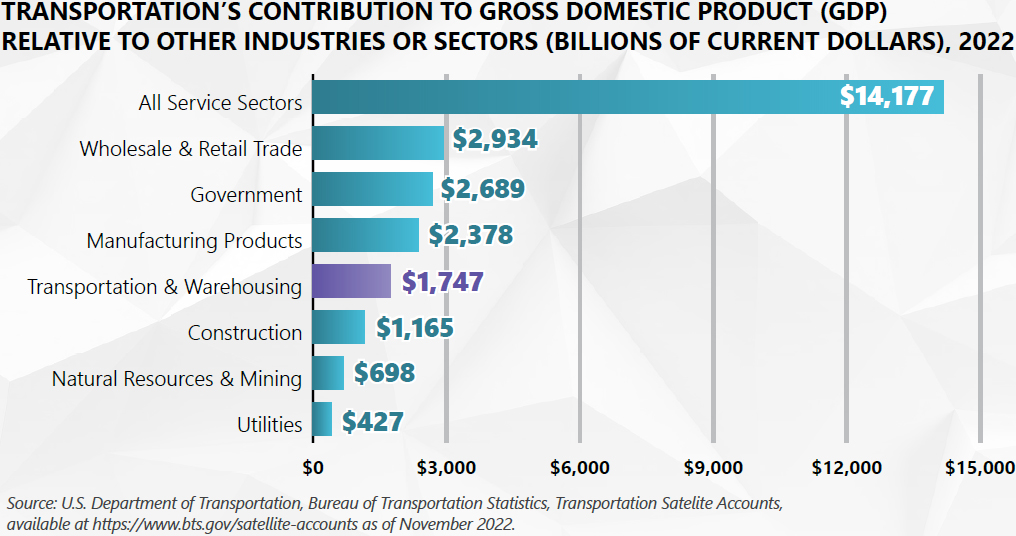
This Snapshot focuses on best practices in calculating the economic impact of transportation projects in order to evaluate and prioritize transportation projects and investments. This economic analysis can be used to inform the decision-making process, guiding agencies toward funding projects that will best meet agency, state, and federal goals.
DESIGNING
Some agencies are partnering with stakeholders and integrating external economic analyses or plans to support their transportation economic analyses. This allows the agency to gather targeted information on industries and aspects of their community that are important for jurisdiction level growth.
![]()
Florida DOT partnered with the Florida Chamber of Commerce to complete a Trade and Logistics Study. This study assessed the impact of the trade, logistics, and distribution industry on the economy of Florida including jobs, sales, personal income, and state and local tax revenues. This collaboration leveraged the Chamber of Commerce’s expertise to support FDOT’s work and guide investments, policy, and programming.

![]()
Southwestern Pennsylvania Commission, which is the MPO for the Pittsburgh area, integrated their long-range transportation plan and their comprehensive economic development strategy into one plan. This allows them to match their economic development opportunities and priorities directly to transportation priorities and improvements, ensuring that the transportation network serves as an asset to the region.

ENHANCING
Some agencies are moving toward a more comprehensive view of return on investment, thereby understanding the economic impact on a programmatic level which can be used for program justification and potentially federal funding applications.
![]()
The Metropolitan Transportation Commission, the MPO in the San Francisco Bay Area, evaluates projects and programs for its long-range plan based on a matrix with comprehensive benefit-cost analysis on one axis and outcome-oriented targets on another. This makes clear which investments offer the greatest return on investment, which move the region farthest toward meeting its long-term goals, and which accomplish both.

![]()
On a state-wide level, California completed an economic impact assessment of their highway, street, bridge, and transit investments. They calculated the impact savings for the system users and the economic impacts using the US Department of Commerce Regional Input-Output Modeling System and the FHWA Economic Reporting System. From this analysis, they found that through their construction, maintenance, and operations of the transportation system, they will see a 4.3:1 return on their investment.

ADVANCING
Agencies that have developed complex economic measures are using them to understand regional economic trends and project impacts, have included additional data such as demographics and land use, and made the data publicly available through web services such as interactive maps.
![]()
The Ohio Department of Transportation (ODOT) is working with the Ohio Department of Development and the Governor’s Office of Workforce Transformation to develop the Strategic Transportation and Development Analysis (STDA). The STDA analyzes existing and future congestion conditions within the State and identifies opportunities to support economic growth through addressing regional congestion risk and strengthening interregional trade lanes.

![]()
The Southeastern Michigan Council of Governments (SEMCOG), the MPO for Detroit, developed a Regional Forecast that provides projected economic an demographic changes, including indicators such as total population, jobs, and households. This data is used when developing the regional Long Range Plan and also by member communities for their infrastructure planning needs. The results of the analysis are available in report form, spreadsheet, and via online interactive mapping tool called the 2050 Regional Forecast Explorer.

![]()
The Portland, Oregon Metro MPO developed the Economic Value Atlas to provide insights into the regional economy and to support policy makers in focusing investments. It is a GIS-based tool that brings together many variables such as renter housing cost burden, transit access to jobs, type of jobs, and property value. Relevant uses include identifying the economic situation along transportation corridors to understand where and whether certain investments are necessary and supporting transportation development via site identification and development potential and the associated future transportation needs of those areas.

SNAPSHOTS OF PLANNING PRACTICES:
ECONOMIC ANALYSIS | RESOURCES
DESIGNING
The Bureau of Transportation Statistics’ Transportation Economic Trends webpage summarizes transportation and economic trends using interactive charts. It includes links to resources and datasets on associated items such as amount of transportation required per dollar of output by industry, employment in transportation-related labor force, amongst many others.
EconWorks, which is hosted by AASHTO, is a web-based tool that supports planners in incorporating economic analysis into their work. It provides case studies, My Project tool which helps to estimate economic impact of a user-identified project, and downloadable spreadsheets for further economic impact analysis.
SEMCOG Performance Measures page provides a list of example economic performance measures that transportation agencies can use when assessing their projects and/or programs.
Incorporating Economic Impact Metrics in Transportation Project Ranking and Selection Processes: This research study provides insight into how to match economic measures with different transportation issues. It provides examples of different measures and what economic impact ranking schemes they are best suited to (e.g., benefit cost analysis, multi-criteria scorecard analysis, and composite ranking system).
ENHANCING
Prioritization of Public Transportation Investments: A Guide for Decision-Makers focuses on how state DOTs, MPOs, and public transit agencies can make cross-modal decisions around prioritize capital projects specifically the comparison of transit and non-transit projects.
Modern Project Prioritization for Transportation Investments is a USDOT report on transportation project prioritization best practices. The paper reviewed the practices at 21 transportation agencies, including 14 state DOTs and 7 MPOs.
ADVANCING
Developing Tools for Assessing Wider Economic Benefits of Transportation: This TRB report provides a spreadsheet-based tool that helps DOTs incorporate three metrics: time reliability, market access, and intermodal connectivity, into an economic benefit and impact analysis.
Measuring the Impacts of Freight Transportation Improvements on the Economy and Competitiveness: This document provides examples of different types of analyses that could be used to measure and analyze the impacts of freight transportation projects, including benefit cost analyses, regional productivity analysis, and economic impact analysis.
ECONOMIC MODELING TOOLS EXAMPLES
TREDIS | EconWorks | REMI (Regional Economic Models) | IMPLAN
The National Cooperative Highway Research Program (NCHRP) produces ready-to-implement solutions to the challenges facing transportation professionals. NCHRP is sponsored by the individual state departments of transportation of the American Association of State Highway and Transportation Officials (AASHTO), in cooperation with the Federal Highway Administration (FHWA). NCHRP is administered by the Transportation Research Board (TRB), part of the National Academies of Sciences, Engineering, and Medicine. Any opinions and conclusions expressed or implied in resulting research products are those of the individuals and organizations who performed the research and are not necessarily those of TRB; the National Academies of Sciences, Engineering, and Medicine; or NCHRP sponsors.


