Defining Contractual Risk Profiles to Increase Competition on Alternative Project Delivery Methods (2025)
Chapter: 3 Survey and Interview Results
3 Survey and Interview Results
This section presents key findings from the surveys and interviews performed to date, generally including:
- How owner and industry practitioners perceive the risks impacting APD projects, and whether these perceptions change with delivery method.
- How risks are typically allocated on APD projects, and how this allocation has evolved over time.
- How project risk profiles can impact project delivery method decisions.
- What practices DOTs are using to help align owner and industry perceptions of project risks; and
- What risk factors can influence decisions to pursue APD projects by contractors and designers.
Raw survey results are provided in Appendix D. Interview summaries are provided in Appendix E.
3.1 Key Risks on APD Projects
The survey asked both DOT/owner and industry representatives to identify, from a predetermined set, the top five risks that can impact the successful delivery of a project by APD method.
3.1.1 Design-Build (Fixed Price)
For projects delivered using fixed price DB, Table 3.1 shows the percentage of respondents who indicated that the risk was in their Top 5. The table presents the results in order from highest to lowest by DOT/owner responses; for “other” risks, industry respondents identified: “culture/experience of client” and “third-party risks”.
Table 3.1: DOT/Owner and Industry Responses to Top 5 Risks in DB (Fixed Price)
| Risk | Percentage Indicating in Top 5 | |
|---|---|---|
| DOT/Owner (n=13) | Industry (n=10) | |
| Environmental permits | 76.92% | 40.00% |
| Utility issues | 69.23% | 70.00% |
| Change in scope (e.g., due to coordination with third parties; late change requests) | 61.54% | 30.00% |
| Railroad involvement | 61.54% | 40.00% |
| Incomplete project scope definition / design uncertainty | 53.85% | 40.00% |
| Geotechnical conditions | 46.15% | 40.00% |
| Coordination with gov’t agencies or other authorities having jurisdiction | 30.77% | 40.00% |
| Right-of-way and easements | 30.77% | 60.00% |
| Funding availability | 23.08% | 20.00% |
| Market conditions (e.g., price volatility, labor availability, etc.) | 23.08% | 30.00% |
| Schedule / phasing issues (aggressive schedule; restricted work window, etc.) | 15.38% | 30.00% |
| Archaeological or protected species | 7.69% | 0.00% |
| Risk | Percentage Indicating in Top 5 | |
|---|---|---|
| DOT/Owner (n=13) | Industry (n=10) | |
| Changes in law | 0.00% | 10.00% |
| Constructability issues | 0.00% | 10.00% |
| Hazardous materials | 0.00% | 10.00% |
| Political risks / opposition | 0.00% | 10.00% |
| Other (Please describe) | 0.00% | 20.00% |
Figure 3.1 depicts a pair-wise comparison of the Top 5 risks on DB (fixed price) projects as identified by DOT/owner (public) and industry (private) respondents.
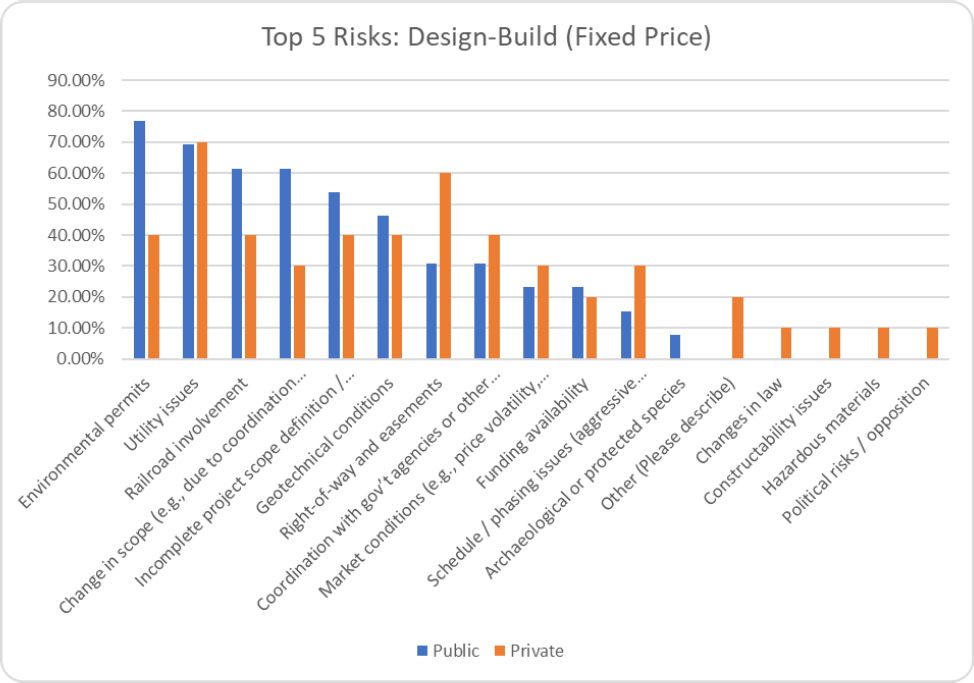
The survey results demonstrate that DOT and industry respondents have both areas of alignment and variance when it comes to identifying the top 5 risks on DB projects.
For instance, nearly 70% of all respondents identified utility issues as a top 5 risk; this result was reinforced in the follow-up interviews where both DOT and industry interviewees discussed problematic risks for DB (fixed price) projects. One DOT interviewee commented:
Oftentimes, we are at the mercy of utilities to show up and do what they said they would do and if they don’t there can be impacts on a project’s cost and schedule.
Another DOT noted that they are being more proactive with getting utilities to perform relocations in a timely manner by setting up target relocation schedules that contractors can rely upon.
Overall, alignment exists between DOT and industry (within 10%) for utilities, geotechnical conditions, coordination with government agencies, market conditions, and funding availability. This alignment suggests that both DOT and industry perceive these to be key risks that may affect either party depending on the risk allocation.
The variances (>10%) for environmental permitting, railroads, and incomplete scope definition, which the DOTs identified as key risks at a higher frequency than industry, suggest that these risks are typically retained by the owner. Conversely, risks related to right-of-way and easements and scheduling were skewed more towards industry. The industry respondents also identified additional key risk issues not addressed by DOTs, including culture/experience of client, changes in law, constructability issues, hazardous materials, and political risks/opposition.
3.1.2 CM/GC or Progressive Design-Build
For projects delivered using progressive methods such as CM/GC or Progressive DB, Table 3.2 shows the percentage of survey respondents who indicated that the risk listed was in their Top 5, ordered from highest to lowest by DOT/owner responses. For “other” risks, DOT respondents identified “price negotiation” and “cost reconciliation/agreement” while industry respondents again identified: “culture/experience of client” and “thirdparty risks”. Figure 3.2 depicts a pair-wise comparison of the Top 5 risks.
Table 3.2: DOT/Owner and Industry Responses to Top 5 Risks in CM/GC or PDB
| Risk | Percentage Indicating in Top 5 | |
|---|---|---|
| DOT/Owner (n=13) | Industry (n=9) | |
| Change in scope (e.g., due to coordination with third parties; late change requests) | 61.54% | 33.33% |
| Funding availability | 53.85% | 33.33% |
| Environmental permits | 46.15% | 11.11% |
| Incomplete project scope definition / design uncertainty | 46.15% | 22.22% |
| Coordination with gov’t agencies or other authorities having jurisdiction | 38.46% | 44.44% |
| Market conditions (e.g., price volatility, labor availability, etc.) | 38.46% | 44.44% |
| Schedule / phasing issues (aggressive schedule; restricted work window, etc.) | 38.46% | 66.67% |
| Utility issues | 38.46% | 55.56% |
| Political risks / opposition | 30.77% | 11.11% |
| Railroad involvement | 30.77% | 55.56% |
| Geotechnical conditions | 23.08% | 22.22% |
| Hazardous materials | 15.38% | 0.00% |
| Right-of-way and easements | 15.38% | 44.44% |
| Changes in law | 7.69% | 22.22% |
| Constructability issues | 7.69% | 11.11% |
| Other (please describe) | 7.69% | 22.22% |
| Archaeological or protected species | 0.00% | 0.00% |
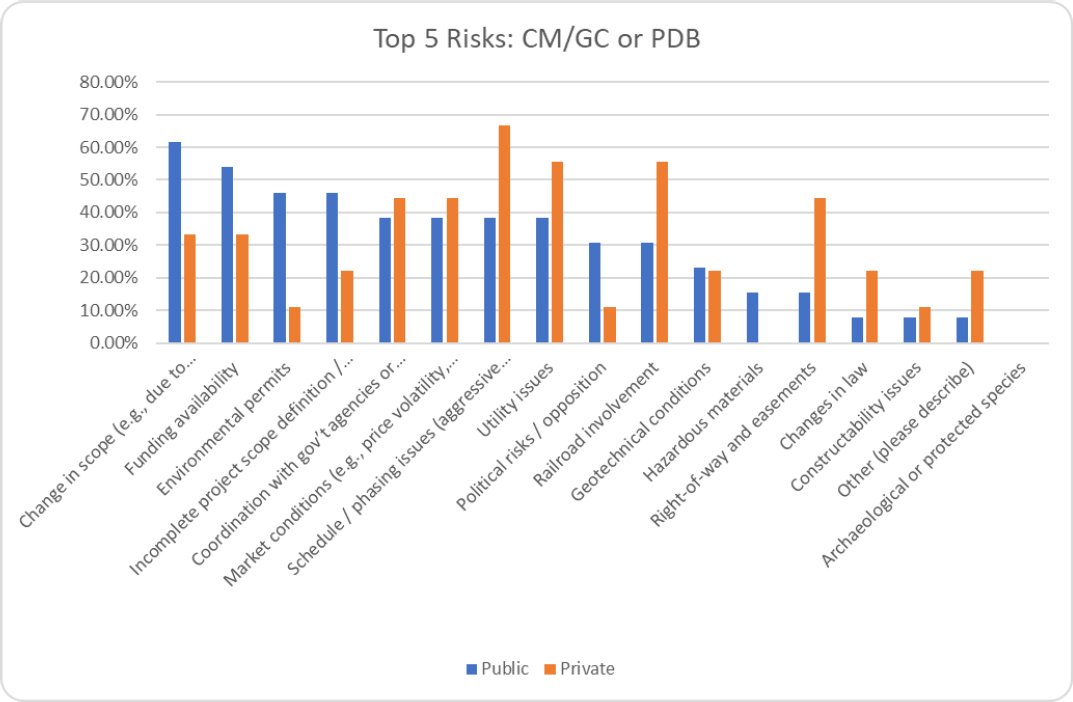
Figure 3.2 demonstrates that DOTs and industry have some differing perceptions of the key risks facing CM/GC or PDB projects. For example, DOTs expressed particular concern regarding scope changes, scope definition, and funding availability. This result is not surprising given the often-immature level of design and possibility for evolving scope (and funding) at the point of engaging a CM or PDB team under these methods. Similarly, industry may view the possibility of such issues as leading to design churn and delayed decision-making, which could in turn compromise project schedule and phasing (about which 65% of industry respondents expressed concern).
3.1.3 Public-Private Partnerships (P3s)
Table 3.3 shows the percentage of respondents who indicated that the risk listed was in the Top 5, ordered from highest to lowest by DOT/owner responses; for “other” risks, DOT respondents identified “price negotiation” and “cost reconciliation/agreement” while industry respondents again identified: “culture/experience of client” and “third-party risks”. Figure 3.3 depicts a pair-wise comparison of the Top 5 risks.
Table 3.3: DOT/Owner and Industry Responses to Top 5 Risks in P3s
| Risk | Percentage Indicating in Top 5 | |
|---|---|---|
| DOT/Owner (n=7) | Industry (n=8) | |
| Political risks / opposition | 71.43% | 62.50% |
| Incomplete project scope definition / design uncertainty | 71.43% | 50.00% |
| Coordination with gov’t agencies or other authorities having jurisdiction | 57.14% | 50.00% |
| Utility issues | 42.86% | 37.50% |
| Right-of-way and easements | 42.86% | 25.00% |
| Change in scope (e.g., due to coordination with third parties; late change requests) | 42.86% | 12.50% |
| Hand-back criteria | 42.86% | 12.50% |
| Usage/demand risk | 28.57% | 75.00% |
| Environmental permits | 28.57% | 37.50% |
| Railroad involvement | 28.57% | 25.00% |
| Schedule / phasing issues (aggressive schedule; restricted work window, etc.) | 28.57% | 12.50% |
| Geotechnical conditions | 14.29% | 25.00% |
| Market conditions (e.g., price volatility, labor availability, etc.) | 0.00% | 37.50% |
| Other (please describe) | 0.00% | 25.00% |
| Changes in law | 0.00% | 12.50% |
| Archaeological or protected species | 0.00% | 0.00% |
| Constructability issues | 0.00% | 0.00% |
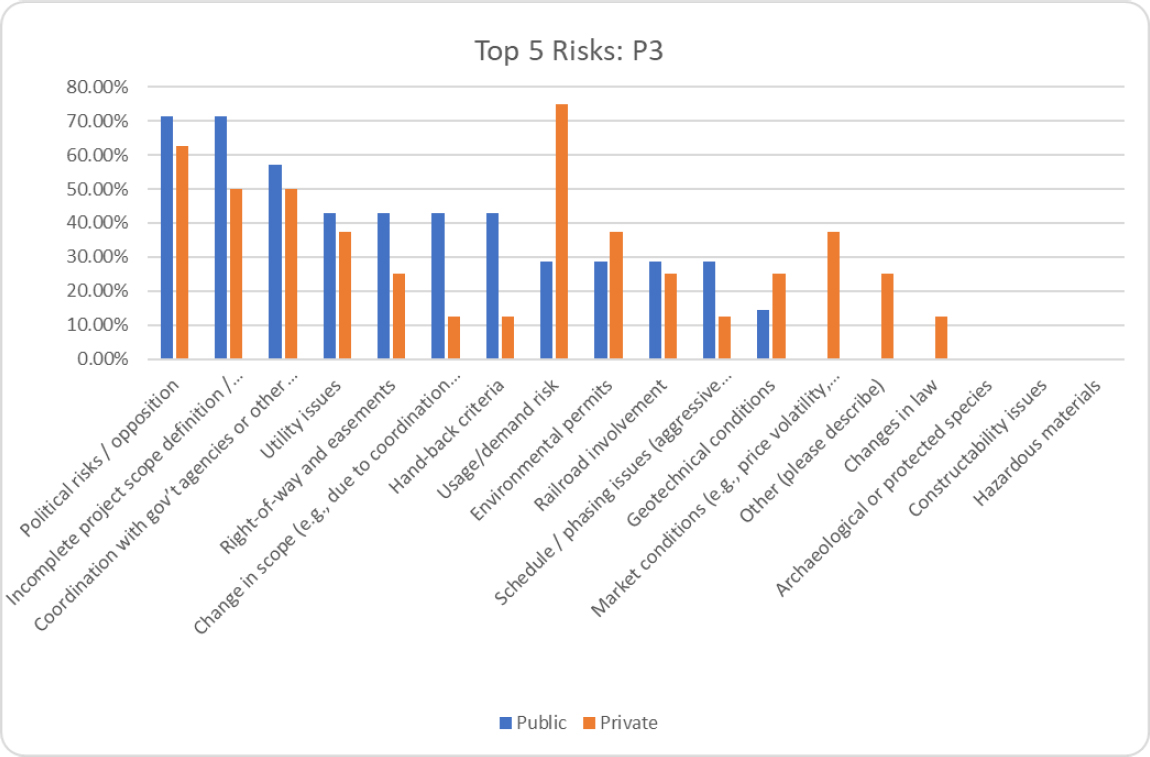
The survey responses indicate that in addition to design and construction risks, different types of risks are of concern to DOTs and industry on long-term P3 agreements (e.g., political risks, coordination with government agencies or other authorities, hand-back criteria, usage/demand risk, and market conditions).
3.1.4 Summary
In addition to identifying the extent to which DOTs and Industry respondents agree (or disagree) on the major risks facing APD projects, the survey results are also useful for understanding how the delivery method in question can change perceptions of the project risk profile. For example, for fixed price DB, the top DOT risk was environmental permits; on CM/GC it was changes in scope; and on P3 it was political risk.
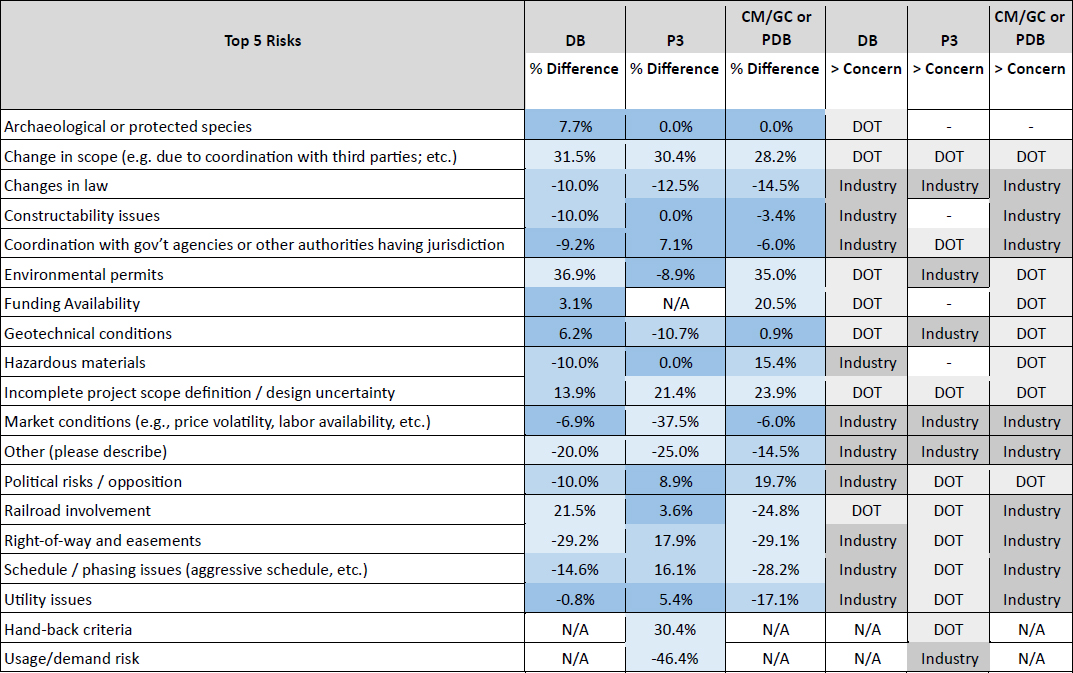
The “heat map” in Figure 3.4 shows the extent to which the risk perceptions of DOT/owner and industry respondents align by APD method. The darker blue shading is used to convey a higher intensity of agreement in perceptions of risk, which is measured by the percent difference in identification between DOT and industry responses (the lower the difference, the higher the agreement) as well as which sector (DOT or industry) had a greater level of concern about the risk.
For instance, the risk “change in scope” had an approximately 30% difference in identification between the DOT and industry respondents for DB, CM/GC or PDB and P3, so DOT respondents were far more concerned about this risk than their industry counterparts. In contrast, the risk “change in law” had an approximately
10% difference in identification between the DOT and industry respondents for DB, CM/GC or PDB and P3, so Industry respondents were a bit more concerned about this risk than their DOT counterparts.
Other striking observations from the heat map include:
- The environmental permit risk is a far greater concern for DOTs in DB and CM/GC or PDB delivery methods, likely because under these methods, they are carrying the risk of obtaining statutory clearances.
- Conversely, industry respondents had greater concern about environmental permitting risk in P3s. Based on the industry interviews, this concern is not necessarily due to the fact that DOTs are not carrying this risk in P3s, but rather P3 developers view how advanced environmental clearances are as a key pre-requisite for pursuit of a P3. An industry interviewee commented: “When we’re assessing whether to pursue a P3, we consider different aspects of a project’s feasibility. For instance, are they going to get NEPA satisfied before they accept bids?”
- The market conditions risk was more of a concern for industry respondents than DOTs because they are likely bearing this risk for all APD methods. The level of concern was much higher for P3s, which is sensible because developers and contractors are dealing with this risk in both design and construction as well as operations and maintenance. Hence, it may impact their costs in different phases and types of services.
3.2 Risk Allocation by APD
3.2.1 Survey Results
The survey asked DOT/owner representatives how a set of risks are typically allocated in projects by APD; in turn, industry representatives were asked how this set of risks should be allocated in projects by APD. While the questions posed to DOT/owner and industry representatives differed slightly, the responses provide an indication of the alignment between the way DOTs currently allocate risks versus the way industry believes such risks should be allocated.
Design-Build
Figure 3.5 displays a “heat map” of how DOTs (public) typically allocate risks in DB projects versus how industry representatives (private) would prefer them to be allocated. The darker the blue indicates the higher the intensity (percentage) of agreement.
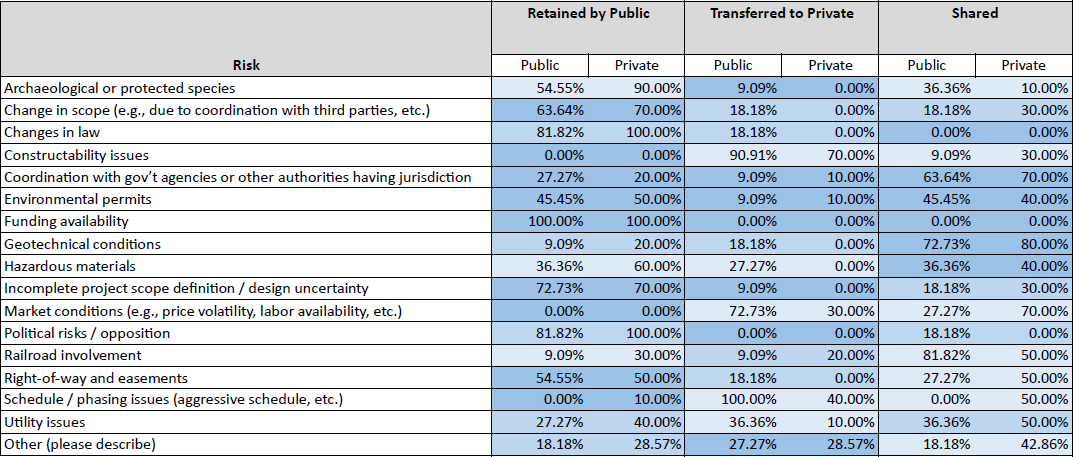
As illustrated in the heat map, the DOT and Industry respondents had some areas of alignment regarding risk allocation in DB (fixed price) arrangements. For instance, for the risk “incomplete project scope definition/design uncertainty”, roughly 70% of DOT and Industry representatives indicated an allocation of retained by public sector; notably, nearly 10% of DOT respondents indicated an allocation of transferred to the private sector whereas 18% and 30% of DOT and Industry respondents indicated a shared allocation respectively. Hence, this result suggests respondents were predominantly aligned on an allocation of retained by the public sector, but with some variance. Other risks had similar results such as “funding availability”, “change in scope”, “coordination with government agencies or other authorities”, “geotechnical conditions”, “political risks” and “changes in law”.
However, several risks showed greater variance in alignment. For instance, the respondents differed significantly about the allocation of “market conditions” where DOT respondents predominantly indicated an allocation of transferred to private sector while Industry respondents predominantly indicated shared.
Other variances included: “hazardous materials”, “railroad involvement”, “right-of-way and easements”, “schedule/phasing issues” and “utility issues.”
CM/GC and Progressive DB
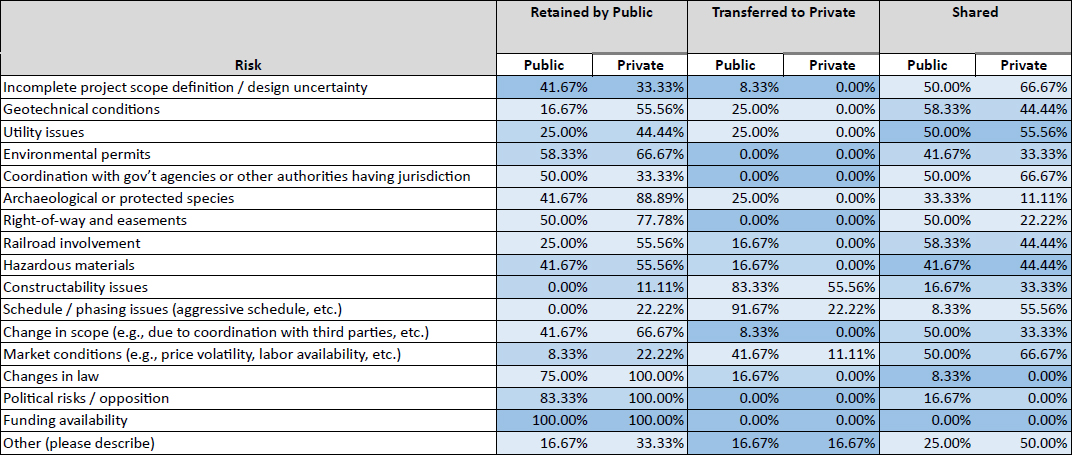
Figure 3.6 displays a “heat map” of how DOTs (public) typically allocate risks in CM/GC or PDB projects versus how industry representatives (private) would prefer them to be allocated. The darker the blue indicates the higher the intensity (percentage) of agreement.
Public-Private Partnerships
Figure 3.7 displays a “heat map” of how DOTs (public) typically allocate risks in P3 projects versus how industry representatives (private) would prefer them to be allocated. The darker the blue indicates the higher the intensity (percentage) of agreement.

3.2.2 Interview Findings
Discussions of risk allocation during the DOT interviews primarily focused on the practices used for fixed price DB projects, with most interviewees noting that risk allocation and management strategies are typically driven by project-specific conditions. Nevertheless, the strategies that were discussed are largely consistent with the practices identified through the research team’s content analysis of RFP and contract documents (see Section 2.2). For example:
- Geotechnical conditions. Most of the DOTs interviewed indicated that soil boring data and/or geotechnical reports are provided with the RFP, but it is left to the DB team to analyze and interpret the information. Two interviewees were exploring the use of adopting VDOT’s practice of allowing for a scope validation period.
- Utility coordination. Practices used to allocate utility risks varied by DOT. Some of the interviewees indicated that their contracts typically include an allowance for relocation costs (some DOTs applied a cap to this allowance; others did not). One indicated that they apply a costsharing provision to the allowance to motivate the DB team to optimize the design to minimize relocations. Some DOTs transferred all schedule risk related to utility relocations to the DB team; others stipulate a “date certain” by which time the DB team can reliably assume the work will be completed.
- ROW. Most interviewees indicated that they attempt to address ROW issues in advance of procurement activities to reduce the risk.
- Third-Party Approvals. Most interviewees indicated that they retain or attempt to eliminate thirdparty approval risks.
- Railroad Involvement. Several interviewees commented that extensive railroad involvement can present a major risk to a DB project and may sway them towards using a progressive delivery approach or DBB. For DB projects that entail railroad coordination, one DOT indicated that it requires the DB team to designate a “Railroad Coordinator” as part of their key personnel.
3.3 Risk Identification and Assessment by DOTs
3.3.1 Use of Risk Registers
The interviews with DOT representatives discussed their overall process for risk identification and assessment. The vast majority described the development and evolution of a risk register for projects. Many explained that a preliminary risk register is developed at the initial stages of a project, and its comprehensiveness will depend on the scale and complexity of a project, i.e. larger and complex projects will have more thorough risk registers. Further, both qualitative and quantitative methods are used for risk assessment, with qualitative assessments being more prevalent in the earlier stages of a project. Several described the use of risk workshops with key staff to identify and assess risks at different points in a project’s planning.
As a project evolves towards procurement, some DOTs described the inclusion of their risk register in a project’s procurement documents as a means to communicate with prospective proposers/bidders of the
DOT’s perspective of a project’s risks. In subsequent interviews with industry representatives, this practice was applauded. An industry representative commented:
The better we understand each other and each other’s goals and perspectives of a project, then the better we are able to align and achieve those objectives. Seeing their risk register in the procurement documents, and saying well that’s interesting. Here’s ours. This is an important step that is going to allow us to work toward alignment.
3.3.2 Impact of Project Risk Profiles on Project Delivery Decisions
The interviews with DOT representatives also made it clear how a project’s characteristics and risk profile will impact the selection of a project delivery method. One DOT representative commented:
There are unique aspects of every project that can make it a much stronger candidate for one delivery method versus another, but oftentimes it usually comes down to the fact that our staff feel that the project would benefit from early contractor involvement in some way…that we just can’t get from design-bid-build.
The DOT interviewees largely acknowledged that fixed price DB contracts, given the number of unknowns that may remain at 10 to 30% design, will often have a high level of risk to allocate between the parties at contract award, and that misallocation of this risk can result in increased owner costs through either high bid premiums, reduced competition, and/or post award change orders or claims.
Recognizing this challenge, several DOTs are moving towards the use of progressive delivery methods (either CM/GC or PDB) to better mitigate risks and potentially reduce contingency pricing on projects with significant third-party risks, design uncertainty, and/or complexity.
Most industry interviewees were similarly encouraged by the potential of progressive delivery methods to manage risk:
- The contractors/developers that were interviewed voiced almost universal support for progressive approaches (i.e., Progressive DB and CM/GC), with several noting that the preconstruction phases have been encouraging thus far in their ability to “de-risk” the project and allow for reductions in project contingency. There was an exception to this view voiced by a major P3 contractor that prefers fixed-price agreements because although risks are higher, there is a greater potential for reward.
- Interviewees from design firms commented that progressive methods require participants to be much more collaborative during design development and overall project execution and, when used with open book pricing, can result in better management of pricing issues related to scope definition, third party stakeholders, utilities, and ROW.
However, some DOT interviewees indicated they had concerns regarding obtaining a fair price given the lack of competitive tension associated with progressive methods. Other DOTs noted issues with selection of service providers in such arrangements. For instance, one DOT indicated that they would prefer qualifications-based selection in CM/GC or PDB, but they face both regulatory and practical constraints in doing so. On the Brent Spence Bridge Corridor PDB project that is being jointly managed by the Kentucky
Transportation Cabinet and Ohio DOT, the public agencies would have preferred a qualifications-based selection, but Ohio procurement regulations required a pricing component. Hence, preconstruction service fees were included as selection criteria.
Designers in turn expressed concerns about performing Phase 1 preconstruction services under a fixed price arrangement for progressive DB, noting that this practice may place too much risk on the design team to effectively perform site investigations, alternatives analysis, quantity estimating, or NEPA document preparation.
3.4 Practices Implemented by DOTs to Promote Alignment of Risk Perceptions
3.4.1 Practices Implemented during Planning, Procurement and Contracting
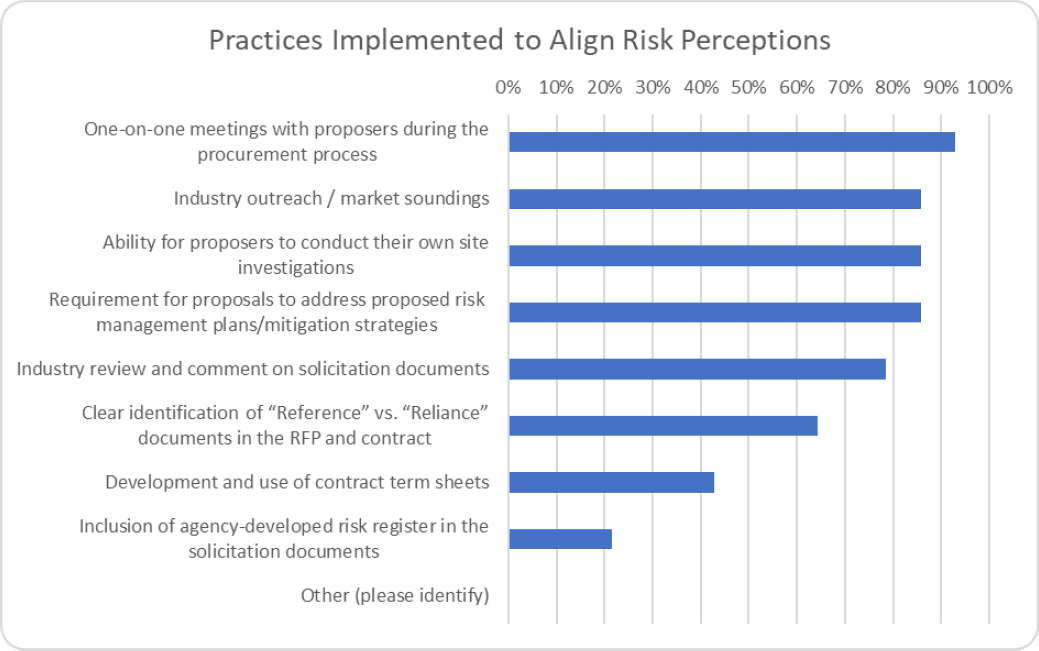
The survey asked DOT/owner representatives what practices their agency uses to promote alignment of owner and industry perceptions of project risks during project planning, procurement and contracting when using APD methods. Figure 3.8 shows the percentage of respondents who indicated the use of specific practices for aligning risk perceptions.
One-on-One Meetings
The survey results demonstrate that direct engagement with industry via one-on-one meetings or industry outreach sessions are frequently employed (>90% and 85% respectively) to align risk perceptions. The significance of one-on-one meetings was confirmed by interviews with both DOT and industry
representatives. Most DOT interviewees indicated that one-on-one meetings were the most effective method for adjusting perspectives of risks. Moreover, such meetings can allow greater dialogue and communication about a project’s goals, constraints and technical issues. A DOT representative noted:
In our design-build projects, we do a series of one-on-one meetings with the proposers where we’ll take a look at the risk profile and ask them to give us some feedback on whether or not they are comfortable with the allocation of risk. They may not be happy with a particular risk, so we’ll consider things like capping a risk or adjusting the risk trigger point.
Industry representatives had similar perspectives, with several noting that the one-on-one meetings are the forum used to advance risk assessments and negotiate how to apportion and allocate or share risks fairly in the contract through the use of allowances or deductibles with risk caps. For example, a specific risk (e.g., geotechnical, utilities) may be assigned a deductible (say $10M) where the contractor team is responsible up to the deductible limit and the owner pays anything exceeding this amount. Conversely an allowance with an overall cap may be used (say $30M) where the owner pays 100% of the first $20M, the next $10M is shared 50%-/50%, and the Contractor is responsible for all costs exceeding the $30M cap. A similar approach can be used for proposed time durations and savings. The Contract may also provide incentives for the parties to share the savings if costs (or time) for the work are less than the cap. The risk allocation and sharing schemes generally define how the risks will be managed by the parties, reduce uncertainties (and risk premiums) for proposers, and incentivize industry to mitigate anticipated risks.
Such schemes are perceived as being best discussed during one-on-one meetings. As commented by one industry representative,
One-on-one meetings help tremendously throughout the process, particularly once the RFP is out. In these meetings, we can explain why a particular risk will get priced in a certain way if it remains as is in the documents, so owner gets to reconsider that. These meetings get progressively more important as a project evolves.
General Industry Outreach and Engagement
During the interviews, several DOTs discussed more general engagement with industry groups outside of any specific project. Some DOTs have (or had) organized industry groups that they engage with while others have used periodic meetings/forums with industry representatives to garner feedback about their practices that include risk-related issues. One DOT has also used YouTube videos as instructional tools to assist prospective contractors understand APD methods and their agency’s processes, and this DOT has found that this practice has also benefited its own personnel.
This type of outreach and input helps DOT to communicate with and adjust its practices for its key service providers. One industry interviewee commented: “a good owner needs a successful industry.” Such tools and sessions can certainly help the industry overall.
Industry Outreach / Market Soundings (project specific)
The interviews provided a mixed view of “industry outreach/market sounding sessions”. While noting that such sessions could be useful for communicating project goals, scope and key issues, most DOT and
industry representatives felt that the general and open nature of these forums would not provide an appropriate vehicle for in-depth discussions about particular project risks and issues.
However, industry representatives indicated information shared by DOTs at these sessions regarding progress on statutory clearances (such as NEPA), the type and extent of stakeholder outreach completed, and timeframes for subsequent steps in the procurement process, help them gauge a project’s preparation or readiness as well as potential attractiveness.
Industry Review of Draft Solicitation Documents
Another practice identified in the surveys and viewed favorably in the interviews is “industry review and comment on solicitation documents”. While some DOTs do not necessarily have the flexibility to broadly negotiate terms and conditions during procurement due to regulatory constraints, interviewees found this practice essential to “honing” documents to fit a project’s context and circumstances. One industry representative commented that this is essential to projects with any scale or complexity employing APD methods. However, another industry representative commented about an owner’s receptiveness:
If an owner is going to ask for input, then they need to be receptive and responsive to it. Otherwise, contractors won’t provide candid and potentially beneficial feedback, so it’s wasted effort.
Term Sheets and Risk Registers
Practices that were less common included “development and use of contract term sheets” and “inclusion of agency-developed risk register in the solicitation documents”. Interviews with industry representatives suggested that general or project-specific term sheets are quite useful for conveying how an agency may or expects to treat key risks such as utilities, right-of-way acquisition, hazardous materials, etc. This helps industry players determine how an agency typically treats a risk or how it plans to handle a risk for an upcoming project prior to the start of a procurement.
Contract Templates for APD Methods
Both DOT and industry interviewees commented on the value of published contract templates for different APD methods. These provide a baseline of understanding for risk-related issues as well as other terms and conditions. One DOT representative noted:
We did a lot of industry outreach to develop our contract template, which established a basic agreement about risks and terms. Then, on a project-by-project basis we will tweak the template as we discuss and develop the final contract documents.”
3.4.2 Practices Implemented by DOTs Post-Award
The survey also asked DOT/owner representatives what practices their agency uses to help manage risk during the post-award phase of an APD project. Figure 3.9 shows the percentage of respondents who indicated the use of specific practices for post-award risk management.
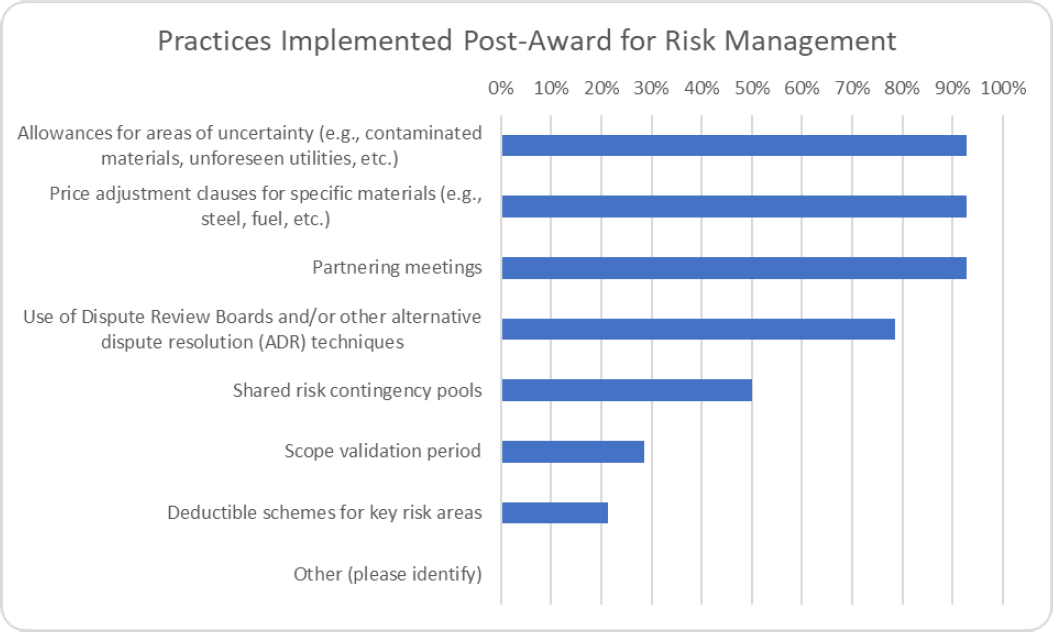
Risk allowances with caps, price adjustment clauses, and partnering meetings are the most frequently employed practices with over 90% of DOT respondents indicating their use.
Nearly 80% indicated use of dispute resolution boards (DRBs) or other alternative dispute resolution methods.
Interviewees had a mixed perspective of partnering. While many agencies and projects employ partnering, a number of interviewees indicated that the effectiveness of partnering, not surprisingly, depends on the people involved. Without the right personnel on both sides, then partnering practices will likely not harm a project but they will not help it. Additionally, one interviewee noted that partnering requires executive support from the counterparties as well.
All interviewees recognized the importance of an expedient and reasonable dispute resolution process. However, the process will vary from DOT to DOT based on preferences and/or statutory requirements. For instance, one DOT follows a typical stepwise process for dispute resolution where project personnel will initially attempt to handle it, then it will elevate to a district office. If unresolved, it will then rise to the state’s Office of Construction and then to a state board for contract appeals.
Several interviewees spoke favorably about the effectiveness of DRBs since they are comprised of knowledgeable personnel who are typically selected by both parties. Often, they can provide a decision in a timely fashion, but it is obviously not binding. One industry representative commented:
A DRB can be very effective. On the one hand, it keeps a public agency honest since they cannot simply stand firm against a reasonable claim. On the other hand, it helps force a contractor to bring forward legitimate claims where the grounds for entitlement are strong.
Finally, the scope validation period that VDOT employs is not widely used (less than 30%). However, a few DOT interviewees commented about this practice. One noted:
In design-build, we’ve historically provided contractors with boring data that they can rely on for that location, but anything between the boring locations is at their own risk. We’re looking into Virginia’s scope validation period since that appears a fairer way to allocate and manage geotechnical risks.
3.5 Factors Influencing Pursuit of APD Projects by Developers, Contractors, and Designers
3.5.1 Survey Feedback
The survey asked industry representatives to rate, on a scale of “very low” to “very high”, the extent to which particular factors might impact the decision by a developer or a contractor to pursue a project. Figure 3.10 displays the responses as a “heat map” where the darker shades of blue indicate the intensity (percentage) of the ratings received. Respondents identified the following as “other” factors:
- Very High: Contract terms and conditions, schedule of performance, advancement of major project permits, appropriate risk allocation
- Moderate: Experience working with the client, best value vs. price criteria, suite of advisors to owner
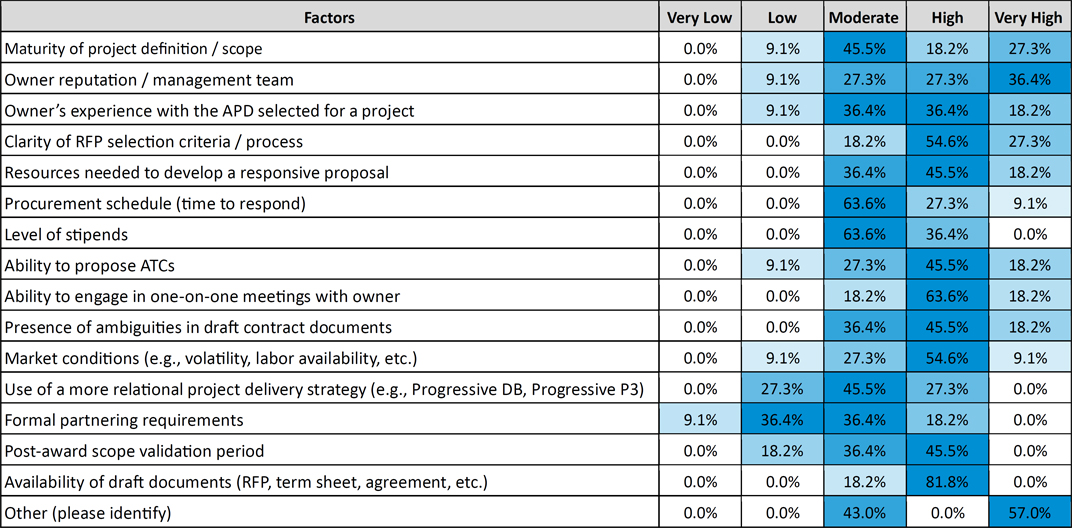
(darker blue = higher intensity)
The heat map illustrates that nearly all of the factors considered skew toward moderate to very high. The only factor skewing toward moderate to very low was “formal partnering requirements”, where interview results regarding such were discussed in the prior section. Similarly, respondents were fairly neutral about the use of a more relational project delivery strategy and industry interviewees confirmed this perspective. While they
were generally receptive to and positive about these approaches, they were not yet convinced that they were a remedy to the issues with APDs. One industry representative commented:
Certainly, progressive approaches are getting a lot of attention, but will they outperform a well conceived project and well-run competitive procurement? I think the jury is still out.
3.5.2 Additional Interview Findings
Reputation and Experience of the Owner’s Project Team
A resounding message from the contractor industry interviewees was the significance of the owner’s reputation and experience with APD methods as a key factor when deciding whether to pursue a given project. One interviewee cited “owner reputation” as being the dominant factor when considering a project, down to who is likely going to be on the owner’s project procurement and management team as well as what consultants have been engaged. Another industry interviewee commented:
The first thing that we look at is who the authority is and what’s their level of experience and expertise. Who have they brought on board to help guide them through the process? That’s very key because they are going to be our partner and for P3s they are going to be our partner for 30 or 50 years. We have to make sure there is alignment with values, goals and objectives.
Industry design professionals further reinforced this issue stating, that if the General Engineering Consultant (GEC) team representing the owner are unknown, inexperienced with APDs, or are incentivized (under cost-plus fee agreements) to excessively comment on submittals or over inspect the work, this would be another consideration for declining to pursue a project.
Political Environment
In addition to the reputation of the owner and its consultant, industry interviewees also strongly emphasized the political environment as well as the project’s champion:
We want to look at the project champion and community support, or what’s driving the project. Who’s against the project? But you really want a high-level and stable project champion, and with two-to-four-year election cycles, this can be challenging.
Industry interviewees made it clear that if these high-level factors (i.e., owner reputation and political environment) are not favorable, then they will decline to pursue a project.
Availability of Draft Documents
Another clear message was the significance of the availability of draft documents. One industry interviewee commented:
Draft documents or indicative term sheets need to be out even before an RFQ hits the street. Because by that time a lot of teams have already formed, and a lot of players have made up their mind whether they’re in or out. They’ve made this decision on preliminary information. The better the information is, the better the teams are going to be. Additionally, this will help keep teams
from dropping out. Since the chance for surprises will be less once the RFP comes out or one-onone meetings happen.”
Additional Factors Cited by Contractors/Developers
Aside from the factors noted above, contractors and developers reported several other issues that may affect their pursuit of projects, particularly for fixed price DB or P3 projects. Such considerations included the following:
- Project size, complexity, and risk profile. Large APD projects (>$1B) with significant 3rd party, geotechnical, utility, right-of-way, or hazardous materials risks are much more challenging under a fixed price/lump sum contract.
- Surety input. The surety industry has changed dramatically over the past 4-5 years making larger lump sum/fixed price projects challenging. Any “ultra mega” project (i.e., greater than $2B) is extremely challenging from a surety standpoint (with multiple caveats depending on project specifics). Smaller lump sum/fixed price DB contracts ($500M-$1B) are perceived as being more manageable.
- Environmental processes. For fixed price DB, contractors may be hesitant to pursue an opportunity if the NEPA and other environmental documents (or state environmental process if there is no federal funding) are not advanced sufficiently or permits await approval prior to the completion of the procurement process.
- Availability of suitable teaming partners. When weighing opportunities, contractors will also consider the experience and suitability of available teaming partners including a JV partner, if necessary, a strong design partner (for DB), and key subcontractors.
- Procurement schedule. Consideration will be given to the reasonableness of the procurement schedule, including whether there is sufficient time for investigations, industry review and input, one-on-ones, and preparation of qualifications and/or technical packages.
- Risk sharing provisions. Are risk assessments sufficiently advanced with equitable contract risk apportionment provisions, pricing, and risk caps in place or able to be negotiated as part of the procurement?
- Transparency. Is a fair/transparent evaluation and selection process in place?
Additional Factors Cited by Designers
Industry design professionals generally agreed with the factors identified by the contractors/developers as discussed above. In addition, they also identified the following additional risk issues that might affect their decision to pursue a particular APD procurement as part of an industry team:
- Unlimited or unreasonable or liability insurance provision levels (and/or lack of caps)
- Owner or contractor lack of experience with APD methods placing unreasonable or misallocated risks on the designer of record (e.g., for quantities, estimates, schedules).
- Incentive-based compensation schemes that rely on estimated quantities at 30% design under a lump sum agreement.
- Elevated Warranty or Standard of Care provisions for DB that do not consider obvious differences in standard of care for design versus construction services.


