Minority Students in Special and Gifted Education (2002)
Chapter: 2 Representation of Minority Students in Special and Gifted Education
2
Representation of Minority Students in Special and Gifted Education
Are minority children disproportionately represented in special and gifted education? On the surface, the question is straightforward. How “disproportion” is defined, however, determines whether the question can be answered. If the referent is the population of minority students, then one can simply compare the proportion identified with the proportion in the total student population. If, however, we are asking whether the number identified is in proportion to those whose achievement or behavior indicate a need for special supports, then the question is one for which no database currently exists. In this chapter, we compare the numbers of students of each race/ethnicity identified for special and gifted education with their representation in the student population. The reader should keep in mind, however, that these data cannot tell us about the appropriateness of assignment and, by themselves, they provide a very weak foundation for guiding public policy.
Some researchers have attempted to explain observed differences in placements by race/ethnicity using available data. Special education data at the district level have been analyzed, controlling for sociodemographic characteristics of the district, and conclusions have been drawn about the patterns that emerge. To understand differences in assignment to gifted programs, other data sets that provide information on socioeconomic characteristics of families have been correlated with high achievement data. We address the limitations of these data analyses before turning to conclusions and recommendations.
FEDERAL DATA SETS
Two federal agencies currently report data on enrollment of students in special education programs broken down by racial/ethnic group: the Office of Special Education Programs (OSEP) and the Office for Civil Rights (OCR), both in the U.S. Department of Education. OSEP has reported for over two decades to Congress on the implementation of Public Law 94-142 (and later, the Individuals with Disabilities Education Act [IDEA]), including data on the number of children served under the various disability categories. However, the child count data reported by OSEP were not broken down by racial/ethnic group until the last two reporting periods. OCR, in contrast, has consistently monitored minority representation, but only in the few disability categories with which it is concerned. Until 1994, these included mild mental retardation, emotional disturbance (ED), specific learning disabilities (LD), and speech and language impairments (SLI). Since that time, however, OCR has collected data on the broader category of mental retardation (MR), no longer differentiating “educable mental retardation” and “trainable mental retardation” (in earlier surveys) or among “mild mental retardation,” “moderate mental retardation,” and “severe mental retardation” (in the 1992 survey). In addition, in 1994 OCR discontinued monitoring of speech and language impairments and began monitoring enrollments in programs for gifted and talented students.
In federal reporting of data by race/ethnicity, five groups are specified: (1) American Indian/Alaskan Natives, (2) Asian/Pacific Islander, (3) Hispanics, (4) blacks, and (5) non-Hispanic whites. Using the OSEP and OCR datasets one is unable to examine rates for subgroups, such as Puerto Ricans, Cubans, or Mexican Americans as these are all aggregated into a single Hispanic category. And a student can be classified in only one group; “mixed race” is not an option.
Disability Categories of Concern in This Report
Concern about overrepresentation of certain minority group children in special education has focused almost exclusively on a few disability categories. In the earlier NRC report (National Research Council, 1982) the focus was exclusively on children classified as mildly mentally retarded (MMR), the category at issue in litigation challenging the fairness of intelligence testing as the “reason” behind disproportionately high enrollments of black and Hispanic children in special education programs (Reschly, 1988a). In the years since that report, the focus has broadened to include LD and ED. Concern has been raised as well over the underrepresentation of children from these same minority groups in programs for the gifted and talented. The categories MMR, LD, ED, and gifted and talented are some-
times referred to as the “judgmental” categories because the children so classified typically do not exhibit readily observable distinguishing features, and the authoritative diagnosis of medical professionals, which is common in assessment of many of the low-incidence disabilities, is absent. Categories like visual or auditory impairment may also involve judgment in more marginal cases regarding when the impairment becomes a disability, but the diagnosis of impairment by medical professionals is not called into question.
The potential importance of judgment is suggested in the wide variation in placement rates in the judgemental categories across states—variation that is substantially greater than in the low-incidence disability categories. MacMillan and Reschly (1998) found that the ranges of identification rates across states for LD, SLI, MR, and ED were considerable, far greater than one would expect for a given disability. For example, Massachusetts identified 3 times as many children as LD than did Georgia; New Jersey identified 3 times as many children with SLI than did Georgia; Alabama identified 10 times as many children with MR as did New Jersey; and Connecticut identified 41 times as many children with ED as did Mississippi.
Inadequacy of Datasets
At present, a considerable amount is spent on the data collection efforts of OSEP and OCR, yet the data reported are inadequate for informing policy. While the most fundamental limitation is the absence of data on incidence with which to compare placement rates, the placement numbers by race are themselves problematic. Neither disability status nor ethnicity is measured very precisely (MacMillan and Reschly, 1998).
Race/Ethnicity. The imprecision inherent in specifying a child’s race/ ethnicity in these datasets is apparent when one considers that the data are aggregated from the school building to the district to the state to the national level in the OSEP process. For OCR, race/ethnicity is recorded from district records. Any variation in practices for determining race/ethnicity at the school building or district level is obscured when considering state or national figures. One and only one box is checked on the school form, and the person making the decision varies from school district personnel to the child’s parent. The Office of Management and Budget’s Statistical Directive 15 urges that racial and ethnic categories should not be interpreted as scientific or anthropological in nature—yet the datasets summarized here are used in just this way (Hodgkinson, 1995). Phinney (1996) explains that “even within an ethnic group whose members share a relatively precise ethnic label there is tremendous heterogeneity” (p. 919). Variability in
social class, income, education, generation of immigration, family structure, and geographical region is not captured by the racial/ethnic designation. Phinney goes on to note that “ethnicity cannot be treated like an independent variable that explains an outcome” (p. 924), yet that is precisely what is sought when one examines the bivariate relationship between ethnicity and disability status. In the case of biracial children, the confound is even more severe, as there has not been a “mixed” box for parents to check and a child is forced into one of the extant boxes, suggesting that “everyone in the category belongs completely in that box” (Hodgkinson, 1995:175).
Disability Status. In both the OSEP and OCR surveys, the disability status (i.e., the specific disability category) of a child is, in the vast majority of cases, taken directly from school records—that is, the children are “school identified” as qualifying for special education by virtue of qualifying for a specific disability category. In traditional epidemiological studies, the concepts of prevalence (total number of cases at a given point in time) and incidence (number of new cases) are employed. The figures reported in the surveys considered here are assumed to be prevalence figures; however, there is a lack of precision in the school’s ability to detect “true” cases of disability, particularly in the judgmental categories. Stated differently, we do not know what the true prevalence of these conditions would be if specific criteria were applied rigorously in screening the population of children.
As a result, there are many false positives and false negatives in identification, introducing error of an unknown size (but known to be substantial, particularly in the LD area) (see Gottlieb et al., 1994; MacMillan et al., 1998a; Shaywitz et al., 1990; Shepard et al., 1983). Comparability across states is difficult, in part, because the states have differing criteria for eligibility. Mercer et al. (1996) surveyed state criteria for defining LD particularly in the method for calculating discrepancy (i.e., standard score discrepancy vs. regressed discrepancy) and the magnitude of the aptitude-achievement discrepancy (e.g., 1 SD, 1.5 SDs) required. Frankenberger and Fronzaglio (1991) and Denning et al. (2000) analyzed state guidelines for defining mental retardation and again reported considerable variability. On the criterion of intellectual level, Denning et al. (2000) reported that 13 states have no IQ cutoff score, Ohio and Pennsylvania use IQ 80 as the cutoff score, while most set the IQ cutoff score at IQ 70 or –2 SDs.
Giftedness. The issues plaguing the assignment of disability status also contaminate the collection of data on children identified as gifted and talented. The lack of national legislation governing the definition of, or services for, gifted and talented students has left each state with the pre-
rogative of defining the construct. Even the definition suggested by the federal government and adopted by many states includes a wide variety of categories, which in some cases overlap and in others are presumably independent. For example, one would expect some overlap between creativity and exceptional performance in the arts, yet there is no reason to expect the same degree of overlap between those who are gifted in a specific academic area (e.g., mathematics) and those gifted in the domain of leadership. The definitions at the federal level and most state levels are also complicated by the phrases “children and youth with outstanding talent who perform or show the potential for performing” and “when compared with others of their age, experience or environment” (U.S. Department of Education, 1993:26, italics added), leaving the interpretation of potential open and making the category of giftedness relative to local school or school system populations. That relativity is rational regarding provision of services: a given student may need special services in a gifted program in a school in which the curriculum is not adequately challenging, but not in a school with a more challenging general curriculum. But a consequence of relativity is that the data on assignment to gifted and talented programs are far more difficult to interpret.
Denominators. OSEP requires states to report on the number of children in disability categories by age and (recently) race/ethnicity. They do not collect data on the total number of students (with and without a disability label) by age and race/ethnicity, however. The National Center for Education Statistics (NCES) collects data on student enrollment by race and grade, but not by age. The NCES data can be roughly, but not precisely, paired with the OSEP data. Of particular concern, children who are 6 years old may be in either kindergarten or first grade. They are not likely, however, to be in preschool. NCES provides numbers for preschool-12 enrollment, but these numbers are certainly too high. Subtracting out the preschool children would improve the count, but many states do not provide separate data for preschool, and the lack of uniformity in state counts of preschool children make these numbers hard to estimate reliably.
State-to-State Variations
The National Association of State Directors of Special Education (1999) reported on a survey of state practices in reporting child count data to the U.S. secretary of education. Findings of the survey illustrate variations and anomalies across states that potentially challenge the reliability and validity of the data reported. Variations in practices in the local education agencies similarly compromise the quality of the data reported to OCR, which gathers data at the district, rather than state, level. Among their findings were
that some states use categories of disability that differ from the federal categories.
The most common difference was for the category of mental retardation. For example, alternative terms are used in several states: significant limited intellectual capacity in Colorado, cognitive delay in Montana, intellectual disabilities in Utah, and cognitively disabled in Wisconsin. Certain states that do not use one of the federal disability categories report zero children in their child count reports: West Virginia and Wisconsin do not use multiple disabilities, and Colorado does not use other health impaired. In Arizona, the category deaf-blind is not used: local education agencies report these cases in the category of multiple disabilities, while cases of deaf-blind children reported in the Arizona count are students identified as deaf-blind by the Arizona School for the Deaf-Blind. Local education agencies in Montana report all disabilities that each student is considered to have and the state education agency, in turn, assigns a single federal disability category to each child.
The survey also sought to explain “extreme” counts—that is, child counts for a specific disability or age group that were significantly higher or lower than the national average. Several states pointed to extreme poverty as contributing to high rates of mental retardation, multiple disabilities, and speech and language impairments. Aggressive and successful child find procedures were cited by directors in Maine, Rhode Island, and West Virginia for higher rates. Low child counts in the ED category were attributed to insufficient personnel in Arkansas and Mississippi, while these same states indicated that the stigma associated with the ED label is a contributor to lower counts.
States having noncategorical programs vary in how they report child count data. In Pennsylvania and Washington, a child is determined eligible under IDEA and then a disability category is assigned. In Iowa and Massachusetts, “formulas” are used to convert noncategorical counts to disability counts. “In Iowa, percentages for each federal disability category are based on incidence rates from 1986, 87, and 88, before the state became categorical. Massachusetts uses a formula based on disability category estimates from 98 percent of the LEAs, that was updated in 1992” (National Association of State Directors of Special Education, 1999:6).
For giftedness, the various states have adopted selected parts of the federal definition or created their own. Coleman and Gallagher (1992) report that 49 states include intelligence or general intellectual ability and achievement in their definitions, 40 states include creativity, 34 states include artistic ability, 28 states incorporate leadership ability, 15 states embrace critical thinking (not included in the federal definition), 26 establish leadership as a domain of giftedness, and 10 states include psychomotor
abilities, although that category was dropped from the federal definition in 1978.
As might be expected, the states have widely varying laws, rules, guidelines, and regulations regarding the identification of gifted students. Some states, for example California, provide standards that are very general and might be considered only as principles to be followed. The California regulations include statements such as “methods and techniques for identification shall generate information as to a pupil’s capacities and needs” (Passow and Rudnitski, 1993). Some states specify instruments to be used, while others go further to define scores required using specific instruments (such as a full-scale score of 130 on the Wechsler scales, 132 on the Stanford-Binet, or 130 on the Kaufman Assessment Battery for Children. Furthermore, some states have specified differing procedures or instruments to be used in identifying students who are considered “disadvantaged—‘economically, culturally, and/or environmentally’” (Passow and Rudnitski, 1993). In the identification of a child as gifted and talented, there are not 50 differing approaches, but innumerable ones.
Whether for special or for gifted education, there are clearly sufficient variations and anomalies across states to urge extreme caution in interpreting data.
Other Factors Compromising Interpretation of Data
A further consideration is that prior to 1997 states could be reimbursed for “up to 12 percent” of their school population under IDEA. While the precise influence of this cutoff point is unknown, it could have served to truncate identification in earlier years once the cap was approached. The quality of the data is potentially further compromised by variability in who reports the data at the local district. Differences in qualifications and familiarity with the district programs (a clerk at the district office vs. the director of special education for the district) could influence the accuracy of the data submitted.
In terms of state funding of services for gifted and talented students, Passow and Rudnitski (1993) have documented considerable diversity and complexity. Some services are tied to special education appropriations. In Alabama, funding “shall not exceed the average per pupil appropriation for all exceptional children in each school district, including allowances for teacher units, transportation, and all other aid for exceptional children (Passow and Rudnitski, 1993:64). Florida’s funding formulas for gifted students are tied to “severity” of the giftedness and hence level of placement of the child, with those in homogeneous classrooms qualifying for greater funding. Other states base funding on a percentage of average daily attendance equivalency (e.g., “an amount not to exceed $100 per K-12 pupil for
up to 5 percent of the district’s or consortium’s K-12 membership”). Some states reimburse only for the salary and benefits of the instructional personnel who provide services exclusively to gifted and talented students. In combination, these influences may have greater influence on the total number of students identified as gifted and talented than on the educational needs of students.
Efforts to collect reliable and valid data on gifted and talented enrollments have been stymied in various ways. Since federal efforts are limited to OCR data collection, the organization of state directors of gifted programs has attempted to collect data by surveying its membership. In their latest survey, only 43 states responded and data from many of the other states were incomplete. The conclusion of this group is that it is “quite apparent that complete, reliable data about gifted student education within states are not readily available” and “comprehensive information about gifted education throughout the United States is most difficult to produce” (Council of State Directors of Programs for the Gifted, 1999:9).
REVIEW OF THE DATA
Despite the limitations of the data, they are useful in some important respects. They provide an indicator of school placement rates in various categories of disability over time. While any individual figure may be imprecise, consistent patterns over time are informative. The numbers may indicate more about the variation in state and local practice than about differences in student populations, but this variation is of interest for policy monitoring. Comparison of placement rates for different racial/ethnic groups can appear quite different in magnitude when different indices are used to present identical data. One can report that in 1998 1.45 percent of black students, and 0.91 percent of white students were labeled ED, or one can report that black students were 17 percent of the student population, but 27 percent of the ED population. The underlying numbers are the same, but the impression is somewhat different. We present the OCR and OSEP data using three different indices, each of which communicates disproportion somewhat differently.
Calculations
Risk Index
The risk index (RI) is calculated by dividing the number of students in a given racial or ethnic category (e.g., Hispanic) served in a given disability category (e.g., LD) by the total enrollment for that racial or ethnic group in
the school population. Hence, the “risk index” reveals the percentage of all students of a given racial/ethnic group identified in a given disability category. The 1998 risk index of 6.02 for white students in the LD category reveals that just over 6 percent of all white students were labeled LD.
Odds Ratio
The odds ratio (OR) divides the risk index of one racial/ethnic group (e.g., black) by the risk index of another racial/ethnic group (e.g., white) and thereby provides a comparative index of risk. All odds ratios reported here are relative to white students. If the risk index is identical for a particular minority group and white students, the odds ratio will equal 1.0. Odds ratios greater than 1.0 indicate that the minority group students are at greater risk for identification, while odds ratios of less than 1.0 indicate that they are less at risk.
The 1998 LD odds ratio for American Indian/Alaskan Natives is 1.24, revealing that they have a 24 percent greater likelihood of being assigned to LD than whites. This is obtained by dividing the American Indian/Alaskan Native risk index (7.45) by the white risk index (6.02). It should be noted, however, that the odds ratio does not reveal the absolute rate at which children from a given racial/ethnic group are identified by the schools in various disability categories.
Composition Index
The composition index (CI) is calculated by dividing the number of students of a given racial or ethnic group enrolled in a particular disability category by the total number of students (summed across all five racial/ ethnic groups) enrolled in that same disability category. It therefore reflects the proportion of all children served under a given disability category who are members of a given racial/ethnic group. Note that the sum of composition indices for the five racial/ethnic groups will total 100 percent. The composition index does not control for the baseline enrollment of a given racial/ethnic group. Therefore, knowing that 53 percent of all MR students in a given state are white is not immediately interpretable without knowing the percentage of the total enrollment that is white. If, in a hypothetical state, whites constituted 85 percent of the total enrollment of students, one might conclude that whites are underrepresented in the MR category. Conversely, if whites constituted only 15 percent of the total enrollment, a very different conclusion would be warranted. We introduce this term because a variation of the composition index was used extensively in court cases concerned with overrepresentation. In Larry P. v. Riles (1972, 1974, 1979, 1984, 1986), for example, the plaintiffs presented the following figures to document overrepresentation of black students in the mild MR category: whereas 25 percent of the total mild MR enrollments were black, black students constituted only 10 percent of the California school enrollments.
Organization of Our Review
In the following sections we summarize data from OCR and OSEP on the relative participation of students from the five racial/ethnic groups in the various disability categories. Because the two data-collection efforts are separate, we look at the indices from both. While there are some differences between them, the discrepancies are small: the two datasets tell a very similar story. We begin by considering the three categories monitored by both OCR and OSEP (MR, LD, and ED), then report on the gifted and talented data monitored by OCR but not by OSEP. Finally, we report on the remaining disability categories recognized under IDEA and monitored only by OSEP.
For each category, we first present data on risk indices and odds ratios for 1998, then we show patterns over time. The time trends rely on the OCR data, as OSEP has only recently required that child count data be broken out by racial/ethnic group.
Mental Retardation
Recent Surveys
The most recent survey data available from OCR are for 1998, and for OSEP, 1999. For comparison purposes, we use indices calculated from 1998 data from both sources. The 1998 OCR survey using national projections (see Table 2-1) reveals that black students are most at risk for identification as MR (RI = 2.64 percent) with American Indian/Alaskan Natives the next highest (RI = 1.28 percent), followed by whites (RI = 1.18 percent). Hispanic students are at considerably less risk (RI = 0.92 percent) with Asian/Pacific Islander lower still (RI = 0.64 percent). The same pattern is evident in the 1998 OSEP data, although the risk indices based on actual child counts vary slightly.
Comparing these rates for the four racial/ethnic groups with that of white students reveals that black students are more than twice as likely to be identified as mentally retarded (OCR OR = 2.24; OSEP OR = 2.35), with American Indian/Alaskan Natives being identified at about the same rate as whites (OCR OR = 1.09; OSEP OR = 1.07). Both Hispanics (OCR OR = 0.78; OSEP OR = 0.87) and Asian/Pacific Islander (OCR OR = 0.54; OSEP OR = 0.51) are considerably less at risk than are whites for identification as MR.
The composition index for the racial/ethnic groups suggests that whites constitute approximately 54 percent of the total MR enrollments (compared with 63 percent of the student population), while blacks account for 33 percent of the MR enrollments but only 17 percent of the student population.
TABLE 2-1 Indices of Placement for Mental Retardation by Race/ Ethnicity: 1998 OCR and OSEP Data
Trends Over Time
Over the past 25 years, there has been a substantial reduction in the rate at which students are classified as mentally retarded by the schools (MacMillan et al., 1996c). Examination of OCR survey national projections over time for MR (Table 2-2) suggests that rates for black children have consistently been higher than rates for other racial/ethnic groups. From a high of over 4 percent of black children identified as MR in 1976, the risk index shows a gradual decline until it reaches 2.23 percent in 1998. These data are also displayed in Figure 2-1.
Extremely low risk is evidenced for Asian/Pacific Islander students across surveys, staying very close to 0.50 percent. Rates for whites consistently fell between 1 and 1.3 percent. Slightly higher risk indices were recorded for American Indian/Alaskan Native children; however, the index never exceeded 2 percent for this group. For Hispanic students the identification rate has fallen, and since the 1992 survey it has been below 1 percent. In 1997 it was half the rate of 1974.
The trends in odds ratios in the bottom half of Table 2-2 provide another description of the same story. The ratios for Asian/Pacific Islander have been steady and relatively low—well under half the rate for white students in all but one year. For American Indian/Alaskan Natives, one notes a considerable decline in the odds ratios. In 1974, American Indian/ Alaskan Native students were more than half again as likely to be classified
TABLE 2-2 Risk Indices and Odds Ratios for Mental Retardation by Race/Ethnicity: 1974-1998 OCR Data
as MR as were white students (OR = 1.63), but by 1998 there was a narrow difference in the identification rates (OR = 1.09). Odds ratios for Hispanic students have fluctuated somewhat from year to year, but over time the ratio has fallen considerably. From an identification rate for Hispanics that was a quarter higher than that for whites in 1974 (OR = 1.26), surveys from 1992 to the most current reveal an identification rate that is approximately a quarter lower for Hispanics than for whites.
For black students, there has been a consistent pattern of higher rates of identification than for whites. The magnitude of the difference has diminished over time, but it is still considerable (1998 OR = 2.24).
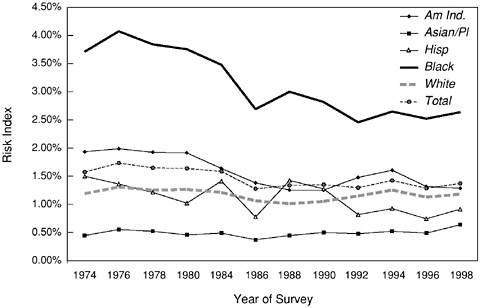
FIGURE 2-1 Risk indices for mental retardation: 1974-1998 OCR data.
Learning Disabilities
Recent Surveys
OCR survey data for 1998 reveal risk indices for all racial/ethnic groups that are dramatically higher for learning disabilities than those found for mental retardation. Asian/Pacific Islander have placement rates of 2.23 percent. Rates for all other racial/ethnic groups exceed 6 percent, and for American Indian/Alaskan Natives, the rate reached 7.45 percent (see Table 2-3). OSEP child count data for the same year track the OCR data very closely. Odds ratios, as expected, are low for Asian/Pacific Islander (0.37) and highest for American Indian/Alaskan Native (1.24). For Hispanics and blacks, they are close to 1.0.
Trends Over Time
The most significant pattern in the OCR national projections for the LD category is the dramatic (“epidemic”) increase in the risk of children of all racial/ethnic groups except Asian/Pacific Islander. Table 2-4 shows summary data for national projections for LD, which are graphically displayed in Figure 2-2. The range for the non-Asian ethnic groups in 1974 was 1.03 to 1.60 percent. In 1998 the risk indices for the same four groups ranged from 6.02 percent to 7.45 percent.
TABLE 2-3 Indices of Placement for Learning Disabilities by Race/ Ethnicity: 1998 OCR and OSEP Data
Consistently higher risk indices are found for American Indian/Alaskan Native students in every survey, and their rate of increase parallels that found for black, Hispanic, and white students. Markedly lower risk indices are found for Asian/Pacific Islander students, and what increase in risk is shown is at a much lower rate than that seen for the other four racial/ethnic groups.
Odds ratios for classification as LD in Table 2-4 reveal a consistent pattern of somewhat higher rates of identification for American Indian/ Alaskan Natives than for whites (OR between 1.15 and 1.58). For blacks and Hispanics, the ratio has fluctuated over time around 1.0. Since there is no significant overrepresentation of these two groups, the LD category has been of less concern in discussions of disproportionate representation. Yet the rate of increase in the risk indices indicates that all racial/ethnic groups have seen dramatic increases in the rate of identification as LD.
Emotional Disturbance
Recent Surveys
The 1998 OCR and OSEP data (see Table 2-5) reveal that children in all five racial/ethnic groups are less at risk for being identified as ED than for either MR or LD. Nevertheless, there is considerable variability in risk across racial/ethnic groups. Black students (OCR RI = 1.45 percent; OSEP RI = 1.56 percent) are at higher risk for ED identification than any other group. American Indian/Alaskan Natives and whites have rates close to 1
TABLE 2-4 Risk Indices and Odds Ratios for Learning Disabilities by Race/Ethnicity: 1974-1998 OCR Data
|
|
American Indian/ Alaskan Native |
Asian/ Pacific Islander |
Hispanic |
Black |
White |
Total |
|
Risk Index |
||||||
|
1974 |
1.60 |
0.52 |
1.29 |
1.03 |
1.24 |
1.21 |
|
1976 |
3.18 |
0.98 |
2.32 |
1.86 |
2.05 |
2.04 |
|
1978 |
3.46 |
1.26 |
2.57 |
2.21 |
2.30 |
2.30 |
|
1980 |
4.05 |
1.43 |
3.22 |
3.14 |
3.20 |
5.93 |
|
1984 |
5.18 |
1.61 |
4.46 |
4.51 |
4.19 |
4.21 |
|
1986 |
5.68 |
1.56 |
4.31 |
4.43 |
4.29 |
4.25 |
|
1988 |
5.74 |
1.53 |
4.46 |
4.50 |
4.54 |
4.44 |
|
1990 |
6.04 |
1.60 |
4.68 |
4.95 |
4.97 |
4.83 |
|
1992 |
6.78 |
1.70 |
5.27 |
5.79 |
4.29 |
5.28 |
|
1994 |
7.28 |
2.01 |
5.68 |
5.67 |
5.66 |
5.55 |
|
1997 |
6.41 |
1.90 |
5.99 |
6.15 |
5.53 |
5.56 |
|
1998 |
7.45 |
2.23 |
6.44 |
6.49 |
6.02 |
6.02 |
|
Odds Ratio |
||||||
|
1974 |
1.29 |
0.42 |
1.04 |
0.84 |
|
|
|
1976 |
1.55 |
0.48 |
1.13 |
0.90 |
|
|
|
1978 |
1.51 |
0.55 |
1.12 |
0.96 |
|
|
|
1980 |
1.27 |
0.45 |
1.01 |
0.98 |
|
|
|
1984 |
1.24 |
0.39 |
1.07 |
1.08 |
|
|
|
1986 |
1.32 |
0.36 |
1.00 |
1.03 |
|
|
|
1988 |
1.27 |
0.34 |
0.98 |
0.99 |
|
|
|
1990 |
1.22 |
0.32 |
0.94 |
1.00 |
|
|
|
1992 |
1.58 |
0.40 |
1.23 |
1.35 |
|
|
|
1994 |
1.29 |
0.36 |
1.00 |
1.00 |
|
|
|
1997 |
1.16 |
0.34 |
1.08 |
1.11 |
|
|
|
1998 |
1.24 |
0.37 |
1.07 |
1.08 |
|
|
|
NOTE: OCR placement and membership data are taken from the Fall 1998 Elementary and Secondary School Civil Rights Compliance Report, National Projections. |
||||||
percent. Hispanic children have considerably lower risk of ED placement (OCR RI: 0.55; OSEP RI: 0.68), and Asian/PacificIslander students have dramatically lower rates (OCR RI = 0.26; OSEP RI = 0.27) for this classification.
Odds ratios confirm the higher risk for black students (OCR and OSEP OR = 1.59), indicating they are half again as likely as white students to be classified as ED. As would be expected from the above data on risk, Asian/ Pacific Islander are far less likely than whites (OCR OR = 0.29; OSEP OR = 0.27) to be classified as ED, and to a slightly lesser degree this is true for Hispanics (OCR OR = 0.60; OSEP OR = 0.69). The pattern for ED is similar to that for MR, though the magnitude of differences by race/ethnicity is not as great.

FIGURE 2-2 Risk indices for learning disabilities: 1974-1997 OCR data.
TABLE 2-5 Indices of Placement for Emotional Disturbance by Race/ Ethnicity: 1998 OCR and OSEP Data
Trends Over Time
For all five groups, the risk of being classified as ED has gradually increased over the years covered by the OCR survey (see Table 2-6 and Figure 2-3). At almost every data point, the rank order of risk is (from highest to lowest): black, American Indian/Alaskan Native, white, Hispanic, and Asian/Pacific Islander. The rate at which risk has increased appears somewhat parallel for black and American Indian/Alaskan Native students, and the rates of increase for these two groups is more rapid than is seen for white students. The rate at which risk has increased for Hispanic students is relatively slow and that for Asian/Pacific Islander is extremely slow.
Odds ratios tell the story of steady increases for all ethnic groups over the 22-year period. For blacks, American Indian/Alaskan Natives, and Asian/Pacific Islander, the odds ratio in 1998 was very similar to that in 1976. For Hispanics, the ratio declined from 0.97 to 0.60, reflecting a risk index that doubled, while that for other groups increased by three or more times.
GIFTED AND TALENTED DATA MONITORED BY OCR
Recent Surveys
Data on gifted and talented students come only from OCR surveys. The 1998 survey indicates that 6.2 percent of all children were placed in these programs (see Table 2-7), but placement rates for different racial/ethnic groups differ dramatically. The placement rate (risk index) for Asian/Pacific Islander students is 9.98 percent: 1 in 10 students in that group are in gifted programs. Relatively low risk indices are found for black (OCR RI = 3.04) and Hispanic (OCR RI = 3.57) students, with American Indian/Alaskan Native students (OCR RI = 4.86) also falling below the mean risk index for the total population. The risk index for whites (OCR RI = 7.47) is above the mean but not nearly as high as that found for Asian/Pacific Islander students. The odds ratios tell the same story with other numbers: Asian/ Pacific Islander are one-third more likely than white students to be in gifted programs, while black and Hispanic students are less than half as likely. American Indian/Alaskan Natives (OCR OR = 0.65) fall between blacks and whites.
Trends Over Time
According to OCR data, in 1976 less than 1 percent of all schoolchildren were identified for gifted and talented programs, while in 1998 that
TABLE 2-6 Risk Indices and Odds Ratios for Emotional Disturbance by Race/Ethnicity: 1976-1998 OCR Data
number was 6.20 percent (see Table 2-8). These data are displayed graphically in Figure 2-4. While “risk” may not be the appropriate term to use for being classified as gifted and talented, the pattern of data is almost the mirror image of what was found for mental retardation in the OCR surveys.
Since 1976, there has been a steady increase in the rate at which children in each racial/ethnic group have been identified as gifted and talented (see Table 2-8). For all groups, the rate of change has been considerable; it has been greatest for American Indians and slowest for Asians. However, large differences in the initial placement rates leaves a distribution that is still very heavily weighted toward Asians and whites.
Reflecting these changes, the odds ratios for Asian/Pacific Islander students have dropped considerably: from 2.15 to 1.34. The ratio for Ameri-
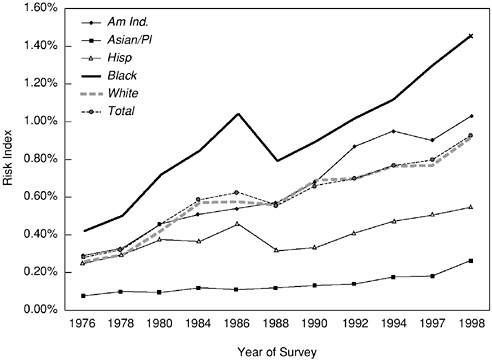
FIGURE 2-3 Risk indices for emotional disturbance: 1976-1998 OCR data.
TABLE 2-7 Indices of Placement in Gifted and Talented Programs by Race/Ethnicity: 1998 OCR Data
TABLE 2-8 Risk Indices and Odds Ratios for Gifted and Talented Students by Race/Ethnicity: 1976-1988 OCR Data
|
|
American Indian/Alaskan Native |
Asian/Pacific Islander |
Hispanic |
Black |
White |
Total |
|
Risk Index |
||||||
|
1976 |
0.42 |
2.26 |
0.40 |
0.47 |
1.05 |
0.93 |
|
1978 |
0.76 |
4.60 |
1.47 |
1.27 |
2.08 |
1.94 |
|
1980 |
1.11 |
5.25 |
1.52 |
1.46 |
2.88 |
2.57 |
|
1984 |
1.97 |
8.28 |
2.12 |
2.16 |
4.75 |
4.15 |
|
1986 |
2.15 |
9.10 |
2.41 |
2.44 |
5.35 |
4.67 |
|
1988 |
2.45 |
9.63 |
2.50 |
2.57 |
5.65 |
4.96 |
|
1990 |
2.82 |
9.44 |
2.86 |
2.87 |
6.44 |
5.52 |
|
1992 |
3.13 |
9.99 |
2.98 |
2.96 |
6.15 |
5.35 |
|
1994 |
4.61 |
9.53 |
2.95 |
2.97 |
7.19 |
6.00 |
|
1997 |
4.43 |
9.41 |
3.38 |
2.43 |
6.79 |
5.64 |
|
1998 |
4.86 |
9.98 |
3.57 |
3.04 |
7.47 |
6.20 |
|
Odds Ratio |
||||||
|
1976 |
0.40 |
2.15 |
0.38 |
0.45 |
|
|
|
1978 |
0.36 |
2.21 |
0.71 |
0.61 |
|
|
|
1980 |
0.39 |
1.82 |
0.53 |
0.51 |
|
|
|
1984 |
0.42 |
1.75 |
0.45 |
0.46 |
|
|
|
1986 |
0.40 |
1.70 |
0.45 |
0.46 |
|
|
|
1988 |
0.43 |
1.70 |
0.44 |
0.45 |
|
|
|
1990 |
0.44 |
1.46 |
0.44 |
0.45 |
|
|
|
1992 |
0.51 |
1.63 |
0.48 |
0.48 |
|
|
|
1994 |
0.64 |
1.32 |
0.41 |
0.41 |
|
|
|
1997 |
0.65 |
1.39 |
0.50 |
0.36 |
|
|
|
1998 |
0.65 |
1.34 |
0.48 |
0.41 |
|
|
|
Note: OCR placement and membership data are taken from the Fall 1998 Elementary and Secondary School Civil Rights Compliance Report, National Projections. |
||||||
can Indian/Alaskan Natives rose from 0.40 to 0.65, but that for Hispanics and blacks showed no sustained rise.
NONJUDGMENTAL DISABILITY CATEGORIES
Our focus in this report is on the three high-incidence disability categories discussed above. We briefly examine the data for the other 10 categories, however, to provide a fuller picture of relative placement by race/ ethnicity. Only OSEP collects data on all 13 disability categories, and these have been broken down by race/ethnicity only as of 1998. One of the reasons these categories are not monitored by OCR is that for most of the disabilities represented, few would question the professional judgment or
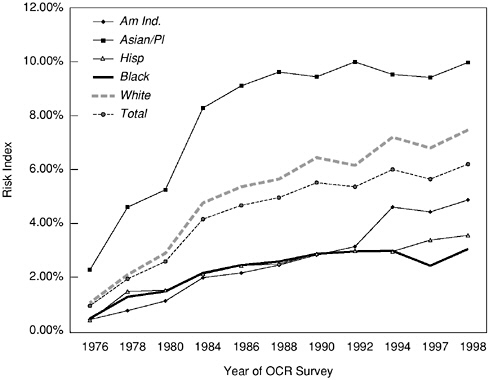
FIGURE 2-4 Risk indices for gifted and talented: 1976-1998 OCR data.
accuracy of a diagnosis in these cases. Moreover, the representation of racial/ethnic groups in these categories has not been at issue in the courts.
Table 2-9 contains 1998 summary data for all of the disability categories recognized under IDEA.1 Since MR, ED, and LD were discussed previously, we focus on the other 10 categories here.
Speech and Language Impairments: Students served in the category of speech and language impairments constitute 2.33 percent of the nation’s schoolchildren. Risk indices by racial/ethnic group reveal that Asian/Pacific Islander children are served at a much lower rate (RI = 1.42 percent), and Hispanic students at a somewhat lower rate (RI = 1.92 percent). American
Indian/Alaskan Native, black, and white students are served at rates approximating the national average, with risk indices for these groups of, respectively, 2.41, 2.28, and 2.54 percent. Given that the risk index for white students is the highest, it comes as no surprise that the odds ratios for the other four racial/ethnic groups, when compared with that of whites, are less than 1.0.
The remaining disability categories recognized under IDEA are sometimes referred to as low-incidence disabilities, when compared with the ones considered above. The risk index for the total population under each of these disabilities ranges from a low of 0.003 percent (deaf-blindness) to a high of 0.46 percent (other health impairment).
Hearing Impairment: Risk indices for all racial/ethnic groups for hearing impairment are under 0.2 percent, with a national average of 0.15 percent. Odds ratios suggest slightly higher risk for American Indian/Alaskan Natives (OR = 1.23), Asian/Pacific Islander (OR = 1.21), and Hispanics (OR = 1.22) than is found for whites; however, only 0.18 percent of both American Indian/Alaskan Native and Asian/PacificIslander students are served in programs for the hearing impaired. The odds ratio for black students (OR = 1.03) suggests approximately the same rate as is found for white students.
Visual Impairment: All groups except American Indian/Alaskan Natives participate substantially less in programs for children with visual impairments than do white students. While this disability category has a very low prevalence (less than 0.07 percent for any racial/ethnic group), one might be tempted to speculate that issues of screening and the availability of routine medical care may be implicated here. The odds ratio for American Indian/Alaskan Natives is 1.27, suggesting higher identification rates for this group. For all other racial/ethnic groups, the odds ratios shown in Table 2-9 suggest comparable rates of identification.
Orthopedic Impairment: The national risk index for orthopedic impairment is 0.15 percent, with risk indices for all racial/ethnic groups ranging between 0.11 percent (American Indian/Alaskan Natives and Asian/ Pacific Islander) and 0.16 percent (whites). Odds ratios reveal that in comparison to white students, all other racial/ethnic groups are just slightly less at risk for being served as orthopedically impaired. Odds ratios also reflect the slightly lower prevalence rates for all groups when compared with the rate for white students. Again, we raise the possibility of failure to detect as a factor in these figures.
TABLE 2-9 1998 OSEP Data by Disability and Ethnic Group: Composition Index, Risk Index, and Odds Ratio
|
Ethnicity |
Total Number |
N In Disability |
Comp. Index |
Risk Index |
Odds Ratio |
|
All Disabilities |
|||||
|
American Indian/Alaskan Native |
526,719 |
68,966 |
1.24 |
13.10% |
1.08 |
|
Asian/Pacific Islander |
1,794,189 |
95,343 |
1.72 |
5.31% |
0.44 |
|
Black |
7,785,863 |
1,111,650 |
20.03 |
14.28% |
1.18 |
|
Hispanic |
6,819,434 |
773,013 |
13.93 |
11.34% |
0.94 |
|
White |
28,937,632 |
3,500,911 |
63.08 |
12.10% |
|
|
Total |
45,863,813 |
5,549,913 |
|
12.10% |
|
|
Mental Retardation |
|||||
|
American Indian/Alaskan Native |
526,719 |
6,295 |
1.03 |
1.20% |
1.07 |
|
Asian/Pacific Islander |
1,794,189 |
10,228 |
1.67 |
0.57% |
0.51 |
|
Black |
7,785,863 |
204,739 |
33.51 |
2.63% |
2.35 |
|
Hispanic |
6,819,434 |
66,543 |
10.89 |
0.98% |
0.87 |
|
White |
28,937,632 |
323,173 |
52.89 |
1.12% |
|
|
Total |
45,863,813 |
610,978 |
|
1.33% |
|
|
Learning Disabilities |
|||||
|
American Indian/Alaskan Native |
526,719 |
38,455 |
1.37 |
7.30% |
1.2 |
|
Asian/Pacific Islander |
1,794,189 |
40,345 |
1.43 |
2.25% |
0.37 |
|
Black |
7,785,863 |
512,083 |
18.19 |
6.58% |
1.08 |
|
Hispanic |
6,819,434 |
464,458 |
16.5 |
6.81% |
1.12 |
|
White |
28,937,632 |
1,759,501 |
62.51 |
6.08% |
|
|
Total |
45,863,813 |
2,814,842 |
|
6.14% |
|
|
Emotional Disturbance |
|||||
|
American Indian/Alaskan Native |
526,719 |
5,261 |
1.14 |
1.00% |
1.02 |
|
Asian/Pacific Islander |
1,794,189 |
4,796 |
1.04 |
0.27% |
0.27 |
|
Black |
7,785,863 |
121,800 |
26.36 |
1.56% |
1.59 |
|
Hispanic |
6,819,434 |
46,118 |
9.98 |
0.68% |
0.69 |
|
White |
28,937,632 |
284,062 |
61.48 |
0.98% |
|
|
Total |
45,863,813 |
462,037 |
|
1.01% |
|
|
Speech and Language Impairment |
|||||
|
American Indian/Alaskan Native |
526,719 |
12,698 |
1.18 |
2.41% |
0.95 |
|
Asian/Pacific Islander |
1,794,189 |
25,408 |
2.35 |
1.42% |
0.56 |
|
Black |
7,785,863 |
177,484 |
16.43 |
2.28% |
0.9 |
|
Hispanic |
6,819,434 |
130,606 |
12.09 |
1.92% |
0.75 |
|
White |
28,937,632 |
734,339 |
67.96 |
2.54% |
|
|
Total |
45,863,813 |
1,080,535 |
|
2.36% |
|
|
Multiple Disabilities |
|||||
|
American Indian/Alaskan Native |
526,719 |
1,474 |
1.36 |
0.28% |
1.14 |
|
Ethnicity |
Total Number |
N In Disability |
Comp. Index |
Risk Index |
Odds Ratio |
|
Asian/Pacific Islander |
1,794,189 |
2,437 |
2.24 |
0.14% |
0.55 |
|
Black |
7,785,863 |
20,782 |
19.1 |
0.27% |
1.09 |
|
Hispanic |
6,819,434 |
13,000 |
11.95 |
0.19% |
0.78 |
|
White |
28,937,632 |
71,086 |
65.35 |
0.25% |
|
|
Total |
45,863,813 |
108,779 |
|
0.24% |
|
|
Hearing Impairment |
|||||
|
American Indian/Alaskan Native |
526,719 |
952 |
1.35 |
0.18% |
1.23 |
|
Asian/Pacific Islander |
1,794,189 |
3,182 |
4.5 |
0.18% |
1.21 |
|
Black |
7,785,863 |
11,759 |
16.63 |
0.15% |
1.03 |
|
Hispanic |
6,819,434 |
12,243 |
17.32 |
0.18% |
1.22 |
|
White |
28,937,632 |
42,553 |
60.2 |
0.15% |
|
|
Total |
45,863,813 |
70,689 |
|
0.15% |
|
|
Orthopedic Impairment |
|||||
|
American Indian/Alaskan Native |
526,719 |
563 |
0.81 |
0.11% |
0.66 |
|
Asian/Pacific Islander |
1,794,189 |
2,044 |
2.93 |
0.11% |
0.71 |
|
Black |
7,785,863 |
10,095 |
14.48 |
0.13% |
0.81 |
|
Hispanic |
6,819,434 |
10,471 |
15.02 |
0.15% |
0.95 |
|
White |
28,937,632 |
46,532 |
66.76 |
0.16% |
|
|
Total |
45,863,813 |
69,705 |
|
0.15% |
|
|
Other Health Impairment |
|||||
|
American Indian/Alaskan Native |
526,719 |
2,233 |
1.01 |
0.42% |
0.73 |
|
Asian/Pacific Islander |
1,794,189 |
2,942 |
1.33 |
0.16% |
0.28 |
|
Black |
7,785,863 |
31,097 |
14.02 |
0.40% |
0.69 |
|
Hispanic |
6,819,434 |
18,268 |
8.24 |
0.27% |
0.46 |
|
White |
28,937,632 |
167,268 |
75.41 |
0.58% |
|
|
Total |
45,863,813 |
221,808 |
|
0.48% |
|
|
Visual Impairment |
|||||
|
American Indian/Alaskan Native |
526,719 |
385 |
1.27 |
0.07% |
1.02 |
|
Asian/Pacific Islander |
1,794,189 |
907 |
2.99 |
0.05% |
0.71 |
|
Black |
7,785,863 |
4,413 |
14.55 |
0.06% |
0.79 |
|
Hispanic |
6,819,434 |
3,887 |
12.81 |
0.06% |
0.8 |
|
White |
28,937,632 |
20,741 |
68.38 |
0.07% |
|
|
Total |
45,863,813 |
30,333 |
|
0.07% |
|
|
Autism |
|||||
|
American Indian/Alaskan Native |
526,719 |
363 |
0.67 |
0.07% |
0.58 |
|
Asian/Pacific Islander |
1,794,189 |
2,492 |
4.63 |
0.14% |
1.17 |
|
Black |
7,785,863 |
11,165 |
20.75 |
0.14% |
1.21 |
|
Hispanic |
6,819,434 |
5,405 |
10.04 |
0.08% |
0.67 |
|
White |
28,937,632 |
34,386 |
63.9 |
0.12% |
|
|
Total |
45,863,813 |
53,811 |
99.99 |
0.12% |
|
Other Health Impairment: The risk index across racial/ethnic groups for other health impairment is 0.48 percent. Risk indices range from 0.16 percent for Asian/Pacific Islander students to 0.58 percent for white students, who constitute over 75 percent of all children identified as having some other health impairment. Odds ratios reveal that in comparison to white students, all other racial/ethnic groups are less at risk for being served, with risk being far lower for Asian/Pacific Islander (OR = 0.28) and Hispanics (OR = 0.46). Interpretation of these figures may be compromised by the use of this category to serve some children diagnosed with attention deficit/hyperactivity disorder but not qualifying under the LD category.
Multiple Disabilities: The risk index across racial/ethnic groups for multiple disabilities is 0.23 percent, with lower risk for Hispanics (RI = 0.19 percent) and Asian/Pacific Islander (RI = 0.14 percent). Risks for all other groups are extremely similar (whites RI = 0.25 percent; blacks RI = 0.27 percent; American Indian/Alaskan Natives RI = 0.28 percent). Examination of the odds ratios contrasting the four racial/ethnic groups with white students suggests that American Indian/Alaskan Native and black students have about the same probability of being served in special education on the basis of qualifying as having multiple disabilities, with Hispanic students being slightly less likely (OR = 0.7). Asian/Pacific Islander students are approximately half as likely to be so served (OR = 0.55).
Deaf-Blindness: In this extremely low-incidence condition, fluctuations of only a few cases can result in higher risk. Only American Indian/Alaskan Native and Asian/Pacific Islander children have risk indices that reach 0.01 percent. The odds ratios for the two racial/ethnic groups suggest higher rates than that found for whites. Most pronounced is the odds ratio for Asian/Pacific Islander (2.88), yet, as noted previously, the risk index for this group is 0.01 percent. The odds ratio for American Indian/Alaskan Natives suggests approximately half again the proportion of cases (OR = 1.52) found among white students. The odds ratio for black students (OR = .68) reveals a lower rate of deaf-blindness than among white students, while the rate for Hispanic students (OR = .93) is comparable to that for white students. The very small numbers (smallest of any disability category) urge caution in interpreting these figures.
Autism: The national risk for autism across racial/ethnic groups is 0.12 percent. Risk indices range from a low of 0.07 percent (American Indian/ Alaskan Natives) to 0.14 percent for Asian/Pacific Islander and black students. Odds ratios reveal slightly higher rates of autism for black (OR = 1.21) and Asian/Pacific Islander (OR = 1.17) students when compared with the rates for whites, while rates for American Indian/Alaskan Native and Hispanic students are considerably lower than is found among white students.
Traumatic Brain Injury: The national risk index across racial and ethnic groups for traumatic brain injury is 0.03 percent. Variability in risk across racial/ethnic groups is quite small, ranging from 0.02 percent (Asian/ Pacific Islander) to 0.04 percent (American Indian/Alaskan Natives). Odds ratios indicate slightly higher rates of identification for American Indian/ Alaskan Natives (OR = 1.23) than is found for white students, with rates for the other three groups being lower than that found among white students.
Developmental Delay: Caution is in order interpreting figures for children in this category. Not all states employ this category, and it cannot be used throughout the school years. The category includes primary grade students who are judged to need special education because their development is below expectations; these children must be placed into more specific categories to be served in special education in upper elementary grades. Very few American Indian/Alaskan Native or Asian/Pacific Islander children are served in this category nationwide (total numbers of 57 and 94 children, respectively). Highest risk indices are found for blacks (RI = 0.05 percent) and whites (RI = 0.03 percent). Odds ratios reveal rates substantially lower than that for white students for all racial/ethnic groups except for black students, who are over twice as likely as white students to be identified (OR = 2.06). Given the uneven use of this category across states, interpretation is difficult.
SUMMARY OF NATIONAL DATA ON RACIAL AND ETHNIC REPRESENTATION
When OSEP participation data are aggregated across all 13 disability categories, one gets an overall impression of the relative participation of the five racial/ethnic groups in special education. In 1998 approximately 14 percent of all black students, 13 percent of American Indian/Alaskan Native students, 12 percent of white students, 11 percent of Hispanic students, and 5 percent of Asian/Pacific Islander students were served in special education in comparison to an overall (across the five racial/ethnic groups) rate of 12 percent.
When rates for minority children are considered in comparison to white students (i.e., odds ratios), one finds a higher risk for black students (OR = 1.18). But the biggest discrepancy is Asian/Pacific Islander students, whose risk index is less than half that of whites (OR = 0.44). Hispanic students have a slightly lower risk index than whites across all disabilities (OR = 0.94).
The OSEP data provide no evidence that minority children are systematically represented in low-incidence disability categories in numbers that are disproportionate to their representation in the population. While there is some variation in each category, no single race/ethnic group can be singled out as having higher or lower incidence across all categories.
There is evidence that disproportionate participation of black students continues in the categories of mental retardation and emotional disturbance. The magnitude of the disproportion in cases identified as mental retardation has been reduced over time, but the higher identification rate for black students persists. Given that many states reserve the term “men-
tally retarded” exclusively for students exhibiting patent disability (MacMillan et al., 1996d), interpretation of these numbers, as well as the ED numbers, requires more far-reaching analysis (see Chapters 3 and 5).
The LD category is both the largest and the fastest growing. Black, white, and Hispanic students are placed in that category at roughly the same rate. Asian/Pacific Islander students are represented at a much lower rate, and American Indian/Alaskan Native children at a somewhat higher risk of placement.
Because aggregating data nationally obscures much state-to-state variability, we turn in the sections that follow to disaggregated state data.
DATA ON STATE-TO-STATE VARIABILITY
States vary widely in both the total percentage of students and the percentage by race/ethnicity assigned to special education categories and gifted and talented programs. OCR data from the 1998 survey on all states for the high-incidence disabilities and gifted and talented programs are displayed in graphic form in Figures 2-5 to 2-8.
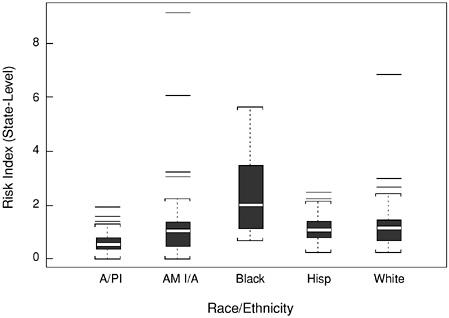
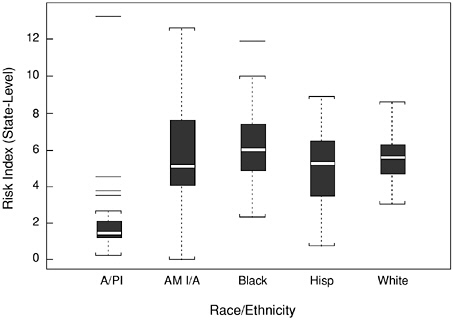
The interpretation of the box plots in the figures is as follows: the white line in the center denotes the median, and the shaded box is bounded by the first and third quartiles of the data distribution. Hence, the middle 50 percent of the data lies within the box. The “whiskers” of the plot are based on the interquartile range; points lying beyond the whiskers (denoted by the horizontal lines) are outlier points that are highly unusual given the distribution of the rest of the data. Side-by-side plots give a clear picture of central location across groups (comparing the median lines and location/ overlap of the boxes) but also the variability and skewness of the distributions (the vertical extent of the boxes and whiskers). Data for the 50 states and the District of Columbia for each of the five racial/ethnic groups are displayed by each disability group in these figures.
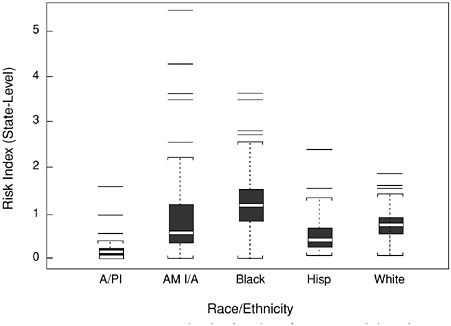
Figure 2-5 illustrates the higher median risk score for black students classified as MR and the relatively low rate for Asian/Pacific Islander students. The new information displayed here is the greater variability in the risk for black students across the states. In Figure 2-6, reflecting the distribution of LD risk indices, the median value for all groups except Asian/ Pacific Islander is roughly comparable: Asian/Pacific Islander students are at far lower risk for classification as LD than are students in the other four racial/ethnic groups. Considerable variability across states is seen for the American Indian/Alaskan Native population of students, with less variability observed for white students.
Figure 2-7 displays the risk indices for the ED category. Asian/Pacific Islander students show extremely low risk for this category, while the me-
dian risk for black students is higher than is found for any other racial/ ethnic group. The variability seen for Hispanic and white students across states is comparable, while that found for American Indian/Alaskan Native and black students is considerably greater. Several extreme values indicate high risk for American Indian/Alaskan Native and black students in certain states.
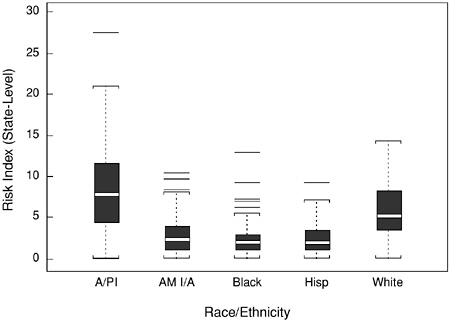
The findings for “risk” as gifted and talented appear in Figure 2-8 and record as expected the highest median risk for Asian/Pacific Islander students, for whom is also evident the greatest variability across states in classification for these services. Noticeably low-risk indices are evident for American Indian/Alaskan Native, black, and Hispanic students, and the variability in risk across states is considerably less for these groups than is found for Asian/Pacific Islander or white students.
To get a better grasp of the variability across states, the summary data from the OCR 1998 survey is highlighted for the subset of states that have the highest placement rates for blacks and Hispanics in the disabilities of concern, and the lowest placement rates for blacks and Hispanics in gifted and talented programs. We do not look at American Indian/Alaskan Natives by state because the small numbers in the population can cause the indices to be very unstable from year to year. We do look at the states in which the composition is highest for blacks and Hispanics. This provides insight into the placement rates in states that have large black and Hispanic populations. For each of the states we include the risk index for white students as well. By comparing the relative risk index for black and white students for a given state, one can get some insight into whether the state simply identifies high percentages of children (risk index for black and white being comparable) or whether one sees marked differences in a given state for children in different racial/ethnic groups.
Mental Retardation
We found nine states in which over 4 percent of black students were served in the mental retardation category (Alabama, Arkansas, Indiana, Iowa, Massachusetts, Nebraska, North Carolina, South Carolina, and West Virginia) while five states provided less than 1 percent of their black students with MR services (Alaska, Maine, New Hampshire, New Jersey, and New York). Table 2-10 shows the data on states with the highest risk index for black students in the top portion and the states with the highest composition index for black students in the lower portion.
Interestingly, these data do not tell a coherent story. In some states in which the black risk index is high, black students make up a large portion of the student body. This is true of Alabama and Arkansas. In Massachusetts and Indiana, the composition index is in the average range, and Iowa
TABLE 2-10 1998 Comparison of States with Highest Risk (RI) and Composition (CI) Indices for Black Students in the Category of Mental Retardation
|
State |
RI |
CI |
White RI for State |
|
Highest RI |
|||
|
Massachusetts |
6.28% |
29.07% |
1.32% |
|
Alabama |
5.49% |
62.93% |
1.80% |
|
Arkansas |
5.29% |
43.87% |
2.06% |
|
Iowa |
5.27% |
6.14% |
3.21% |
|
Indiana |
5.01% |
23.67% |
1.85% |
|
Highest CI |
|||
|
District of Columbia |
1.74% |
95.07% |
.19% |
|
Mississippi |
2.27% |
78.14% |
.66% |
|
South Carolina |
4.35% |
69.61% |
1.41% |
|
Louisiana |
2.79% |
69.58% |
1.13% |
has a low composition index because it has relatively few black children in the student body.
Turning to the composition index, the lack of pattern is reinforced. By virtue of its demographics, the District of Columbia has the largest percentage of black students in its school population. Black students make up over 95 percent of all MR placements. However, only 1.7 percent of black students are in that category—far below the national average for blacks. The risk index for whites in the District, however, is only 0.19 percent. While the District places relatively few children of any race in the MR category, the disproportion is very pronounced. The odds of a black student being placed in MR are over nine times those of white students. Looking at the four states with a high composition index for black students, the risk indices run from among the highest (South Carolina) to among the lowest (District of Columbia).
For Hispanic students, the highest risk indices are considerably below those for black students. Three of the states with higher risk indices for Hispanic students have relatively small Hispanic populations, and those with large Hispanic populations (high CI) have risk indices that are near the average. The national averages indicate that fewer Hispanic students than white students are labeled MR. But in all states in Table 2-11, one finds slightly higher risk for Hispanic students than for whites.
While these data give a flavor of the complexity involved in placement patterns, a single year’s data for any state should be considered cautiously. While Alabama and Arkansas have consistently high placement rates for black students in MR, Massachusetts would not have ranked among the
TABLE 2-11 1998 Comparison of States with Highest Risk (RI) and Composition (CI) Indices for Hispanic Students in the Category of Mental Retardation
|
State |
RI |
CI |
White RI for State |
|
Highest RI |
|||
|
Massachusetts |
4.48% |
22.54% |
1.32% |
|
Nebraska |
2.68% |
7.31% |
1.99% |
|
Hawaii |
2.41% |
3.70% |
.96% |
|
Indiana |
2.23% |
3.18% |
1.85% |
|
Highest CI |
|||
|
New Mexico |
1.06% |
53.37% |
0.84% |
|
California |
.78% |
44.06% |
0.66% |
|
Arizona |
1.04% |
37.31% |
0.72% |
|
Texas |
0.71% |
35.42% |
0.60% |
top states in 1997. Yet in 1998 it had the highest placement rate in MR for both blacks and Hispanics. This may be explained by changes in reporting methodology.
Learning Disabilities
There is considerable variability in the rate at which states use the LD designation. For example, in 1998 Rhode Island identified 9.75 percent of its students as LD and Delaware 8.65 percent. Only 3.10 percent of the students in Georgia were classified as LD, and 3.36 percent in Kentucky. The nationally aggregated data have been interpreted to suggest no overrepresentation of either black or Hispanic students in LD. But state-level data tell a more complex story. For black students, for example, the risk index ranges from 2.33 percent in Georgia to 12.19 percent in Delaware. For Hispanic students, the risk index ranges from 2.43 in Georgia to 8.93 in Delaware. Clearly there is overrepresentation for these two minorities in the LD category in some states.
Tables 2-12 and 2-13 show states with the highest risk and composition indices for blacks and Hispanics, respectively. The RI for black students identified as LD in the top portion of the table are consistently and substantially higher than the RI for white students in three of the four states; the rate is high for both blacks and whites in Rhode Island. No discernible pattern emerges from these states, however. In Delaware, the high RI is associated with a high CI, while in the other states it is not. For states in which black students constitute the highest percentages of enroll-
TABLE 2-12 1998 Comparison of States with Highest Risk (RI) and Composition (CI) Indices for Black Students in the Category of Learning Disability
|
State |
RI |
CI |
White RI for State |
|
Highest RI |
|||
|
Delaware |
12.19% |
43.26% |
7.15% |
|
Rhode Island |
10.38% |
7.75% |
10.30% |
|
New Mexico |
9.99% |
3.34% |
6.83% |
|
Montana |
9.90% |
.76% |
5.80% |
|
Highest CI |
|||
|
District of Columbia |
6.68% |
91.94% |
3.68% |
|
Mississippi |
6.39% |
57.53% |
4.87% |
|
Louisiana |
6.65% |
55.57% |
4.26% |
|
South Carolina |
5.82% |
42.55% |
5.86% |
TABLE 2-13 1998 Comparison of States with Highest Risk (RI) and Composition (CI) Indices for Hispanic Students in the Category of Learning Disability
|
State |
RI |
CI |
White RI for State |
|
Highest RI |
|||
|
Delaware |
8.93% |
3.60% |
7.15% |
|
New York |
8.42% |
21.72% |
7.03% |
|
New Mexico |
8.21% |
51.40% |
6.83% |
|
Highest CI |
|||
|
New Mexico |
8.21% |
51.40% |
6.83% |
|
California |
5.81% |
41.65% |
6.00% |
|
Texas |
7.05% |
38.46% |
6.59% |
|
Arizona |
5.90% |
33.25% |
5.44% |
ment in LD (CI), we find RIs that are substantially higher for black students than white students in three states (District of Columbia, Louisiana, and Mississippi), and almost identical rates in South Carolina.
For Hispanic students, the states with the highest risk indices again show no pattern. They range from Delaware with 3.60 percent of LD students who are Hispanic, to New Mexico with 51.4 percent. In all three states, the risk index is higher for Hispanic students than for white students, but all three states identify white students at a rate higher than the national average.
Of the four states in which Hispanic students make up the largest share of the LD students, two (Arizona and California) identify those students at rates below the national average, and two (New Mexico and Texas) above. In the latter two states, white students are also identified at higher rates than they are nationally.
Emotional Disturbance
OCR national projections showed elevated identification rates for black students in the category of emotional disturbance. Again, we note the variability in the rates of ED identification across states. Minnesota, Ohio, Oklahoma, and Oregon identified more than 2 percent of their students as ED, while nine states identified under one half of one percent: Arkansas, California, Delaware, Idaho, Mississippi, Nevada, South Dakota, Tennessee, and Washington.
Among the states with the highest risk indices for black students are Iowa, Minnesota, Montana, and Vermont, all states in which black students claim a relatively small share of the total ED placements (see Table 2-14). The RI for black students in those states is markedly higher than for white students. In states in which black students make up the largest share of ED placements (District of Columbia, Louisiana, North Carolina, and South Carolina), the risk index is also substantially higher than that for whites, but it is less than half the rate in the states with the highest risk indices.
TABLE 2-14 1998 Comparison of States with Highest Risk (RI) and Composition (CI) Indices for Black Students in the Category of Emotional Disturbance
|
State |
RI |
CI |
White RI for State |
|
Highest RI |
|||
|
Minnesota |
3.88% |
11.09% |
1.88% |
|
Montana |
3.58% |
2.05% |
0.85% |
|
Iowa |
3.53% |
11.81% |
1.05% |
|
Vermont |
3.11% |
1.42% |
1.80% |
|
Highest CI |
|||
|
District of Columbia |
1.25% |
96.02% |
0.41% |
|
Louisiana |
.97% |
65.26% |
0.48% |
|
South Carolina |
1.29% |
57.04% |
0.72% |
|
North Carolina |
1.38% |
53.62% |
0.58% |
TABLE 2-15 1998 Comparison of States with Highest Risk (RI) and Composition (CI) Indices for Hispanic Students in the Category of Emotional Disturbance
|
State |
RI |
CI |
White RI for State |
|
Highest RI |
|||
|
Hawaii |
2.68% |
4.09% |
2.39% |
|
Vermont |
2.16% |
0.49% |
1.80% |
|
Maine |
1.99% |
0.54% |
1.73% |
|
Minnesota |
1.61% |
1.95% |
1.18% |
|
Highest CI |
|||
|
New Mexico |
0.92% |
43.68% |
1.20% |
|
Texas |
0.62% |
25.22% |
1.09% |
|
California |
0.13% |
19.81% |
0.39% |
|
Arizona |
0.29% |
15.36% |
0.78% |
States in which Hispanic students are most at risk for ED identification are Hawaii, Maine, Minnesota, and Vermont (Table 2-15). Hispanic students in these states constitute only a very small percentage of the total ED enrollment. While in all of these cases their placement rates are higher than those for whites, the discrepancies are relatively small. In states in which Hispanic students make up the largest percentage of the ED population (bottom of Table 2-15), placement rates for Hispanic students are uniformly below those for whites.
Gifted and Talented Category
For the gifted and talented category, the variations among states are even greater than are seen for the disability categories discussed above. At the upper end of the distribution, Oklahoma and Wisconsin serve over 13 percent of their students in these programs, while Massachusetts serves under 1 percent and the District of Columbia and Vermont just over 1 percent. Such variability is obscured when one cites a national projected average of 5.86 percent.
Since the concern in the area of gifted and talented students is underrepresentation of blacks and Hispanics, we have selected states with low placement rates indicated by low risk indices. Table 2-16 shows states low in placement rates for black students in the upper half of the table and states low in the percentage of gifted and talented who are black in the lower half. The low-RI states are all in New England. These states have placement rates for whites that are also far below the national average, although they are several times greater than the rate for black students. States in which the CI is lowest for black students are in the Midwest and
TABLE 2-16 1998 Comparison of States with Lowest Risk (RI) and Composition (CI) Indices for Black Students in the Category of Gifted and Talented
|
State |
RI |
CI |
White RI for State |
|
Lowest RI |
|||
|
Vermont |
0.36% |
0.29% |
1.06% |
|
New Hampshire |
0.39% |
0.36% |
1.34% |
|
Massachusetts |
0.39% |
9.79% |
0.83% |
|
Lowest CI |
|||
|
Montana |
2.27% |
0.22% |
5.10% |
|
Vermont |
0.36% |
0.29% |
1.06% |
|
New Hampshire |
0.39% |
0.36% |
1.34% |
|
Idaho |
1.99% |
0.39% |
2.97% |
|
Maine |
1.45% |
0.40% |
3.65% |
New England. In all of these states, the risk index is below the national average for both blacks and whites, but the differential between the two races is large.
Three of the four states with the lowest risk indices for Hispanic students in the gifted and talented category are in the Northeast. Table 2-17 shows the states along with RI data for white students. The magnitude of the differences in Hispanic-white RIs varies considerably, with white students about half again as likely to be served in Massachusetts, while the difference in New York is more than eight times. In states in which Hispanic students constitute a very small percentage of the overall enrollment
TABLE 2-17 1998 Comparison of States with Lowest Risk (RI) and Composition (CI) Indices for Hispanic Students in the Category of Gifted and Talented
|
State |
RI |
CI |
White RI for State |
|
Lowest RI |
|||
|
District of Columbia |
0.11% |
0.39% |
0.38% |
|
New Hampshire |
0.25% |
0.43% |
1.34% |
|
New York |
0.33% |
2.50% |
4.03% |
|
Massachusetts |
0.50% |
4.84% |
0.83% |
|
Lowest CI |
|||
|
Maine |
1.99% |
0.26% |
3.65% |
|
Vermont |
0.72% |
0.29% |
1.06% |
|
West Virginia |
1.93% |
0.29% |
2.24% |
|
District of Columbia |
0.11% |
0.39% |
0.28% |
in gifted and talented programs, one also finds a substantial difference in the RI for Hispanic and white students.
In summary, state-level data reveal the absence of a consistent pattern across states. No region of the country can be singled out as consistently placing greater or fewer percentages of minority students in special or gifted education. States with high proportions of minority students sometimes have higher placement rates, and sometimes lower. Some of the states with high placement rates for minority students also have high placement rates for white students, but this is not consistently the case. While federal IDEA legislation applies to all states, clearly the implementation is very much shaped by state-level policy and practice, just as gifted and talented programs are fundamentally different in conception and coverage in different states. We restate the caution, however, that state data fluctuate from year to year. The above tables using 1997 data appear in Appendix 2.A. The different configuration of states in some of these tables makes the point more concretely.
GENDER COMPARISONS
It is widely known that more boys than girls exhibit academic and behavioral problems. Furthermore, we have observed that for most disabilities, greater proportions of males are identified than females. OSEP does not report data broken down by gender; however OCR does, and it was noted in the 1982 National Research Council report that the overrepresentation in disability categories was a concern both for certain minority groups and for males (National Research Council, 1982). In analyzing the Larry P. decision from the perspective of the defense, Lambert (1981) commented that the magnitude of the overrepresentation of males in programs for educable mentally retarded children was far more egregious than the overrepresentation of black students. Figure 2-9 shows the proportion for males and females in each of the four categories monitored by OCR for the 1998 survey.
For the three disability groups, the overrepresentation of males is evident. The greatest gender disparity is found in ED, for which boys constitute almost 80 percent of all children served. In LD boys constitute close to 70 percent of the children served, while in mental retardation they constitute approximately 60 percent.
The 1998 survey data were plotted in Figure 2-10 to show differing risk of placement for ED by gender and ethnicity. What is evident from this figure is a main effect for males; for each racial/ethnic group, males are at over three times the risk for being classified as ED than are females in the same racial/ethnic group except for Asian/Pacific Islander (for whom males are still more than twice as likely). It is also interesting that the rank order
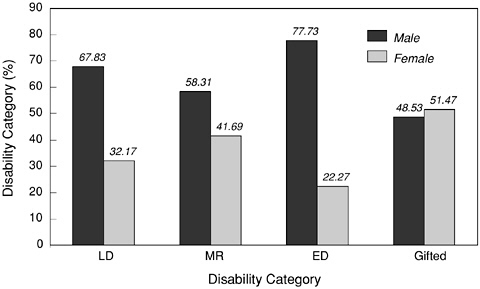
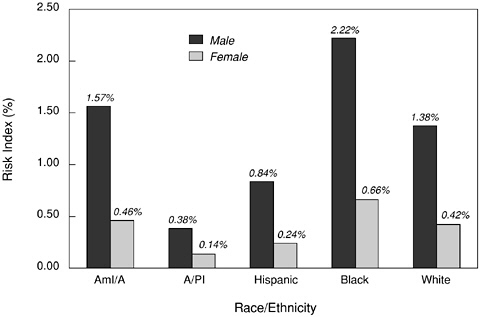
for risk by racial/ethnic group holds for both males and females. That is, black students (both male and female) are at higher risk than members of other racial/ethnic groups of the same gender. American Indian/Alaskan Native males and females are at next highest risk, followed by whites, Hispanics, and then Asian/Pacific Islander.
The same comparison is shown in Figure 2-11 for the category of mental retardation. In comparison to the pattern found for ED, the magnitude of the disparity in risk within each racial/ethnic group is smaller. Nevertheless, males are at greater risk for being classified as having mental retardation in every racial/ethnic group. As was found for ED, the racial/ ethnic group rankings follow for both genders.
Data aggregated at the national level for gender, like the data on race/ ethnicity, obscure variability. To illustrate, consider the gender breakdown in the disability category of mental retardation. Alabama has among the highest placement rates in that category, and New Jersey the lowest. Figure 2-12 shows the gender breakdown by racial/ethnic group in Alabama. While males exceed females in all five racial/ethnic groups, the risk for black females being served as MR is over twice as great as the risk for males in any of the other groups. In New Jersey, one finds a very different pattern shown in Figure 2-13. The risk for American Indian/Alaskan Native females is greater than the risk for American Indian/Alaskan Native males. There is no gender difference in risk for Hispanic students. The risk for
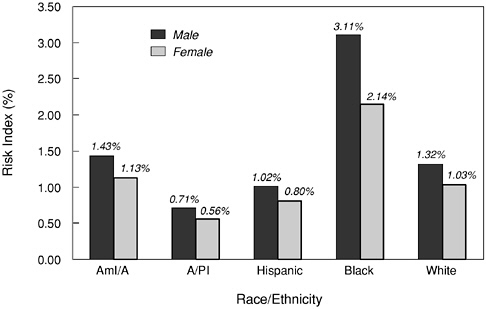
FIGURE 2-11 Ethnicity and gender breakdown for mental retardation: 1998 OCR data.
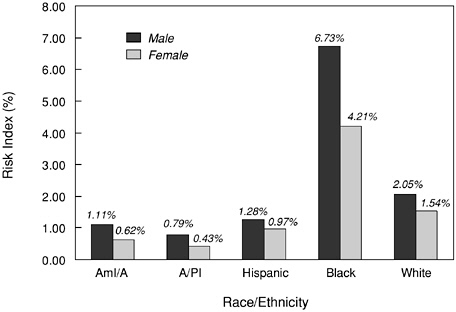

black females does not differ from Hispanic males or females, nor does it differ from American Indian/Alaskan Native females. Our point is simply that patterns that emerge at the national level fail to characterize the situation in many individual states. Moreover, the pattern in a given state probably fails to characterize the situation in individual school districts within that state.
EXPLAINING MINORITY REPRESENTATION
Special Education
OCR data are available at the school district level, and these data are sometimes analyzed to look for patterns in minority placement in special education. From the committee’s perspective, the available data are not up to the task of explanation. As the discussion above suggests, what is captured in the disability variables (ED, LD, MR) varies widely. The meaning of placement—whether it involves a completely segregated program or additional supports in the general education classroom—is not captured at all. The accuracy of the data on race/ethnicity is questionable. As we discuss in more detail in later chapters, the number of students placed in special education will depend on the demands of the classroom, the resources to provide additional attention in the general education or compensatory education context, and the proclivities of teachers, administrators, and parents. When none of these variables are captured in the data analysis, one cannot have confidence in the results, even when they are statistically significant.
Some research has analyzed district-level data in a search for placement patterns (e.g., Oswald et al., 2000; 1998). These analyses look at the effect of the proportion of students who are poor, or who are from school districts with large numbers of minority students, as explanatory factors. Oswald et al. (2000), for example, point to several patterns in the identification of minority students: (a) black and Hispanic students are identified as LD and ED more often in school districts characterized as high-poverty districts, and (b) black and Hispanic students are identified as MR more often in school districts characterized as low-poverty districts. The authors conclude that a substantial number of black students are being labeled MR inappropriately. While the correlation between poverty level and placement may be entirely accurate, the conclusion does not necessarily follow. A competing hypothesis—that students who meet criteria for MR are being placed in LD classifications in high-poverty districts—cannot be ruled out. And without information on the LD and MR interventions in low- and high-poverty districts, which is the more appropriate placement is not known.
Since gender and ethnicity contributed to the likelihood of placement in special education when several sociodemographic variables were controlled, district-level findings were interpreted by Oswald et al. as lending indirect support to the “systematic bias hypothesis.” In order for the correlation of gender and ethnicity with placement to signal systematic bias, it must be true that males and females, and students of all races, achieve and behave similarly in the classroom. If not, those achievement and behavior differences will be captured in the race and gender coefficients (absent control variables that were not available in the OCR data).
Other data, however, suggest that achievement and behavior cannot be assumed to be uncorrelated with race and gender. The recently published National Assessment of Educational Progress (NAEP) study of reading at the fourth-grade level reports percentages of students reading below the “basic” level by race/ethnicity: Asian = 22 percent, white = 27 percent, Hispanic = 58 percent, and black = 63 percent (Donohue et al., 2001). The students most likely to be referred for special education are those with low achievement, and there appear to be many more Hispanic and black students with low achievement in reading. Moreover, data from the Early Childhood Longitudinal Study (discussed in Chapter 3) suggest that, already at kindergarten entry, there are differences in classroom-relevant knowledge and behavior by race/ethnicity.
The interactions of minority and nonminority achievement levels with different levels of poverty and the composition of student enrollments are likely to be complex. It is plausible, however, that lower achievement by black or Hispanic students in a school context in which most of the white and/or Asian students are achieving at a higher level creates the circumstances that lead to greater disproportionate enrollment of the lower-achieving black or Hispanic students in special education. If there are smaller achievement differences between groups of students in districts with both high concentrations of minority students and high poverty, less disproportion may be observed as a consequence. We emphasize that data currently collected by OCR do not allow for a test of either the systematic bias or the achievement difference hypotheses. The need for different kinds of investigations that go beyond the establishment of correlation is apparent if one is to test these competing hypotheses.
One alternative approach is to conduct equal treatment studies of students referred for and either placed or not placed in special education. Hosp and Reschly (2001) compared black and white students placed in different special education programs, including part-time resource, full-time special class, etc. First, students in more restrictive placements, regardless of race, had more severe problems, a finding that is expected if there is any rationality associated with the continuum of special education program options. Second, for each placement, ranging from less to more restrictive, black
students had a greater number of problems and more severe problems than white students. For example, the black students placed in part-time resource programs had lower achievement test scores and were more likely to exhibit behavior problems. Similarly, the black students in full-time placements had more severe problems than similarly situated white students. The findings in this equal treatment study suggest that minority students must demonstrate greater need in order to receive special supports. Similar findings were reported for black and white students placed in special education in the mild mental retardation category (Reschly and Kicklighter, 1985; Reschly and Ward, 1991). While these results are suggestive, independent replication in a variety of districts wold be required before any conclusions can be drawn.
It is not the position of the committee that no discrimination takes place in placement decisions, but rather that the evidence available is insufficient to support a claim that either discrimination does or does not play a significant role. And if discrimination is operative, whether its consequence is excessive placement of minority student in special education or denial of special education service to minority students is unclear. The data presented at the district level lend themselves to multiple interpretations. Whether discrimination, genuine achievement differences, or both are at play, the committee believes that a policy response is warranted. Later chapters draw on extensive literatures to better understand each hypothesis and provide policy recommendations.
Gifted and Talented
Analyses of race/ethnicity and high achievement in the gifted and talented area are relatively rare (College Board, 1999). At the committee’s request, Miller (2000) examined existing datasets focusing on the representation of minority children at the upper end of the achievement distribution. He presented data (see Table 2-18) showing the percentage of children in 1st and 3rd grade performing above two cutoff scores in reading and math. Clearly, achievement differences are apparent early in the school years for minority children as a group. Table 2-19 suggests those patterns persist across subjects in 4th grade and apply to Native Americans/Alaskan Natives as well as blacks and Hispanics.
The complexity of this pattern becomes even more apparent when one considers differences between minority and majority children while attempting to control for social class differences (Table 2-20). In describing the above table, Miller points to two patterns:
First, for whites, blacks, and Hispanics, scores go up as the education level of students’ parents rises. Thus, within all three groups, the average
TABLE 2-18 Percentages of 1st Grade and 3rd Grade Cohorts in Prospects Study Who Scored At or Above the 50th and 75th Percentiles in Reading and Mathematics
|
|
First Grade Cohort |
Third Grade Cohort |
||||||
|
|
Reading |
Mathematics |
Reading |
Mathematics |
||||
|
Race/Ethnicity |
50th+ |
75th+ |
50th+ |
75th+ |
50th+ |
75th+ |
50th+ |
75th+ |
|
White |
48 |
22 |
55 |
27 |
58 |
30 |
54 |
29 |
|
Black |
23 |
7 |
25 |
8 |
19 |
6 |
22 |
8 |
|
Hispanic |
25 |
8 |
29 |
12 |
24 |
7 |
27 |
10 |
|
SOURCE: Miller (2000). |
||||||||
TABLE 2-19 Percentages of 4th Grade Students Who Scored Within the Proficient and Advanced Ranges on the 1998 Reading, 1996 Math, 1996 Science, and 1998 Writing Tests of the National Assessment of Educational Progress
|
|
Proficient |
Advanced |
||||||
|
Race/Ethnicity |
Reading |
Math |
Science |
Writing |
Reading |
Math |
Science |
Writing |
|
White |
29 |
25 |
33 |
27 |
10 |
3 |
4 |
2 |
|
Black |
9 |
5 |
7 |
8 |
1 |
0 |
0 |
0 |
|
Hispanic |
11 |
8 |
9 |
10 |
2 |
0 |
0 |
0 |
|
Asian/Pacific Islander |
25 |
21 |
25 |
32 |
12 |
5 |
4 |
4 |
|
American Indian |
12 |
7 |
24 |
11 |
2 |
1 |
2 |
1 |
|
SOURCES: Donahue (1999); Reece et al. (1997); Bourque et al. (1997); and Greenwald et al. (1999), compiled by Miller (2000). |
||||||||
NAEP reading and history scores for students who have parents with college degrees are a great deal higher than for students who have no parent with a high school diploma or who have one or both parents with a high school degree but no more. This pattern of scores going up as social class rises is a consistent finding of educational research going back several decades. It also is an unsurprising finding (p. 14).
He went on to describe the more surprising pattern of results in this table as follows:
TABLE 2-20 1994 Average NAEP Reading and History Scores for 12th Graders, by Race/Ethnicity and Parent Education Level
|
|
1994 NAEP Reading Test Score Averages by Parent Education Level |
1994 NAEP History Test Score Averages by Parent Education Level |
||||||
|
Race/Ethnicity |
Less than High School Degree |
Graduated from High School |
Some Post-Secondary Education |
Graduated from College |
Less than High School Degree |
Graduated from College |
Some Post-Secondary Education |
Graduated from College |
|
White |
274 |
283 |
294 |
302 |
271 |
281 |
291 |
300 |
|
Black |
258 |
258 |
271 |
272 |
251 |
258 |
269 |
273 |
|
Hispanic |
260 |
265 |
279 |
283 |
256 |
264 |
277 |
277 |
|
White–Black= |
16 |
25 |
23 |
30 |
20 |
23 |
22 |
27 |
|
White–Hispanic= |
14 |
17 |
15 |
19 |
14 |
17 |
14 |
23 |
|
NOTE: Differences in white and black scores and in white and Hispanic scores were calculated before rounding. SOURCES: Campbell et al. (1996) and Beatty et al. (1996), compiled by Miller (2000). |
||||||||
The second important pattern in the data...is that, despite the tendency across the racial/ethnic groups for average scores to rise with parent education level, there are, nevertheless, large differences in average scores among the racial/ethnic groups at each parent education level. Indeed, there is a tendency for the gaps in average scores to be larger at high parent education levels than at low parent education levels. In any case, for both tests, black 12th graders with parents with college degrees had average scores that were about the same as for white students with no parent with a high school diploma. And Hispanics with parents with college degrees had average scores close to those of white students who had parents with a high school degree (pp. 14-15).
Data presented in his paper (see Table 2-20) were interpreted to support several important conclusions and generalizations about the pattern of minority underrepresentation among high-achieving students:
-
The overall underrepresentation of several racial/ethnic minority groups among top students relative to the white majority is very extensive and long-standing.
-
This limited minority presence among top students is found using virtually all traditional measures of academic achievement, including school grades, standardized test scores, and class rank.
-
Extensive underrepresentation is present at all levels of the educational system, beginning in kindergarten.
-
The limited presence of several minority groups among high-achieving students cuts across social class lines, that is, substantial minority-majority achievement gaps exist at all social class levels as measured by parent education and family income (Miller, 2000:1).
As with the special education analyses, data correlations cannot begin to suggest why the achievement distributions differ. Rather, they describe a situation in which available measures of student achievement place a smaller proportion of non-Asian minority children in the upper range from which gifted students are likely to be drawn.
CONCLUSIONS AND RECOMMENDATIONS
The national datasets provided by OCR and OSEP provide a snapshot of the relative participation in special education categories of children in different racial/ethnic groups. An important caveat that we have emphasized is that the figures aggregated at a national level obscure variations at the state and local levels and do not permit examination of other factors (e.g., social class, exposure to risk factors) that correlate with race and
ethnicity. In addition, we have noted that weaknesses in the data temper the confidence with which conclusions can be drawn.
Nevertheless, these two large datasets suggest that both black and American Indian/Alaskan Native children are at heightened risk for identification as having mental retardation and emotional disturbance. In the most recent surveys, black children are twice as likely as their white counterparts to be classified as MR and half again as likely to be classified as ED. American Indian/Alaskan Native students are also at slightly higher risk than white students for being identified as MR and LD. Conversely, Asian/Pacific Islander students are least likely to be classified MR, LD, or ED.
Clearly, the LD category subsumes the vast majority of children classified into one of the judgmental high-incidence categories. The recent surveys find that over 6 percent of the children in all racial/ethnic groups, except Asian/Pacific Islander, are served in the category of LD. American Indian/Alaskan Native students are somewhat more at risk for identification as LD. Despite the high rates of assignment to the LD category, since the rate of participation of black and Hispanic students approximates that of white students overall, the issue of overrepresentation has generally not been raised.
The picture from the gifted and talented data is a mirror image of what is seen for mental retardation. The 1998 OCR survey reveals a rather high rate of participation of students in gifted programs: 6.20 percent of the nation’s students are projected to be participating. Asian/Pacific Islander students are clearly the most likely to participate, with far lower placement rates for blacks and Hispanics.
There continues to be higher participation in the high-incidence disability categories for males. The greatest gender disparity in identification rates is found in the ED category (80-percent male), followed by LD (70-percent male) and MR (60-percent male).
Using the OCR surveys over time permits some examination of how participation by children in the racial/ethnic groups in certain disability categories has changed (see Table 2-21). Of the four categories considered (MR, LD, ED, and gifted and talented), only mental retardation shows a reduction in the percentage of children served between the mid-1970s and 1998.
Between the mid-1970s and 1998 the only category in which risk for identification fell is mental retardation. The racial/ethnic group in which there is the largest reduction is black students (–1.08 percent), while there has been a very slight increase for Asian/Pacific Islander students (0.19 percent). For the learning disability category, there has been a dramatic and uniform increase in the risk for identification. There are substantially more
TABLE 2-21 Changes in Participation Rates in Judgmental Categories by Ethnic Group (Percentage)
|
|
AmI/A |
A/PI |
Hispanic |
Black |
White |
Total |
|
Mental Retardation |
||||||
|
1974 |
1.94 |
0.45 |
1.50 |
3.72 |
1.19 |
1.58 |
|
1998 |
1.28 |
0.64 |
0.92 |
2.64 |
1.18 |
1.37 |
|
|
-0.65 |
0.19 |
-0.58 |
-1.08 |
-0.01 |
-0.21 |
|
Learning Disabilities |
||||||
|
1974 |
1.60 |
0.52 |
1.29 |
1.03 |
1.24 |
1.21 |
|
1998 |
7.45 |
2.23 |
6.44 |
6.49 |
6.02 |
6.02 |
|
|
5.86 |
1.70 |
5.15 |
5.46 |
4.78 |
4.82 |
|
Emotionally Disturbed |
||||||
|
1976 |
0.29 |
0.08 |
0.25 |
0.42 |
0.26 |
0.28 |
|
1998 |
1.03 |
0.26 |
0.55 |
1.45 |
0.91 |
0.93 |
|
|
0.74 |
0.18 |
0.30 |
1.03 |
0.66 |
0.65 |
|
Gifted and Talented |
||||||
|
1976 |
0.42 |
2.26 |
0.40 |
0.47 |
1.05 |
0.93 |
|
1998 |
4.86 |
9.98 |
3.57 |
3.04 |
7.47 |
6.20 |
|
|
4.44 |
7.72 |
3.17 |
2.57 |
6.42 |
5.27 |
black and Hispanic students served as LD than are served in MR and ED combined, although placement in this category shows no disproportion for those groups.
For ED there has been an increase for all groups; however, the increase is far more modest than what has occurred in the LD category. The increase in placement rates (“risk”) for gifted and talented programs is greater than for any of the three judgmental disability categories—5.27 percent across racial/ethnic groups; however, the increase for black and Hispanic students is substantially less than for the other racial/ethnic groups.
In the next few chapters we look at potential explanations for the patterns suggested by the data. But for the reasons described in this chapter, these data are a weak foundation on which to build public policy. The committee urges that policy decisions utilizing these datasets explicitly recognize the tenuous nature of the data.
Our recommendations with respect to data collection (DC) are directed at two goals: one is to improve the existing data collection process designed for monitoring program participation and civil rights compliance, and the other is to expand the collection of data to allow for research that would improve understanding of nonnormative achievement and behavior, as well as responses to intervention. Currently there is considerable redundancy in the reporting requirements placed on schools by the Office for Civil Rights and the Office of Special Education Programs. In response to the Paper-
work Reduction Act of 1995 (44 U.S.C. Chapter 35), the Department of Education provided states with the option in 2001 of consolidated data collection on students with disabilities (Federal Register: March 8, 2001 (Vol. 66, Number 46)), an option that few states have chosen. While the efforts of the two agencies within the Department of Education to consolidate the collection are commendable, the committee believes a reexamination of survey design in the interest both of providing more reliable indicators, and of facilitating reporting from the perspective of local education agencies and states, is warranted.
Recommendation DC.1: The committee recommends that the Department of Education conduct a single, well-designed data collection effort to monitor both the number of children receiving services through the Individuals with Disabilities Education Act and the characteristics of those children of concern to civil rights enforcement efforts.
Whether data collection responsibility is given to either of these offices, the National Center for Education Statistics, or some other entity, the shift in responsibility would require supporting changes:
-
Data collected should meet all requirements for effective OCR monitoring, including disaggregated data by district and state, and they should be accessed easily by OCR and OSEP. This would require data collection to accommodate OCR’s monitoring of data on assignment to gifted and talented programs and on limited English proficiency not currently collected by OSEP. The definitions in this category should allow for the distinction between “gifted” and “talented” to the extent that students are being served in different types of programs.
-
In the reauthorization of IDEA, statutory authority should be given to those responsible for data collection to collect child count data for disability category by racial/ethnic group by gender for both special education and gifted and talented placements as well as by state and local district levels.
The committee urges the federal agency reporting on special education enrollments by racial/ethnic group do so by reporting risk indices—the proportion of a given racial/ethnic group’s enrollment in the general school population that is enrolled in a given disability category. In order to accomplish this goal, steps must be taken to coordinate reporting child counts by age, currently done in the OSEP reporting by disability category, for ages 3-21, with the NCES Common Core of Data, which reports by grade level. This would remedy the current situation in which it is impossible to align the ages 3-5 and the 18-21 child count by OSEP with any meaningful count of the total population.
The committee also urges that the Office for Civil Rights monitor the impact of education reform initiatives, such as high-stakes testing programs, to ensure that implementation of these initiatives does not exacerbate minority representation problems in special or gifted education.
While a more careful data collection effort of the sort outlined above would improve the understanding of who is being assigned to special education and gifted and talented programs, it would do little to further understanding of the reasons for placement, the appropriateness of placement (or nonplacement), the services provided, or the consequences that ensue.
Moreover, the variation observed from one state to the next serves as a reminder that in special education or gifted and talented programs, we refer to practices that differ dramatically from one location to the next. While special education may be a set of well-targeted specialized classroom supports for children in need in one school, it may be a dead-end program in others—a last resort for teachers who can no longer work with a student. The data are not available to tell which it is, in which schools, and for which students. And while the data are poor with respect to special education, the data on gifted and talented students are even worse.
Recommendation DC.2: The committee recommends that a national advisory panel be convened to design the collection of nationally representative longitudinal data that would allow for more informed study of minority disproportion in special education and gifted and talented programs. The panel should include scholars in special education research as well as researchers experienced in national longitudinal data collection and analysts in a variety of allied fields, including anthropology, psychology, and sociology.
The panel should assess the cost of collecting data that could answer the following questions:
-
What antecedents to special education placement are associated with students’ assignment to special education services? Antecedents studied should include, but not be limited to: race (self-identified and school-identified), gender, and other socioeconomic and social background factors, and school factors, such as class size, teacher experience and preparation, instructional strategies, and school and classroom resources.
-
How do schools differ in their categorization of students, and are these differences associated with differences in students’ access to special education services?
-
Are students who present with the same researcher-identified condition treated differently in different schools and, if so, what policy, resource, and individual-level factors are associated with these differences in treatment? What is the incidence of students who have the same research-iden-
-
tified conditions but are never referred for special education assessment? And is referral to special education assessment associated with severity of the researcher-identified condition or some other factors?
-
If students who present with the same researcher-identified condition are treated differently, how is access or lack of access to a variety of special education services associated with later levels of cognitive achievement and behavioral adjustment?
The data would have improved value if the following additional information were included:
-
how long the family has lived in the United States;
-
birth country of students, their parents, and their grandparents;
-
language proficiency (in both English and native language);
-
education level of parents;
-
level of acculturation; and
-
experiences with literacy artifacts and practices.
Analysis for this report of the effect of race/ethnicity on special education placement or outcomes was made more difficult because many research studies did not specify the racial/ethnic composition of the sample or had too few minority children to measure effects by race/ethnicity. The committee urges that research funded by the Department of Education using these or other data require the careful description of samples as well as differential effects, to the extent feasible, by race, ethnicity, limited English proficiency, socioeconomic status, and gender.
APPENDIX 2-A
TABLE 2-A1 1997 Comparison of States by Highest Risk (RI) and Composition (CI) Indices for Black Students in the Category of Mental Retardation
|
State |
RI |
CI |
White RI for State |
|
Highest RI |
|||
|
Arizona |
5.62% |
43.11% |
0.69% |
|
Alabama |
5.58% |
62.93% |
1.90% |
|
Iowa |
4.92% |
6.67% |
2.58% |
|
Nebraska |
4.30% |
11.46% |
1.95% |
|
Highest CI |
|||
|
District of Columbia |
1.21% |
95.36% |
0.13% |
|
Mississippi |
2.38% |
78.45% |
0.63% |
|
Georgia |
3.44% |
64.19% |
1.28% |
|
Alabama |
5.58% |
62.93% |
1.90% |
TABLE 2-A2 1997 Comparison of States by Highest Risk (RI) and Composition (CI) Indices for Hispanic Students in the Category of Mental Retardation
|
State |
RI |
CI |
White RI for State |
|
Highest RI |
|||
|
Nebraska |
2.43% |
5.52% |
1.95% |
|
Iowa |
2.19% |
2.08% |
2.58% |
|
Ohio |
2.16% |
1.43% |
2.34% |
|
Hawaii |
2.06% |
3.44% |
6.78% |
|
Highest CI |
|||
|
New Mexico |
0.81% |
51.97% |
0.56% |
|
California |
0.50% |
43.50% |
0.40% |
|
Arizona |
1.02% |
34.94% |
0.69% |
|
Texas |
0.72% |
34.85% |
0.60% |
TABLE 2-A3 1997 Comparison of States by Highest Risk (RI) and Composition (CI) Indices for Black Students in the Category of Learning Disabilities
|
State |
RI |
CI |
White RI for State |
|
Highest RI |
|||
|
Delaware |
11.84% |
43.72% |
6.75% |
|
New Mexico |
9.99% |
3.06% |
6.83% |
|
Nevada |
9.61% |
14.92% |
6.19% |
|
Alabama |
9.47% |
30.63% |
5.79% |
|
Highest CI |
|||
|
District of Columbia |
5.34% |
90.97% |
3.94% |
|
Mississippi |
6.83% |
56.76% |
5.15% |
|
Louisiana |
6.65% |
53.83% |
4.26% |
|
South Carolina |
4.96% |
43.29% |
5.03% |
TABLE 2-A4 1997 Comparison of States by Highest Risk (RI) and Composition (CI) Indices for Hispanic Students in the Category of Learning Disability
|
State |
RI |
CI |
White RI for State |
|
Highest RI |
|||
|
Delaware |
8.88% |
3.35% |
6.75% |
|
New York |
8.41% |
21.42% |
6.63% |
|
New Mexico |
8.21% |
52.79% |
6.83% |
|
|
13.84% |
6.89% |
7.37% |
|
Highest CI |
|||
|
New Mexico |
8.21% |
52.79% |
6.83% |
|
California |
5.27% |
41.89% |
4.92% |
|
Texas |
6.82% |
36.62% |
6.69% |
|
Arizona |
5.40% |
31.80% |
4.40% |
TABLE 2-A5 1997 Comparison of States by Highest Risk (RI) and Composition (CI) Indices for Black Students in the Category of Emotional Disturbance
|
State |
RI |
CI |
White RI for State |
|
Highest RI |
|||
|
Minnesota |
3.64% |
10.39% |
1.84% |
|
Iowa |
3.49% |
12.54% |
0.92% |
|
Nebraska |
2.81% |
19.79% |
0.71% |
|
Highest CI |
|||
|
District of Columbia |
0.97% |
97.54% |
0.19% |
|
Louisiana |
1.00% |
59.65% |
0.51% |
|
South Carolina |
0.93% |
55.67% |
0.58% |
|
North Carolina |
1.25% |
50.92% |
0.53% |
TABLE 2-A6 1997 Comparison of States by Highest Risk (RI) and Composition (CI) Indices for Hispanic Students in the Category of Emotional Disturbance
|
State |
RI |
CI |
White RI for State |
|
Highest RI |
|||
|
Vermont |
2.38% |
0.70% |
1.40% |
|
Minnesota |
1.76% |
2.16% |
1.84% |
|
Hawaii |
1.53% |
3.29% |
1.52% |
|
Highest CI |
|||
|
New Mexico |
0.85% |
43.68% |
1.10% |
|
Texas |
0.67% |
26.15% |
1.09% |
|
New York |
1.48% |
21.26% |
0.74% |
|
California |
0.08% |
17.40% |
0.24% |
TABLE 2-A7 1997 Comparison of States by Lowest Risk (RI) and Composition (CI) Indices for Black Students in the Category of Gifted and Talented
|
State |
RI |
CI |
White RI for State |
|
Lowest RI |
|||
|
Massachusetts |
0.39% |
3.94% |
0.83% |
|
New Hampshire |
0.39% |
0.28% |
1.34% |
|
Louisiana |
0.72% |
12.31% |
3.81% |
|
Kansas |
0.80% |
2.31% |
3.37% |
|
Lowest CI |
|||
|
North Dakota |
2.14% |
0.39% |
4.80% |
|
Idaho |
1.99% |
0.42% |
2.97% |
|
Montana |
6.42% |
0.52% |
6.57% |
|
Wyoming |
2.75% |
0.52% |
3.75% |
TABLE 2-A8 1997 Comparison of States by Lowest Risk (RI) and Composition (CI) Indices for Hispanic Students in the Category of Gifted and Talented
|
State |
RI |
CI |
White RI for State |
|
Lowest RI |
|||
|
New Hampshire |
0.25% |
0.27% |
1.34% |
|
Massachusetts |
0.50% |
5.62% |
0.83% |
|
New York |
0.66% |
3.74% |
5.04% |
|
Kansas |
0.72% |
1.59% |
3.37% |
|
Lowest CI |
|||
|
West Virginia |
0.77% |
0.11% |
2.31% |
|
Maine |
0.97% |
0.14% |
3.25% |
|
New Hampshire |
0.25% |
0.27% |
1.34% |
|
Mississippi |
2.92% |
0.29% |
7.70% |