Making Sense of Complexity: Summary of the Workshop on Dynamical Modeling of Complex Biomedical Systems (2002)
Chapter: Color Plates
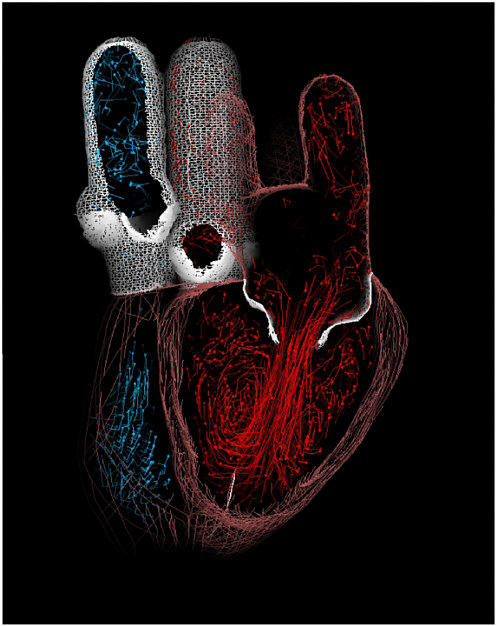
PLATE 1 Section of the model heart through the left ventricle in diastole. Structures at the top (from left to right in the figure) are pulmonary artery, aorta, and left atrium (with two pulmonary veins appearing in the section). At the bottom (from left to right in the figure), are the right and left ventricles. The anterior and posterior leaflets of the mitral valve appear in cross section at the top of the left ventricle. Note the prominent vortex (rotating clockwise in the figure) that has been shed from the anterior leaflet of the mitral valve, and the less prominent counter-rotating vortex that has been shed from the posterior leaflet. Together these are presumably the cross section of a ring vortex that has been shed like a smoke-ring from the mitral valve as a whole. Reprinted with permission from Kovacs, S.J., D.M. McQueen, and C.S. Peskin. Modeling cardiac fluid dynamics and diastolic function. Phil. Trans. R. Soc. Lond. A 359:1299-1314, 2001.
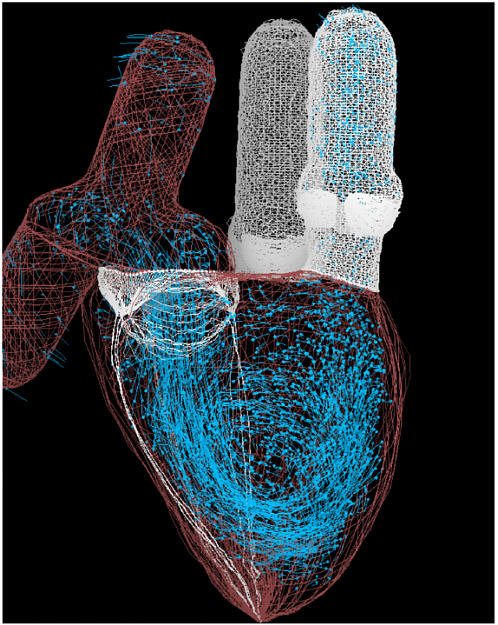
PLATE 2 Cutaway view of the model heart showing the flow pattern of blood in the right ventricle during diastole. Structures seen from left to right in the upper part of the figure are the superior vena cava connecting to the right atrium with the interior vena cava below, the aorta, and the pulmonary artery. In the lower part of the figure, a prominent vortex (rotating counterclockwise in the figure) fills the right ventricle. A jet of blood flowing through the open tricuspid valve merges with and presumably drives this vortex. Reprinted with permission from Kovacs, S.J., D.M. McQueen, and C.S. Peskin. Modeling cardiac fluid dynamics and diastolic function. Phil. Trans. R. Soc. Lond. A 359:1299-1314, 2001.