Ocean Noise and Marine Mammals (2003)
Chapter: Color Plates
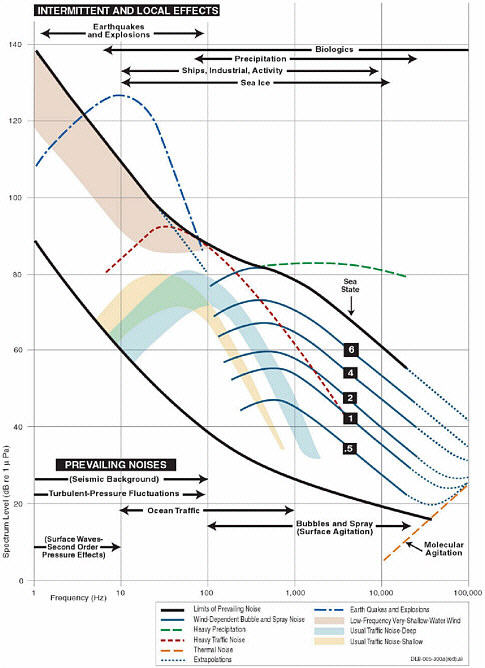

PLATE 2 Range of odontocete audiograms superimposed on the background noise levels. The Wenz curves describe relative levels of marine ambient noise from weather, wind, geologic activity, and commercial shipping. The audiograms are pressure spectral levels with units of dB re 1 µPa, whereas the Wenz noise curves are those of pressure spectral density having units of dB re 1 µPa2/Hz. (Actually, Wenz collected ambient noise spectra for various frequency bandwidths and converted their levels to a 1-Hz [“1-cps”] bandwidth [Wenz, 1962].) The Wenz curves can be converted into spectral levels for a frequency band of interest by integrating the spectral density levels across that frequency band of interest, after first converting from logarithmic to linear units of µPa2/Hz. The comparison of spectral and spectral density levels shown assumes the bandwidth of integration is 1 Hz; the spectral density level is equivalent to the spectral level for a 1-Hz-wide bandwidth. From a biological perspective, the appropriate frequency band over which to integrate noise spectral densities is determined by the frequency discrimination capabilities of the animals’ hearing. This figure illustrates the similarity in the frequency dependence of naturally occurring wind noise and marine mammal hearing capability and indicates how the frequency content of other noise sources (e.g., shipping) relate to this hearing capability. (Unpublished abstract JASA, 2001; adapted from Wenz [1962] and presented at Acoustical Society of America, December 2001.)
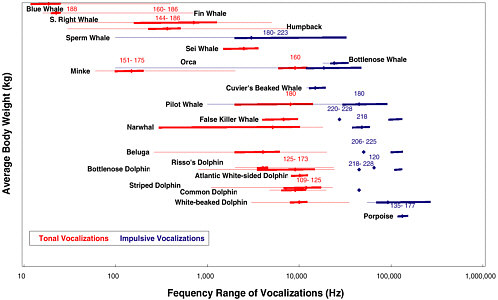
PLATE 3 Representative vocalizations of marine mammals by average adult body weight. Tonal vocalizations are plotted in red; impulsive vocalizations are shown in blue. The thicker lines indicate the frequencies near maximum energy, and the thin lines indicate the total range of frequencies in vocalizations. Numbers above the line indicate measured source levels in dB reµPa at 1m. Body weight data are taken from Table 10.1 in Boness et al. (2002); vocalization data are summarized from Table 4.1 in Wartzok and Ketten (1999) updated with additional information from Hooker and Whitehead (2002), Frantzis et al. (2002), Møhl et al. (2000), and Rasmussen et al. (2002).

PLATE 4 Air-gun array directivity. The amplitude and frequency content of air-gun signals are dependent on the downward angle and the horizontal azimuth of the emitted sound. The frequency response of the 4550 air-gun array signal is shown as a function of direction. The radial lines on each plot represent emission angles from the vertical (0, 30, 60, 90), and the concentric half-circles represent increasing frequencies. Cold colors indicate lower amplitudes, and the hot colors indicate higher amplitudes. The plot on the left shows the response along the inline axis of the array (fore to aft), and the plot on the right shows the cross-line response (port to starboard). In both instances it can be observed that, in general, there are less high frequencies in the emissions away from the vertical. Courtesy of Philip Fontana, Veritas DGC.

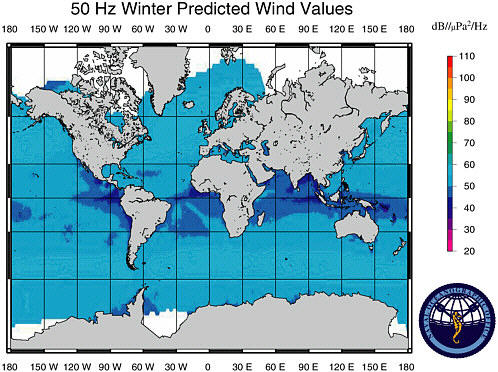
PLATE 6a-d An example wind noise estimate generated by the U.S. Naval Oceanographic Office. Wind speeds for the center months of the season were extracted from the OAML Surface Marine Gridded Climatology (SMGC) database at a 1-degree grid spacing. Wind speeds were converted to noise levels using Wenz curves. Predictions of noise in the absence of other noise producers are shown for the 50-Hz frequency band. (NOTE: Summer includes JulySeptember; winter includes January–March.)


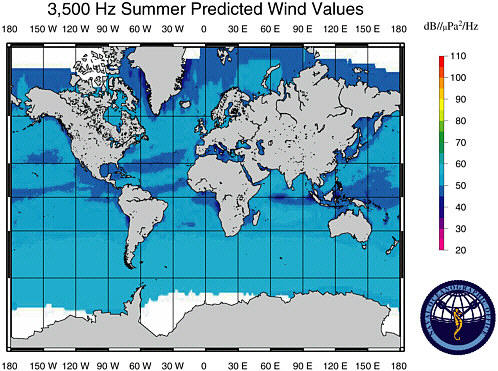

PLATE 7a-d Mean ambient noise measurements for the world’s oceans. The mean values of measured data are displayed in units of dB/1 µPa2/Hz, data are given for 2-degree cells where more than one data point exists. Unshaded areas have fewer than two datapoints in the NAVOCEANO database. The mean of the measured decibel values was calculated and reported at the center of the cell. Data are displayed for winter (January–March) (a) 50 Hz and (b) 3,500 Hz and summer (July–August) (c) 50 Hz, and (d) 3500 Hz.


