Health and Safety Needs of Older Workers (2004)
Chapter: 2 Demographic Characteristics of the Older Workforce
2
Demographic Characteristics of the Older Workforce
DEMOGRAPHIC TRENDS OF OLDER PERSONS
The dominant population trend of the latter part of the 20th century results from a change in demographic structure known as population aging, brought about by a combination of lengthening life expectancy, decline in fertility, and an unusually large “baby boom” generation (Redburn, 1998; Moody, 2002). The aging of “boomers” is experienced in the workforce as a large number of older workers who are now beginning to retire. The effects this is going to have over the next 30 years both on the age distribution in the workforce and the size of the retired population is suggested by data presented in Figure 2-1. The aging workforce (portion of the population 45–64) and the increase in size and proportion of older adults (age 65 and older, most of whom will be retired) will have important effects for at least the next quarter century.
Interest in life after work has also increased in keeping with another significant 20th-century development—the striking improvement in life expectancy (Kinsella and Gist, 1995). Half a century ago, globally most people died before the age of 50. By 1995, the average life expectancy was more than 65 years, an increase of about three years from as recently as 1985. Life expectancy is now over 75 years in industrialized countries, 64 years in developing countries, and 52 years in the least developed countries. The
Appendixes A and B are not printed in this volume but are available online. Go to http://www.nap.edu and search for Health and Safety Needs of Older Workers.
number of countries having a life expectancy at birth of over 60 years increased from at least 98 (with a total population of 2.7 billion) in 1980 to at least 120 (with a total population of 4.9 billion) in 1995.
How Many Older Persons Are There?
Taking age 45 as the beginning age for inclusion, there are a large number of Americans in the age range of older workers, and they represent a large percentage of the population. In the year 2000, the U.S. civilian noninstitutionalized population, age 16 years and older, was 209.7 million (we shall refer to this group of mostly working-age people as the “population” in the following discussion). Close to half of this population (44 percent) were age 45 or over, with 15 percent over age 64 (Fullerton and Toossi, 2001). The number of women exceeds the number of men at all age groups, and the life expectancy of women exceeds that of men. At higher ages, the ratio of men to women declines from 92 percent in the 55 to 64 age range, to 82 percent in the 65 to 74 age range, to 69 percent in the 75 to 84 age range, and to 49 percent at older ages (U.S. Bureau of the Census, 1999).
Of the population, 174.4 million (83 percent) were white; 25.3 million (12 percent) were black; 10.1 million (5 percent) were Asian and other; and 22.4 million (11 percent) were of Hispanic origin (a category that overlaps the others). For each of these racial and ethnic groups, the number of women over the age of 50 exceeds that of men in the same age group in similar proportions for each racial and ethnic group. However, the racial and ethnic groups show significantly different proportions of older persons. Within the white population, 39 percent are over the age of 50; the percentage is 28 for blacks and only 20 for people of Hispanic origin (U.S. Bureau of the Census, 2000).
What Are the Past and Future Trends?
The year 2000 figures represent a continuing trend toward an increasing number of older persons constituting an increasing proportion of the population. Population pyramids for the years 1900, 1980, 1990, and 2000 show a historical trend away from the high proportion of younger people that created bottom-heavy distributions at the beginning of last century toward a more equal distribution of the population across age groups (see Figure 2-1, from Fullerton and Toossi, 2001). After World War II, the baby boom of 1946 to 1964 resulted in a prominent population bulge, with 75 million persons born. As they age, these baby boomers increasingly contribute to the growing proportion of older persons in the population, until, by the year 2060 or thereabouts, their numbers disappear.
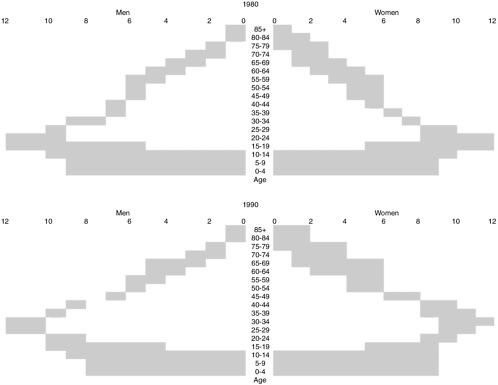
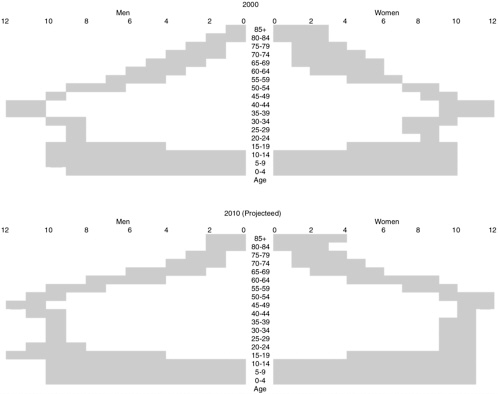
Table 2-1 illustrates three major trends. First, there has been a significant increase in the general American population, from the year 1900 (50.1 million) to 2000 (209.7 million). Second, there has been a dramatic increase in the number and percentage of people age 45 and older (from 13.7 million in 1990 to 93.2 million in 2000, a shift from 26 percent to 44 percent of the population). Third, both the number of women age 45 and over and the proportion of the population they represent have shown a startling in-
TABLE 2-1 Trends and Projections for Numbers and Percentages of Older Persons (Over Age 44) in the United States
|
|
1900 |
2000 |
||
|
Year |
Million |
Percenta |
Million |
Percentb |
|
Populationc |
50.1 |
100 |
209.7 |
100 |
|
Men and Women |
||||
|
74+ |
0.9 |
2 |
14.9 |
7 |
|
65–74 |
2.2 |
4 |
17.8 |
8 |
|
55–64 |
4.1 |
7 |
23.6 |
11 |
|
45–54 |
6.5 |
13 |
36.9 |
18 |
|
Total |
13.7 |
26 |
93.2 |
44 |
|
Women |
||||
|
74+ |
0.5 |
1 |
9.0 |
4 |
|
65–74 |
1.0 |
2 |
9.7 |
5 |
|
55–64 |
2.0 |
4 |
12.4 |
6 |
|
45–54 |
3.0 |
6 |
18.9 |
9 |
|
Total |
6.5 |
13 |
50.0 |
24 |
|
Men |
||||
|
74+ |
0.4 |
1 |
5.9 |
3 |
|
65–74 |
1.2 |
2 |
8.1 |
4 |
|
55–64 |
2.1 |
4 |
11.3 |
5 |
|
45–54 |
3.5 |
7 |
18.0 |
9 |
|
Total |
7.2 |
14 |
43.3 |
21 |
|
aPercent is of the population of persons for the given year who are over 15 years of age. bPercent is of the noninstitutionalized civilian population for the given year who are 16 years of age and older. cPopulation is, for the years 1900, 2020, and 2050, the population of persons for the given year who are over 15 years of age. For the years 2000 and 2010, population is the population of noninstitutionalized, civilian persons for the given year who are 16 years of age or older. SOURCE: Data for years 2000 and 2010 are adapted from Fullerton and Toossi (2001: Table 2). Data for years 1900, 2020, and 2050 are adapted from U.S. Bureau of the Census (1993: Figures 1, 3, and 4). |
||||
crease: in 1900 the number of men in the population (7.2 million, 14 percent of the population) exceeded that of women (6.5 million, 13 percent); by 2000, the number of women over the age of 45 had grown to 50 million (24 percent of the population), exceeding the number and percentage of men in that age group (43.3 million, 21 percent). These trends are carried through at virtually all age groupings of older persons (45–54 years; 55–64 years; 65–74 years; and 75+ years).
|
2010 |
2020 |
2050 |
|||
|
Million |
Percentb |
Million |
Percenta |
Million |
Percenta |
|
233.7 |
100 |
258.8 |
100 |
309.0 |
100 |
|
16.3 |
7 |
21.9 |
9 |
43.6 |
14 |
|
20.6 |
9 |
31.6 |
12 |
35.2 |
11 |
|
34.8 |
15 |
42.0 |
16 |
42.7 |
14 |
|
43.9 |
19 |
38.2 |
15 |
43.4 |
14 |
|
115.6 |
50 |
133.7 |
52 |
164.9 |
53 |
|
9.8 |
4 |
13.0 |
5 |
24.9 |
8 |
|
11.2 |
5 |
16.6 |
6 |
18.1 |
6 |
|
18.2 |
8 |
21.6 |
8 |
22.0 |
7 |
|
22.4 |
10 |
19.5 |
8 |
22.3 |
7 |
|
61.6 |
27 |
70.7 |
27 |
87.3 |
28 |
|
6.5 |
3 |
8.9 |
3 |
18.7 |
6 |
|
9.4 |
4 |
15.0 |
6 |
17.1 |
6 |
|
16.6 |
7 |
20.4 |
8 |
20.7 |
7 |
|
21.5 |
9 |
18.7 |
7 |
21.1 |
7 |
|
54.0 |
23 |
63.0 |
24 |
77.6 |
26 |
These trends are projected, with some modification, to continue (see Table 2-1). Nearer-term projections by Fullerton and Toossi (2001) indicate that by 2010 the U.S. civilian, noninstitutionalized population 16 years of age and over will increase to 233.7 million, of whom fully 50 percent (115.6 million) will be age 45 or over. The percentage of the population who are women over age 45 will increase to 27 percent (61.6 million), continuing to exceed that of men, whose numbers and percentage of the population will, nevertheless, continue to grow as well.
Longer-term projections (U.S. Bureau of the Census, 1993: Table 2-1) suggest that these trends will continue through the year 2050, after which there is a projected leveling off of the increase of persons age 45 and over. The population over age 15 is projected to increase to 309 million by the year 2050. The number of those age 45 and older is expected to reach 170 million by the year 2050, representing 53 percent of the population.
DEMOGRAPHIC TRENDS OF OLDER WORKERS
Employment Trends of Men and Women in the 1980s and 1990s
The two most salient changes in the American labor force over the second half of the 20th century were the decline in the labor force participation rate of older men and the rise in the labor force participation rate of women. As nations become wealthier, part of that wealth is used to finance increased leisure. Costa (1998) argues that this growth in wealth in the U.S. population is behind the decline in the labor force participation rate of older men that she traces back to the late 19th century.
Table 2-2 reports labor force participation rates for men in the United States from 1940 to 2001 using cross sectional data from the U.S. Decennial Censuses of 1940 to 1960 and from the Current Population Survey (CPS) thereafter (Table A-1 in Appendix A expands Table 2-2 to include additional years and ages). Labor force participation is measured using questions about respondents’ major activity in the week prior to the survey. Those who were employed or unemployed but looking for work are considered to be in the labor force. The labor force participation rate is the share of the relevant population that is employed, on temporary layoff, or actively looking for a job.
If the typical retirement age of men in a society is defined as the age at which only one-half of them remain in the labor force, then the typical retirement age occurred at about age 70 in 1940. After War World II the typical retirement age dropped in an irregular pattern, and, because of substantial increases in life expectancy after age 65, the length of time between retirement and death dramatically increased. In addition to increased personal wealth, post–World War II growth in private pension
TABLE 2-2 U.S. Labor Force Participation Rates of Men by Age, 1940–2001
|
|
Age |
||||||
|
Year |
50 |
55 |
60 |
62 |
65 |
66 |
70 |
|
1940a |
|
93.8 |
85.5 |
80.0 |
70.0 |
68.1 |
48.6 |
|
1950a |
|
90.6 |
84.7 |
81.2 |
71.7 |
67.1 |
49.8 |
|
1960a |
|
92.8 |
85.9 |
79.8 |
56.8 |
49.0 |
37.2 |
|
1970 |
93.4 |
88.0 |
81.7 |
73.1 |
47.4 |
39.3 |
30.5 |
|
1975 |
91.0 |
86.0 |
79.0 |
68.8 |
41.9 |
32.6 |
25.7 |
|
1980 |
92.0 |
83.5 |
74.5 |
60.7 |
35.3 |
30.4 |
24.8 |
|
1985 |
92.2 |
84.3 |
70.8 |
50.6 |
32.2 |
25.8 |
20.5 |
|
1990 |
90.9 |
84.9 |
71.5 |
51.8 |
37.2 |
27.1 |
20.3 |
|
1995 |
88.7 |
81.8 |
71.6 |
47.9 |
33.6 |
32.9 |
20.0 |
|
2001 |
87.3 |
82.7 |
71.3 |
54.1 |
38.7 |
37.9 |
24.5 |
|
aBased on adjusted U.S. Bureau of the Census labor force participation data. The adjustment is based on the ratio of CPS figures and U.S Decennial Census figures in 1970. SOURCE: Labor force participation figures for 1970–2001 are authors’ calculations using March CPS Annual Demographic files. |
|||||||
plans and Social Security benefits allowed an increasing share of American workers to have financial resources available during a significant period of retirement at the end of their lives. By 1960, over one-half of men aged 66 were out of the labor force, and by 1970 the typical retirement age had fallen to 65. At that time, however, over one-fourth of older adults were also living in poverty (see Table 2-3; Table A-2 in Appendix A presents additional data for persons who work, persons who do not work, and
TABLE 2-3 Poverty Rate of Older Americans by Age Group, 1970–2000
|
|
Age Group |
|||||||
|
Year |
45–49 |
50–54 |
55–59 |
60–64 |
65–69 |
70–74 |
75–79 |
80+ |
|
1970 |
6.6 |
7.6 |
9.5 |
13.6 |
19.1 |
23.7 |
29.0 |
31.1 |
|
1975 |
7.1 |
7.4 |
9.0 |
11.5 |
12.5 |
14.4 |
16.4 |
21.5 |
|
1980 |
7.3 |
8.2 |
8.7 |
10.4 |
12.0 |
14.4 |
17.8 |
22.5 |
|
1985 |
8.3 |
8.5 |
9.8 |
11.3 |
9.4 |
12.1 |
14.8 |
17.3 |
|
1990 |
7.3 |
8.4 |
9.0 |
10.3 |
8.4 |
11.3 |
13.3 |
18.6 |
|
1995 |
7.3 |
8.5 |
10.3 |
10.2 |
8.1 |
9.2 |
10.9 |
15.1 |
|
2000 |
6.2 |
6.7 |
8.8 |
10.2 |
8.3 |
9.6 |
10.8 |
12.5 |
percentage of age group at work). Over the next 15 years, labor force participation rates continued to fall, and by 1985 typical male retirement had dropped to age 62. What was notable about this period of rapid decline in the labor force participation rates of older men is that it came at a time when the poverty rate of older Americans was also dropping (see Table 2-3). On average, then, this generation of older men was able to both reduce its labor force participation and its risk of falling into poverty over its increasing years in retirement, in large part related to the rapid increase in the value of private pensions and social security benefits. (See Burkhauser et al., in press, for a discussion of the changes in the economic well-being of older persons over this period.)
The decline in labor force participation rates of older men over the post–World War II years was not confined to the United States. As documented by Gruber and Wise (1999) and most recently by the National Research Council (2001), the decline in the labor force participation of men since World War II occurred at various rates for most Organisation for Economic Co-operation and Development (OECD) countries. In many European countries this decline has been more rapid, and their typical retirement age has fallen below that for the United States.
A National Research Council report (2001:66) argues that while social norms and the reduced demand for the labor of older men have played roles in this decline across countries, “changes in retirement patterns also depend heavily on the precise form of early retirement provisions in pension and social security plans, as well as on the structure of income support and welfare programs for older individuals” (see also Burtless and Moffitt, 1984; Quinn, Burkhauser, and Myers, 1990; Gruber and Wise, 1999). Clark, York, and Anker (1999) found that rising income and the growth of social security programs have also reduced male labor force participation rates in many developing countries.
The National Research Council (2001) report also argues that changing population age structures are compelling many national governments to create or revamp policies and programs that have encouraged early retirement. The report states: “The increasing financial pressure faced by public pension systems around the world is often attributed to demographic trends that have led to an aging population. But decreasing labor force participation rates for a given age structure also contribute to financial imbalances within pension programs, further increasing the number of retired persons relative to those in the workforce” (p. 8).
In the United States, major social security reforms in 1983 led to an immediate increase in payroll taxes; gradual increases in yearly benefits for those who postponed acceptance of benefits past age 65 to offset the loss in the lifetime value of social security benefits caused by such a postponement; a gradual increase in the age of eligibility for full social security retirement
benefits from age 65 to age 67; and—beginning in 2000—a reduction in the benefits of those who began to take benefits at age 62. A new round of concerns over the long-term financial stability of the Social Security system has led to discussions of further increases in the early and full retirement ages as well as reductions in future benefits increases (see, for instance, Social Security Advisory Council Technical Report, 1997).
One of the six major recommendations of the National Research Council (2001:4) report was “to encourage longitudinal research to disentangle and illuminate the complex interrelationship among work, health, economic status, and family structure” in order to inform governments of the consequences of public policy on the timing of retirement.
However, Table 2-2 suggests that the downward trend in labor force participation rates of U.S. men aged 62 and over ended in the mid-1980s. The labor force participation rates of men at most single ages above age 62 rebounded from their mid-1980s troughs. Quinn (2002) uses these data from the CPS to show that had the trend in early retirement over the period 1964 through 1985, which reduced the labor force participation rates of 60- to 64-year-olds by almost one-third (from 79 to 56 percent), continued at that same rate until 2001, labor force participation rates for men this age would have been dramatically below their actual levels, which are in fact higher than they were in 1985.
Post–World War II trends in the labor force participation rates of women have been quite different from those of men. Since World War II, more and more women have entered the labor force, and they have spent a considerably greater amount of their lifetimes in paid employment. As their work histories have become more like those of men, they have been affected by the same social structures—private and social security pensions plans—that have influenced the labor force participation of men.
As can be seen in Table 2-4, in 1970 the labor force participation rates of women were substantially below those of men at ages below the typical retirement age (Table A-3 in Appendix A expands Table 2-4 to include additional years and ages). For instance, only 49.4 percent of women aged 50 were in the labor force compared to 93.4 percent of males. But the labor force participation rates of younger women have increased dramatically since then. Thus, by 1995 over three-quarters of women aged 50 were in the labor force. Their labor force participation rate was 78.0 percent in 2000 compared to 88.7 percent of males. Like that of men, the labor force participation rate of women declines with age in cross-sectional data, but the increased percentage of women who were working as they approached the normal retirement age offset this decline in labor force participation with age in the 1970s and early 1980s. Hence, as Table 2-4 shows, the labor force participation rates of women aged 62 (the earliest age of eligibility for social security benefits) and older were relatively flat over this period.
TABLE 2-4 U.S. Labor Force Participation Rates of Women by Age, 1970–2001
|
|
Age |
||||||
|
Year |
50 |
55 |
60 |
62 |
65 |
66 |
70 |
|
1970 |
49.4 |
47.7 |
40.3 |
34.0 |
20.2 |
18.7 |
9.8 |
|
1975 |
57.4 |
52.3 |
42.3 |
36.2 |
20.9 |
14.7 |
10.0 |
|
1980 |
59.1 |
52.8 |
40.4 |
31.2 |
19.7 |
17.8 |
10.2 |
|
1985 |
63.3 |
59.7 |
41.5 |
32.7 |
16.1 |
14.3 |
8.3 |
|
1990 |
68.3 |
61.0 |
44.6 |
34.2 |
22.3 |
20.0 |
14.0 |
|
1995 |
75.2 |
62.5 |
47.2 |
38.4 |
22.3 |
19.2 |
10.5 |
|
2001 |
77.1 |
67.4 |
52.5 |
41.3 |
25.5 |
21.2 |
14.2 |
|
SOURCE: Labor force participation figures for 1970–2001 are authors’ calculations using March CPS Annual Demographic files. |
|||||||
But as Table 2-4 also shows, after 1985 the labor force participation rates of older women had substantially increased. Quinn (2002) uses these data to show that, as was the case for men, labor force participation trend lines based on data before 1985 dramatically underestimate the labor force participation rates of older women between 1985 and 2001.
The reasons for this substantial change in the labor force participation rate trends of men and women since the mid-1980s are not fully understood. As noted by the National Research Council (2001) report, structural changes in the social security system put in place in the 1980s, the banning of mandatory retirement rules, and the shift from defined benefit to defined contribution retirement plans should all have increased the incentives to work at older ages in the United States over this period (Quinn et al., 1990; Bass, Quinn, and Burkhauser, 1995; Ghent, Allen, and Clark, 2002).
It also appears that older Americans are living longer and healthier. While there is no question that mortality rates at all ages are declining (National Research Council, 2001), some controversy remains about trends in the functional capacity of older workers. Manton, Corder, and Stallard, (1997) report declines in the trends in chronic disabilities among those over age 65 between 1982 and 1994. Crimmins, Reynolds, and Saito (1999) found significant improvements between 1982 and 1993 in the self-reported ability of men and women in their 60s to work. Improvement was noted by race and educational level, but level of self-reported health was lower to start for African Americans and those of lower educational attainment. It is still not clear whether these results gathered with cross-sectional data over relatively short time periods are part of a longer trend.
An alternative hypothesis is that the end of the decline in labor force participation rates of men since 1985 is simply a business cycle effect, and that the strong economy since the recession of 1992 explains most of the gains in the employment and labor force participation of older men and women over the period. There is substantial evidence that business cycles play an important role in the labor force participation of both men and women. Certainly overall employment rates rise and unemployment rates decline during business expansions, and the reverse occurs over business contractions. It is likely that older workers who have some alternative sources of income, if they are eligible for private pension plans prior to age 62 and for social security benefits after age 62, have a much greater choice than younger workers with respect to their decision to stay in the labor force in the face of a job loss. But the United States has experienced two complete business cycles over the 1980s and 1990s, and as we show below, the survival rates of older workers (the age-specific employment rates of workers who were working at age 50 at subsequent ages) did not decline in the 1990s when compared to the 1980s across the entire business cycle. In fact, survival rates appear to have slightly increased in the 1990s compared to the 1980s at most older ages.
Labor Market Exit Rates in the 1980s and 1990s
The business cycle of the 1980s began with a business cycle peak in 1979. The low point of the subsequent recession was 1982. The economy then grew continuously throughout the rest of the decade, peaking in 1989. The business cycle of the 1990s began with the peak year of 1989. The trough year was 1992. Continuous economic growth then occurred through the year 2000. Table 2-5 looks more closely at the transitions of older men and women out of work over the course of these two business cycles. It focuses on older Americans who work for others. Self-employed workers (about 9 percent of all adults who work and about 25 percent of those over age 65 who work; Bregger, 1996) are not included in the analysis.
Because the CPS surveys a subsample of its respondents in two consecutive March surveys, it is possible to follow the employment of this subsample over two years. This allows us to estimate age-specific employment exit rates for men aged 50 to 70 during these two business cycles. Table 2-5 reports the probability of men and women exiting the labor market at various ages. More formally, we use a Kaplan-Meier life table measure to look at the percentage of men and women who worked for at least 1,000 hours for someone else in year (t) who worked for no more than 100 hours in the next year (t+1) to estimate age-specific employment exit rates. We pool these workers over all pairs of years between 1981 and 2000 and then for 1981 to 1989 and for 1990 to 2000. This pooling technique provides
TABLE 2-5 Age-Specific Exit Rates from Employment for Men and Women Aged 50–70
|
|
Men |
Women |
|||||
|
Age |
1981–2000 |
1981–1989 |
1990–2000 |
1981–2000 |
1981–1989 |
1990–2000 |
|
|
50 |
1.81 |
1.74 |
1.86 |
2.91 |
3.22 |
2.73 |
|
|
51 |
2.09 |
2.26 |
1.96 |
3.00 |
2.81 |
3.11 |
|
|
52 |
1.97 |
2.26 |
1.74 |
4.16 |
4.40 |
4.01 |
|
|
53 |
2.10 |
2.27 |
1.96 |
3.20 |
3.05 |
3.29 |
|
|
54 |
2.27 |
2.29 |
2.26 |
3.97 |
4.35 |
3.69 |
|
|
55 |
4.29 |
4.39 |
4.21 |
5.36 |
6.21 |
4.71 |
|
|
56 |
4.24 |
3.45 |
5.01 |
4.90 |
4.36 |
5.32 |
|
|
57 |
3.67 |
3.56 |
3.78 |
5.44 |
6.02 |
4.98 |
|
|
58 |
4.29 |
4.09 |
4.50 |
6.02 |
6.07 |
5.97 |
|
|
59 |
5.55 |
5.03 |
6.08 |
6.31 |
5.57 |
7.02 |
|
|
60 |
7.28 |
8.63 |
5.90 |
6.52 |
5.65 |
7.32 |
|
|
61 |
9.39 |
9.64 |
9.16 |
8.96 |
8.42 |
9.40 |
|
|
62 |
17.80 |
16.61 |
19.04 |
14.29 |
14.12 |
14.44 |
|
|
63 |
12.59 |
11.98 |
13.21 |
12.15 |
11.57 |
12.68 |
|
|
64 |
16.19 |
17.69 |
14.60 |
13.82 |
13.57 |
14.04 |
|
|
65 |
21.22 |
25.26 |
17.66 |
20.57 |
19.16 |
21.83 |
|
|
66 |
18.37 |
21.07 |
15.90 |
15.29 |
14.29 |
16.01 |
|
|
67 |
14.76 |
17.12 |
12.74 |
13.96 |
12.63 |
14.96 |
|
|
68 |
18.18 |
20.77 |
15.71 |
14.58 |
14.47 |
14.67 |
|
|
69 |
14.09 |
18.33 |
9.89 |
16.83 |
19.13 |
15.43 |
|
|
70 |
17.87 |
17.80 |
17.92 |
19.66 |
19.39 |
19.85 |
|
|
NOTE: Age and exit rate are based on year of exit (t+1) where an exit is defined as the percentage of workers who were employed for 1,000 hours or more in year (t) who are now employed for 100 or less hours. SOURCE: Current Population Surveys 1981–2001. |
|||||||
greater sample size so that we can more precisely measure age-specific exit rates, but it also means that the resulting rates are a mixture of age effects and period effects.
Over the entire period (1981–2000), yearlong exits (less than 100 hours of work over the year) from employment are relatively rare for men before age 55—only about 2 percent of these younger men exit employment at each age. Yearlong exits between ages 55 and 59 increase to about twice that rate. They rise a bit more at ages 60 and 61. However, the exit rates are much higher thereafter but with two spikes. The first is at age 62, the earliest age of eligibility for social security retirement benefits. The second is at age 65, the age of eligibility for full social security benefits over this period.
Once we subdivide our sample to capture two different business cycles (1981–1989) and (1990–2000), we see that for men there has been a substantial change in the age-specific exit rates over the two periods. In the 1980s, the highest spike in exit rates was at age 65 with a somewhat smaller spike at age 62. In the 1990s the highest spike was at age 62. The exit rate at 65 is lower and not much different from the rates of its nearest age neighbors.
These exit rate patterns suggest that something different occurred in the 1990s with respect to men’s age-specific exits. One possibility is the change in social security rules, fully phased in over the 1990s. The new rules no longer punish workers who postpone acceptance of social security benefits past age 65, as Social Security rules did in the 1980s. Another is the shift from defined-benefit to defined-contribution pensions for workers of these ages. This shift has reduced the retirement incentives that were contained in the eligibility rules of defined benefit pension plans (see Quinn et al., 1990, and Burtless and Moffit, 2001, for a discussion of the influence of defined pension plans on retirement age). Table 2-5 also shows, using the pooled 1981–2000 data, that women had similar age-specific exit rate patterns as those of men, but women’s exit rates are somewhat higher than men’s at younger ages (50–59) and somewhat lower thereafter. Women’s peak exit rate years, however, are the same as those of men—ages 62 and 65. However, unlike men, women’s exit rate spike at age 65 did not disappear in the 1990s.
Table 2-6 uses the exit rates from Table 2-5 to simulate the employment survival rate of men and women who were employed at age 50 in the 1981–2000 period, the 1981–1990 period, and the 1990–2000 period, as well as predicted employment rate of men and women at each age in these periods, assuming that no one who exits the labor force ever returns. The survival rates are simulated by following men and women who were employed at age 50 for the period of interest and then assuming that their probability of leaving employment at each age is the average exit rate for the period of interest. These survival rates simulate, for instance, that of the men who were employed for over 1,000 hours at age 50 over the 1981–2000 period, 88 percent would still be employed at least for 100 hours per year at age 55. The fraction employed would fall to 62 percent at age 61, and to 51 percent at age 62. High exit rates thereafter cut employment to 29 percent at age 65 and 12 percent at age 70. These rates blend the generally higher exit rates of the 1980s with the lower rates of the 1990s, especially past age 64. The survival rates are slightly higher in the 1990s, reflecting the lower exit rates over the period. The survival functions are lower for women at every age compared to men, but they are also slightly higher in the 1990s than in the 1980s.
TABLE 2-6 Age-Specific Employment Survival Functions and Employment Rates for Men and Women Employed at Age 50
|
|
Men |
|||||
|
|
1981–2000 |
1981–1989 |
1990–2000 |
|||
|
Age |
Survival Functiona |
Rateb |
Survival Functiona |
Rateb |
Survival Functiona |
Rateb |
|
50 |
1.00 |
86.72 |
1.00 |
88.41 |
1.00 |
85.54 |
|
51 |
0.98 |
84.91 |
0.98 |
86.41 |
0.98 |
83.86 |
|
52 |
0.96 |
83.23 |
0.96 |
84.45 |
0.96 |
82.40 |
|
53 |
0.94 |
81.49 |
0.93 |
82.53 |
0.94 |
80.79 |
|
54 |
0.92 |
79.64 |
0.91 |
80.65 |
0.92 |
78.96 |
|
55 |
0.88 |
76.22 |
0.87 |
77.10 |
0.88 |
75.64 |
|
56 |
0.84 |
72.98 |
0.84 |
74.44 |
0.84 |
71.85 |
|
57 |
0.81 |
70.30 |
0.81 |
71.79 |
0.81 |
69.13 |
|
58 |
0.78 |
67.29 |
0.78 |
68.86 |
0.77 |
66.02 |
|
59 |
0.73 |
63.55 |
0.74 |
65.39 |
0.72 |
62.01 |
|
60 |
0.68 |
58.93 |
0.68 |
59.75 |
0.68 |
58.35 |
|
61 |
0.62 |
53.40 |
0.61 |
53.99 |
0.62 |
53.01 |
|
62 |
0.51 |
43.89 |
0.51 |
45.02 |
0.50 |
42.92 |
|
63 |
0.44 |
38.36 |
0.45 |
39.63 |
0.44 |
37.25 |
|
64 |
0.37 |
32.15 |
0.37 |
32.62 |
0.37 |
31.81 |
|
65 |
0.29 |
25.33 |
0.28 |
24.38 |
0.31 |
26.19 |
|
66 |
0.24 |
20.68 |
0.22 |
19.24 |
0.26 |
22.03 |
|
67 |
0.20 |
17.62 |
0.18 |
15.95 |
0.22 |
19.22 |
|
68 |
0.17 |
14.42 |
0.14 |
12.64 |
0.19 |
16.20 |
|
69 |
0.14 |
12.39 |
0.12 |
10.32 |
0.17 |
14.60 |
|
70 |
0.12 |
10.17 |
0.10 |
8.48 |
0.14 |
11.98 |
|
aAge-specific employment survival function is simulated based on exit rates in Table 2-5. It is the percentage of the workers age 50 who continued to be employed at subsequent ages. bBased on estimated exit rates for those who were working at age 50. The employment rate at age 50 is the actual rate. SOURCE: Current Population Surveys 1981–2001. |
||||||
Our discussion of Tables 2-5 and 2-6 focuses on exit from employment. At older ages the difference between labor force participation outcomes and employment outcomes are small because the unemployment rate of older workers is very low. Most older workers who face significant spells of unemployment are likely to leave the labor force. Hence our definition of employment exit—not working for at least 100 hours in a given year—is likely to be very close to a definition of exit from the labor force.
|
Women |
|||||
|
1981–2000 |
1981–1989 |
1990–2000 |
|||
|
Survival Functiona |
Rateb |
Survival Functiona |
Rateb |
Survival Functiona |
Rateb |
|
1.00 |
62.53 |
1.00 |
55.09 |
1.00 |
68.06 |
|
0.97 |
60.65 |
0.97 |
53.54 |
0.97 |
65.94 |
|
0.93 |
58.13 |
0.93 |
51.19 |
0.93 |
63.30 |
|
0.90 |
56.27 |
0.90 |
49.63 |
0.90 |
61.21 |
|
0.86 |
54.04 |
0.86 |
47.47 |
0.87 |
58.96 |
|
0.82 |
51.15 |
0.81 |
44.52 |
0.83 |
56.18 |
|
0.78 |
48.64 |
0.77 |
42.58 |
0.78 |
53.19 |
|
0.74 |
46.00 |
0.73 |
40.02 |
0.74 |
50.54 |
|
0.69 |
43.23 |
0.68 |
37.59 |
0.70 |
47.52 |
|
0.65 |
40.50 |
0.64 |
35.50 |
0.65 |
44.19 |
|
0.61 |
37.86 |
0.61 |
33.49 |
0.60 |
40.95 |
|
0.55 |
34.47 |
0.56 |
30.67 |
0.55 |
37.11 |
|
0.47 |
29.54 |
0.48 |
26.34 |
0.47 |
31.75 |
|
0.42 |
25.95 |
0.42 |
23.30 |
0.41 |
27.72 |
|
0.36 |
22.37 |
0.37 |
20.13 |
0.35 |
23.83 |
|
0.28 |
17.77 |
0.30 |
16.28 |
0.27 |
18.63 |
|
0.24 |
15.05 |
0.25 |
13.95 |
0.23 |
15.65 |
|
0.21 |
12.95 |
0.22 |
12.19 |
0.20 |
13.30 |
|
0.18 |
11.06 |
0.19 |
10.42 |
0.17 |
11.35 |
|
0.15 |
9.20 |
0.15 |
8.43 |
0.14 |
9.60 |
|
0.12 |
7.39 |
0.12 |
6.80 |
0.11 |
7.70 |
Differences in Outcomes by Employment, Ethnicity, and Education
Tables 2-5 and 2-6 assume no differences in exit rates within individual ages groups. However, exit rates vary widely in different industries and occupations. Figures 2-2 and 2-3 present simulated employment survival rates and employment rates of men and women, respectively, across industries for various ages. Table B-1 in Appendix B presents the data upon
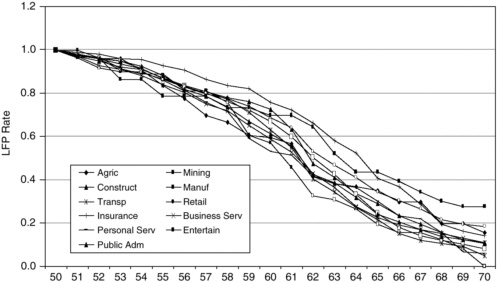
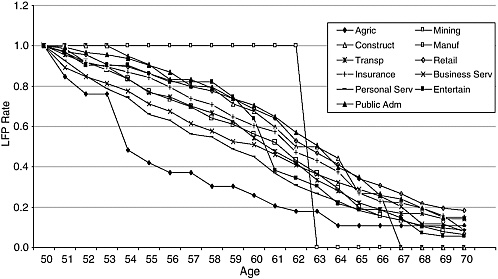
which the figures are based. Survival functions vary dramatically across industry. The average male working at age 50 in mining has a 45.6 percent chance of working at age 61. In contrast, the chance that the average worker, aged 50, in the insurance and real estate, banking, and other financial services industries is still working is 72.5 percent at age 61. By age 66 the implied employment rates are 15.5 percent and 36.9 percent, respectively. The chances of employment survival in the other industries fall somewhere in between. Similar differences are also shown for women.
Clearly there is an important correlation between the kind of industry at which one works and the speed at which one exits employment. But whether this difference is caused by the compensation package one receives in that industry (wages and salary, health benefits, pension plan), the demands of the job (e.g., level of cognitive skills or physical capacity required, the extent to which interactions with other workers and customers is critical to performance, worker control, range and breadth of tasks, etc.), the risks of the job to one’s health and safety, and whether this is a contingent job cannot be determined with these data. Nor do the tables that we present confirm with certainty that changes in pension rules or social security rules are the driving force behind the ending of the decline in the labor force participation of older workers. Rather, these tables suggest that, on average, exit rates increase with age but that the resulting decline in employment varies tremendously across industry and, as we discuss below, across other individual dimensions.
Table B-2 in Appendix B repeats this exercise to show differences in work exit rates by occupation. We divide workers into white-collar, blue-collar, and service occupations separately for men and women. The variation across occupations is also substantial with, for instance 66.2 percent of white-collar male workers at age 50 still in the labor force at age 61, and 57.9 percent of blue-collar workers still employed at age 61. By age 66 the implied employment rates are 30.1 and 17.9 percent, respectively.
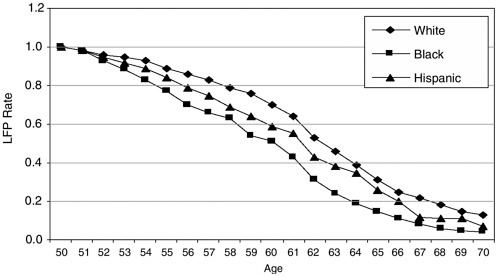
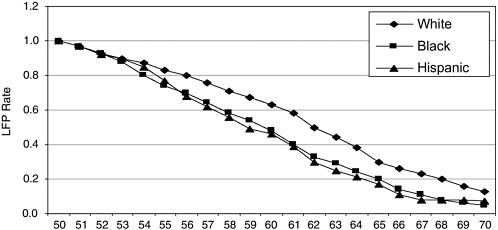
Table B-3 in Appendix B repeats this exercise by race. Figures 2-4 and 2-5 summarize the data for men and women, respectively. At age 61, 64 percent of white men who were working at age 50 are still working. For Hispanic men the chance of still working is 55 percent. For African American men it is 43 percent. The implied employment rates are 25, 20, and 11 percent, respectively, at age 66.
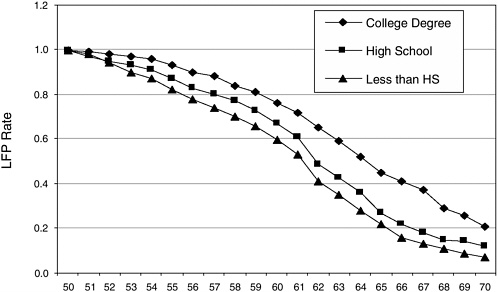
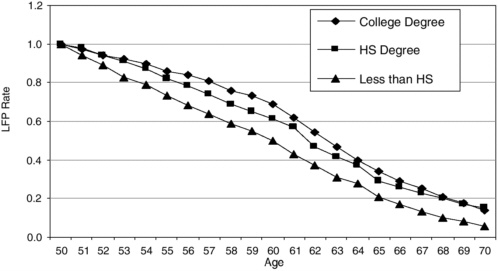
Figures 2-6 and 2-7 show differences in exit rates by education level for men and women, respectively. Table B-4 in Appendix B presents the data upon which the figures are based. At age 61, 72 percent of college or more highly educated men who were working at age 50 are still employed compared to 61 percent of high school graduates and 53 percent of those with less than a high school degree. At age 66 the implied employment rates are 41, 22, and 16 percent, respectively.
The long expansion of the last decade of the 20th century is over, and a new business cycle has begun. At this point it is not clear how long the current downturn in the economy will last and how it will affect in the long-run employment of older workers. As Table 2-2 shows, the labor force participation rates of older men fell between 2000 and 2001; it is likely that they will continue to fall as the economy declines. While the declines thus far do not signal a return to pre-1985 trends, an important topic of future research will be how the employment of older workers changes over the current business cycle.
Need for Better Data
Tables 2-2 through 2-5 confirm that the decades-long decline in the labor force participation of older males has ended and the labor force participation rates of older females has substantially increased, at least over the 1990s business cycle. It is possible that this shift in work outcomes was partly caused by changes in the work incentives of our private pension and social security systems advocated by those who have suggested that such changes are necessary to preserve the financial integrity of these systems.
The tremendous differences in employment survival rates among people with different socioeconomic characteristics and who work in different industries and occupations are to some extent explained by differences in the retirement and other compensation packages provided to workers in these industries and occupations.
The National Research Council (2001) emphasized the importance of gathering information on these financial incentives so that researchers can provide policy makers with the information necessary to develop future evidenced-based employment and retirement public policies. This report singles out the Health and Retirement Study as an example of the type of multidisciplinary-based longitudinal data; linking these detailed financial aspects of jobs with a core set of social, economic, and health variables on workers and their families is necessary to provide needed data.
In addition to the detailed information that longitudinal surveys like the Health and Retirement Study have gathered on employment compensation in the form of wages, health coverage, and retirement pension rules, other aspects of the job should also be considered in detail. As we will discuss in subsequent chapters, there are significant differences in job demands that may differentially affect older workers as well as differences in the risks of accident or toxic exposure they may face. These job characteristics can have effects both on the health of older workers and on their retirement decisions.
As the U.S. government shifts Social Security policy to encourage greater employment at older ages, the consequences of this shift must be monitored
across the diverse population of older workers it will affect. For instance, workers who would have been expected to leave the job under the old Social Security rules may now find it much less economically advantageous to do so. It is important to know if these changes in social policy, which encourage longer stays in the workforce, will have differential effects on the health of workers, especially on economically disadvantaged populations of workers and those in riskier or more demanding jobs. These questions can only be answered by more detailed information on the characteristics of the job (e.g., health and safety risks) linked to the powerful longitudinal data contained in datasets like the Health and Retirement Study.
Older-Worker-Intensive Industries and Occupations
We can expect to see differences in the distribution of older workers among the various industries and occupations in which they are employed. Determining which industries or occupations have the largest representation of older workers, however, depends on the way the question is asked. The actual count of older workers by industry or occupation allows a comparison of the sizes of the older workforces, male and female, across industries or occupations. Three proportional distributions add further information: We could be interested in (1) the overall proportion of older workers in the workforce who are employed in each industry or occupation; (2) the proportion of all older workers in the workforce who are employed in each industry or occupation; or (3) the proportion of the workforce in a specific industry or occupation who are older workers. The first proportion provides an indicator of the interaction between the size of the workforce of a given industry and the percentage of the workforce in that industry that are older workers. The second proportion allows a comparison across industries of what proportion of the older employed workforce are working in each industry. The third proportion allows a comparison across industries of the proportion of workers, male and female, who are older.
A separate question concerns projections of future trends. These projections include rate of growth or decline in employment predicted for industries, as well as projections of the numbers of older workers and their allocations to industries.
Older-Worker-Intensive Industries
Number of older workers. In which industrial categories are the greatest number of older workers employed, and which, therefore, employ the greatest percentage of older workers? The Current Population Survey (CPS) provides data on the employed population at any point in time. Table 2-7
uses data from the CPS for March 2001 to present overall employment by major industry category along with the total employment levels for workers age 45 and older stratified by sex. The greatest number of older workers are employed in manufacturing, retail, educational services, and finance/insurance/real estate services. When examined by sex, the same four industrial categories employ the greatest number of female older workers. For men, construction ranks third, and transportation and business services categories share fourth ranking, replacing educational services and financial/insurance/real estate services.
Proportionate distribution of older workers. What proportion of workers within a given industry are older workers? Proportional employment data
TABLE 2-7 Distribution of Older Workers Across Major Industrial Categories
|
|
Employed Workers Age 16 and Older |
Employed Workers Age 45 and Older |
|||
|
Industry |
Totala |
Percent |
Totala |
Femalea |
Malea |
|
Agriculture |
2,940 |
2.2 |
1,230 |
340 |
890 |
|
Forest and fisheries |
120 |
0.1 |
60 |
20 |
40 |
|
Mining |
540 |
0.4 |
240 |
40 |
200 |
|
Construction |
8,830 |
6.5 |
2,810 |
360 |
2,460 |
|
Manufacturing |
19,570 |
14.5 |
7,650 |
2,540 |
5,120 |
|
Transportation |
6,190 |
4.6 |
2,420 |
550 |
1,870 |
|
Communications |
2,070 |
1.5 |
630 |
270 |
360 |
|
Utilities |
1,420 |
1.0 |
590 |
110 |
480 |
|
Wholesale trade |
5,240 |
3.9 |
1,910 |
570 |
1,350 |
|
Retail trade |
22,220 |
16.4 |
5,770 |
2,980 |
2,800 |
|
Finance/insurance/realty |
9,020 |
6.7 |
3,370 |
1,870 |
1,500 |
|
Personal services |
910 |
0.7 |
340 |
320 |
020 |
|
Business, auto services |
9,850 |
7.3 |
2,940 |
1,100 |
1,840 |
|
Other personal services |
3,600 |
2.9 |
1,280 |
840 |
440 |
|
Entertainment |
2,490 |
1.8 |
690 |
280 |
400 |
|
Hospital services |
5,330 |
3.9 |
1,950 |
1,500 |
450 |
|
Other medical services |
6,590 |
4.9 |
2,530 |
1,870 |
650 |
|
Educational services |
11,870 |
8.8 |
5,510 |
3,850 |
660 |
|
Social services |
3,550 |
2.6 |
1,290 |
1,000 |
290 |
|
Other professional service |
6,510 |
4.8 |
2,750 |
1,280 |
470 |
|
Public administration |
6,050 |
4.5 |
2,840 |
1,300 |
1,540 |
|
aNumbers in thousands. SOURCE: CPS March 2001. |
|||||
for workers over age 45 in 2001 are provided in Table A-4 in Appendix A, stratified by major industrial category, using the same CPS survey data for March 2001. The table includes the percentage of all employed persons who are older workers employed in the industry, the percentage of all older workers employed in the given industry, and the percentage of all workers in a given industry who are older workers.
A somewhat different picture is presented when the proportional distribution of older workers is examined. Of the four largest industrial categories by numbers employed, only educational services holds a rank amidst the four categories with the largest proportion of older workers overall. The three other top ranks by proportion are forestry/fishing/trapping, public administration, and mining. Greater differences in distribution by sex are seen in these proportional distributions. The four highest for women are all service industries: personal services, educational services, other medical services, and social services—although only educational services was among the highest overall. By contrast, for males the dominant industries were primarily physically demanding ones: mining, utilities, forestry/fishing/ trapping, communications, and agriculture.
Determining older-worker-intensive industries, then, is predicated on the question asked and whether gender is of interest. In addition, the industrial categories examined here are at the level of major categories; there may be differences (which should be researched to determine whether within-industry variance exceeds between-industry variance) at more detailed levels within categories.
Anticipated changes in employment for older workers. When examining older-worker-intensive industries, an important question concerns projections of future trends. Bureau of Labor Statistics projections are used to assess the likely trends in employment distributions in the future. These projections include rate of growth or decline in employment predicted for industries. The rates of change in employment projected for each industrial category through 2010 (see Berman, 2001) suggest the following:
-
Of the industries with high current numbers of older workers, none, except business-auto services, rank in the top four in terms of projected employment growth. In addition, of the other three, only educational services has a projected growth rate above the median for industries.
-
Of the industries with a high within-industry percentage of older workers, none ranks in the top four in terms of employment growth. Declines in employment in mining and forestry/fishing/trapping are projected; growth in educational services is projected to be above the median; and growth in public administration is projected to be below the median.
-
The four industrial categories projected to show the greatest growth in employment through 2010 are business-auto services, other personal services, other (not hospital) medical services, and social services. Of these, a relatively high proportion of social service workers and educational service workers are older female workers, while only business-auto services has around the median proportion of older male workers; the rest are lower.
-
The two industrial categories showing projected decline in employment (mining and forestry/fishing/trapping) are older-worker-intensive in that a relatively large percentage of workers in these industries are older workers (mostly males).
Overall, then, it can be predicted that older-worker-intensive industries will experience moderate growth in employment over this decade. On that account, and on account of the predicted growth in the older worker labor force over this period (with shifts also toward a greater percentage of workers being older workers), we can predict that there will be more older workers in the older-worker-intensive industries in 2010, and that (except for mining and forestry/fishing/trapping) there will not likely be dramatic change in employment in industries that are older-worker intensive.
The industries projected to show highest growth in employment through 2010 are all service industries: business-auto services, personal services, other (not hospital) medical services, and social services. These are, for the most part, not currently older-worker intensive (except social services for older female workers). These will have to be examined carefully in the future to determine whether their growth will prove important with respect to participation of older workers.
Older-Worker-Intensive Occupations
Number of older workers. In which occupational categories are the greatest number of older workers employed, and which, therefore, employ the greatest percentage of older workers? Table 2-8 uses data from the CPS for March 2001 to present overall employment by major occupational category along with the total employment levels for workers age 45 years and older stratified by sex. The four occupational categories with the greatest number of older workers are executive/administrative/managerial; professional specialty; sales; and administrative support. When examined by sex, the first two categories are still the largest for both sexes. Subsequently we see segregation of jobs by sex with the sales category high for males but not females and the administrative support category high for females but not for males. Reflecting similar findings when employment is examined by industry, the fourth important category for males is employment in jobs
TABLE 2-8 Distribution of Older Workers Across Major Occupational Categories
|
|
Employed Workers Age 16 and Older |
Employed Workers Age 45 and Older |
|||
|
Industry |
Totala |
Percent |
Totala |
Femalea |
Malea |
|
Professional specialty |
21,610 |
16.0 |
8,490 |
4,530 |
3,970 |
|
Technicians |
4,490 |
3.3 |
1,410 |
750 |
660 |
|
Sales |
16,090 |
11.9 |
5,480 |
2,550 |
2,930 |
|
Administrative support |
18,890 |
14.0 |
6,970 |
5,630 |
1,340 |
|
Private household service |
820 |
0.06 |
310 |
290 |
20 |
|
Protective service |
2,360 |
1.7 |
790 |
160 |
630 |
|
Other services |
15,270 |
11.3 |
4,400 |
3,010 |
1,390 |
|
Precision production/craft/repair |
14,670 |
10.9 |
5,110 |
500 |
4,610 |
|
Machine operators, assemblers, inspectors |
6,910 |
5.1 |
2,480 |
1,080 |
1,400 |
|
Transportation and material moving |
5,630 |
4.2 |
2,180 |
220 |
1,960 |
|
Handlers, helpers, laborers |
5,220 |
3.9 |
1,190 |
330 |
860 |
|
Farming/forestry/fishing |
3,020 |
2.2 |
1,270 |
300 |
970 |
|
aNumbers in thousands. SOURCE: CPS March 2001. |
|||||
requiring physical skills—production/craft/repair—while the fourth important category for females is service-related-other services.
Proportionate distribution of older workers. What proportion of workers within a given occupation are older workers? Proportional employment data for workers over age 45 in 2001 are provided, stratified by major occupational category, in Table A-5 using the same CPS survey data for March 2001. Table A-5 shows the percentage of all employed persons who are older workers employed in the occupation, the percentage of all older workers employed in the given occupation, and the percentage of all workers in a given occupation who are older workers.
Focusing on the overall older worker population, two of the four proportionately largest occupations for older workers—executive/administrative/managerial and professional specialty categories—are the same that were seen when numbers of older workforce were examined (Table 2-8). The other proportionately large categories are transportation and material moving, and farming/forestry/fishing. Stratified by sex, evidence for occupation segregation is again present—there are no overlapping categories. Females apparently make up an important proportion of one of the four largest occupational groups for older workers—professional specialty—
while the three other proportionately high occupational categories for females are all service-related (administrative support, private household service, and services–other). By contrast, males make up a large part of two different largest occupational groups for older workers: transportation and material moving, and farming/forestry/fishing. The two other highest proportion male occupations are new (precision production/craft/repair and protective services). Only one of the four is a service occupation.
Determining older-worker-intensive occupations is, as with industries, predicated on the question asked and whether gender is of interest, and some patterns emerge. In addition, the occupational categories examined here are broadly defined. There may be differences (which should be researched, particularly to determine the within-occupation variance) at more detailed levels within categories.
Anticipated changes in employment for older workers. Older-worker-intensive occupations can also be examined in terms of projections of future trends. BLS projections of growth or decline in occupational categories have been described by Hecker (2001). Examining the rate of change in employment projected for each occupational category through 2010 suggests the following:
-
Of the occupations highlighted above on the basis of high current numbers of older workers the projected rate of employment growth is high only for professional specialty. The other three occupations have projected growth rates below the median.
-
For the additional occupations highlighted above on the basis of within-occupation percentage of older workers (for older workers overall and for older male workers: transportation and material moving; for older female workers: private household service; and for older male workers: protective services) projected employment growth is among the highest. All but one are service occupations.
-
The occupational categories projected to show the greatest growth in employment through 2010 are protective services, professional specialty, private household services, and other services. Each of these is highlighted as older-worker intensive by one or both of the questions posed above.
Overall, then, it can be predicted that older-worker-intensive occupations will experience high growth in employment over this decade. On that account, and on account of the predicted growth in the older worker labor force over this period (with shifts also toward a greater percentage of workers being older workers), we can predict that there will be more older workers in the older-worker-intensive occupations in 2010.
HEALTH AND JOB CHARACTERISTICS AMONG OLDER WORKERS
It is important to have information on the current job activities of older workers to better understand on a population basis the nature and challenges of their workplaces, as well as worker health and functional status in these work environments. Several important national surveys offer many elements of this information, including databases supported and conducted by federal agencies. However, many focus on specific dimensions of this activity and do not contain information on work status, job characteristics, and health and economic status in the same individuals. One national survey that offers information on many of these domains is the Health and Retirement Study (HRS), an ongoing panel study of approximately 20,000 older Americans (Health and Retirement Study, 2004), sponsored by the U.S. National Institute on Aging. The HRS is a representative sample of the older American population with both telephone and in-person surveys conducted every two years.
The National Health Interview Survey (NHIS) offers some additional information about the age and health characteristics of workers; detailed work characteristics were obtained primarily in the survey supplement obtained in 1988. Since the NHIS survey covers all of the civilian noninstitutionalized population, it provides a somewhat different window through which to observe older workers.
In the following data from the 1998 HRS survey (detailed data are presented in Tables A-6 through A-10 in Appendix A), national prevalence estimates (expressed as percentages) are weighted to reflect oversampling of census tracts containing high minority populations and of the state of Florida; all information is based on self-report. The data show that about 40 percent of persons over 50 years of age are working, ranging from 65.4 percent among those 51–64 years, to 6.6 percent of those 75 years and older. Women over 50 years of age are much less likely to be working than men or to have never worked. Only about 1 percent are either temporarily off work or unemployed and looking for work.
Complementary estimates (Wagener et al., 1997), albeit with a different age distribution, reflecting earlier (1993) NHIS data are that of the overall adult population: 58 percent of women and 76 percent of men were employed at the time of the survey. Among women between the ages of 45 and 64, and age 65 and over, there were 62 percent and 10 percent, respectively, employed. For men the same age groupings had 80 percent and 17 percent, respectively.
The HRS data showing selected work characteristics among older workers indicated that nearly one-fourth were self-employed, and three-fourths were working full time (more than 35 hours per week). About a third had
the ability to reduce their hours at their own discretion. Fewer than 20 percent were in supervisory positions. Considering reported job characteristics and demands reported by current workers, a substantial proportion of the jobs required physical effort, heavy lifting, and kneeling or stooping. Job physical demands were lower for workers at higher ages. Nearly all required good eyesight, intense concentration, and skills for interacting with people. Nearly half reported that the job was more difficult than it used to be, and over half reported a lot of stress. Despite this, nearly 90 percent reported that they enjoyed going to work.
Considering the functional status of current workers over 50 years of age, overall, the rates of reported difficulty with a wide variety of physical functions was relatively low, with rates of difficulty ranging from 2 percent for fine motor functions (e.g., picking up a dime from the table) to 27.3 percent for more gross motor functions (e.g., stooping, crouching, and kneeling). Rates of difficulty generally increased with age and were more prevalent among men than women. While not shown, these rates are somewhat lower than among nonworkers. In general, lower extremity difficulties were more common than upper extremity or fine motor difficulties.
The HRS data also indicated the prevalence rates for reported chronic illnesses or disorders, overall health status, difficulties with activities of daily living, and the presence of health insurance for both workers and nonworkers. With respect to major chronic illnesses or disorders, such as a history of heart attack, stroke, hypertension, diabetes mellitus, chronic lung disease or hip fracture, older workers clearly reported fewer than nonworkers, although two-thirds of the workers report at least one major condition. Overall self-assessed health status was also reported to be much better among workers than nonworkers, although about 15 percent of workers reported their health to be fair or poor. Few reported difficulty with activities of daily living (basic self-care activities such as dressing, bathing, and grooming), although the rates were higher among nonworkers. Nearly 16 percent of workers 51–64 years did not have health insurance, but nearly all of those 65 years and above did report insurance, largely because of Medicare coverage.
Overall self-reported health status of currently employed individuals is also provided by Wagener et al. (1997), who indicate that older women who are currently employed are more likely to report being in better health than males of equivalent ages.
The 1988 NHIS survey also collected details of work-related symptoms or disorders. Work-related back pain due to accidents was not common and was twice as likely to occur in men (4.4 percent of women and 9.2 percent of men) while work-related back pain attributed to repeated activities was much more common (20 percent of women and 28 percent of men). The prevalence of neither self-reported condition varied substantially
by age. Those 65 or older, however, did have lower prevalence of work-related back pain due to repeated activities (Wagener et al., 1997). Job change, altered job activities, or ceasing work due to back pain, regardless of cause, occurred among approximately 20 percent of both women and men. Women were more likely to change jobs or stop working after age 65.
Combining HRS and NHIS data suggests, then, that the majority of Americans 51–65 years in 1998 were still working, although sometimes at a second career. A substantial proportion were continuing to work after conventional retirement ages of 60–65 years. Women were less likely to be working than men, but this may change in subsequent cohorts. Jobs among workers over age 50 were reported to contain many physical and emotional challenges and stresses, but most workers reported that they enjoyed going to work. As expected, older workers as a group were healthier and more functional than their nonworking counterparts, but a majority reported at least one chronic illness or disorder, suggesting that these conditions in general did not substantially interfere with job functions, but they did point to a higher risk of future illness or disorder and disability. About 15 percent of workers reported their health status as being fair or poor, possibly leading to risk of job loss and progression of illness or disorder. About 16 percent of workers 51–65 years reported that they did not have health insurance of any type; over 80 percent were receiving such insurance from their employers. This has implications for access to health services in this age group.