Reopening Public Facilities After a Biological Attack: A Decision Making Framework (2005)
Chapter: Appendix E: Were the 2001 Anthrax Exposures Consistent with Dose-Response: The Case of the AMI Building
Appendix E
Were the 2001 Anthrax Exposures Consistent with Dose–Response: The Case for the AMI Building
Risk assessment methodology can be assessed for validity by examining the predicted illness burden from application of dose-response relationships and estimates of exposure with the observed illness burden. A case in point is the contamination of the American Media, Inc. (AMI), building in Boca Raton, Florida. In that incident, there were 2 known cases of inhalation anthrax.
From the information available, it appears that exposure occurred when an envelope containing Bacillus anthracis spores was opened in the mailroom of the building. The duration of exposure is not known, but is assumed to have been one, 8-hour working shift. Other key parameters that characterize the risk are listed in Table E-1.
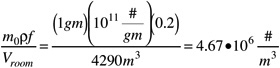
If the anthrax spores were immediately released into the air within the mailroom, then the instantaneous initial concentration would have been as follows:
The ventilation rate in the room (ACH) results in the dilution of the aerosolized spore concentration, as shown diagrammatically in Figure 7-3. Using an exponential dilute-out curve (based on a completely mixed room volume), the 8-hour average concentration is computed to be 8.2•105 #/m3.
TABLE E-1 Point Values of Input Parameters
|
Grams of Spores |
m0 |
1 gm |
Estimated Amount in Single Envelope Released in Mailroom |
|
#/gram |
ρ |
1011 |
Spore without additive would be ca 1012/gram |
|
Fraction aerosolized |
f |
0.2 |
Unknown |
|
Air changes/hour |
ACH |
1 |
Based on common ventilation rates |
|
Inhalation volume |
V |
2.4 m3 |
8 hours exposure at normal adult breathing rate |
|
Dose–response parameter |
k |
7.16•10−6 |
From analysis of the Druett data on monkeys |
|
Volume into which release occurred |
Vroom |
4290 m3 |
Based on floor plans, about 10% of the building volume comprised the mailroom |
|
Individuals exposed |
P |
10 |
Based on 10% of the total estimated number of employees |
When that concentration is multiplied by the inhalation volume for an exposure by an individual worker, the average number of spores inhaled (the dose) is computed as follows:
Using the best estimate for the dose–response relationship (in the exponential dose-response model), the risk (per individual exposed) is computed to be:
This computation suggests that all individuals so exposed should have contracted inhalation anthrax. However, it is obvious that several parameters and assumptions have gone into the production of this point estimate. If the uncertainties in each input were considered, what would be the estimated confidence limit for the number of persons who could have become ill?
There are two approaches to this assessment. In the first approach, all of the point estimates in Table E-1 are used and, in addition, an “effectiveness factor”
TABLE E-2 Input Parameter Distributions
|
Grams of Spores |
m0 |
N(1,0.3) |
|
#/gram |
ρ |
10N(11,0.3) |
|
Fraction aerosolized |
f |
B(5,20) |
|
Air changes/hour |
ACH |
Tr(0.5,1,3) |
|
Inhalation volume |
V |
Tr(2,2.4,3) |
|
Dose-response parameter |
k |
|
|
Volume into which release occurred |
Vroom |
N(4285,1285) |
|
Individuals exposed |
P |
Bin(100,0.1) |
|
N(mu,s): normal distribution with mean=mu, standard deviation=s B(a,b): beta distribution with parameters a and b (mean = a/(a+b) ) Tr(L,M,U): triangular distribution with minimum=L, mode=M, maximum=U Bin(N,p): Binomial distribution with total N and “success” probability p (mean=Np) |
||
for the inhaled anthrax spores is assumed, such that the dose–response equation becomes modified to yield (for the individual risk) the following:
where η is the effectiveness (which may be regarded as the apparent potency of the spores from the AMI building relative to those used in the animal infectivity trials). It can then be asked what would be the value of η be if the dose (d) and dose–response parameter (k) remained as above, and the predicted risk were such to produce 2 cases in the 10 individuals exposed (i.e., a risk per individual of 0.2)? If the effectiveness were 0.016, then the estimated and observed risk would be equal: The potency of the AMI spore preparation may have been 1.6% of that used in the monkey experiments.
Another approach would be to posit distributions for each of the key inputs. There are few exact data on which to ground these distributions, and hence the subsequent calculation should be considered illustrative, but it should serve to motivate a better estimate of the input assumptions and their distributions.
Table E-2 provides distributions for each of the inputs used in an overall assessment of uncertainty of risk.
Using these input distributions, the distribution of predicted cases can be computed using a Monte Carlo simulation. The cumulative distribution of predicted cases is shown in Figure E-1. Although the observed number of cases (2) is below the mean and the median number of cases that would have been estimated to occur, there is nonetheless (given the uncertainty in the inputs) the potential for this low number of cases to have occurred. Further refinement of the inputs (Table E-2) would enable one to determine how unusually low the observed number of cases might have been.
As part of the Monte Carlo run, a sensitivity analysis can be conducted in which the correlation between each of the inputs (considered separately) and the output (# of cases) is examined. The results are shown in Figure E-2. It is apparent that the two most important drivers of the risk are the number of individuals exposed and the dose–response parameter (lnk - the natural logarithm of the dose response parameter, k). This sensitivity analysis can be useful in assessing how resources should be deployed in any further exploration of the problem.
This analysis suggests that the quantitative microbial risk assessment approach is plausibly supported by the AMI incident. Clearly, there are significant
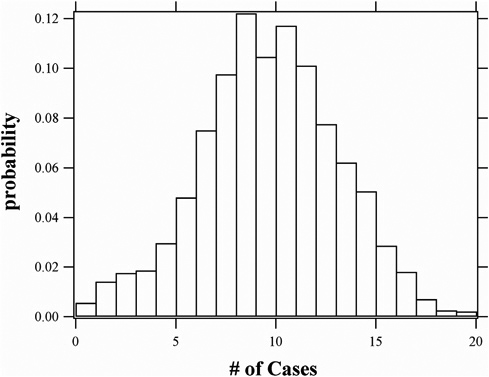
FIGURE E-1 Histogram of predicted number of cases.
FIGURE E-2 Sensitivity analysis of inputs.
uncertainties. Some of these relate to the need to better quantify the exposures (persons at risk, spore density, aerosolization fraction); however, others clearly relate to the intrinsic properties of the agent(s) themselves (i.e., the dose-response parameter). Hence, it would be useful to develop a better understanding of the dose–response relationships for potential bioterrorist agents, and their associated uncertainties and variabilities.


