Toward Sustainable Agricultural Systems in the 21st Century (2010)
Chapter: 2 A Pivotal Time in Agriculture
2
A Pivotal Time in Agriculture
Modern agriculture, U.S. agriculture in particular, has had an impressive history of productivity (Gardner, 2002) that has resulted in relatively affordable food, feed, and fiber for domestic purposes, accompanied by substantial growth in agricultural exports. The population of the United States grew from 75 million in 1900 to 307 million in 2009 (U.S. Census Bureau, 2009). In 2008, agricultural exports reached a record $115 billion (USDA-ERS, 2009a). U.S. farm productivity has increased significantly over the last 50 years. Farm output in 2008 was 158 percent higher than it was in 1948 (Figure 2-1). Farm output was growing at an average annual rate of 1.58 percent, but aggregate inputs used increased only 0.06 percent annually (USDA-ERS, 2010).
As a result of improved productivity, fewer farmers are producing more food and fiber on about the same acreage as the beginning of the century to meet the current demands of domestic and international markets; both markets are significantly larger now than they were in the 1900s. Furthermore, the growth in demand has been accompanied by a decline in the average percentage of disposable income spent by U.S. consumers for food. For example, in 1950, the average percentage of disposable income spent on food—for food at home and away from home—was 20.6 percent. By 2008, that amount was 9.6 percent (USDA-ERS, 2005a).
Farmers are producing more food and fiber with less energy compared to 50 years ago (Figure 2-2; Shoemaker et al., 2006). They achieve higher output per unit energy input (Schnepf, 2004) using a number of strategies to reduce direct and indirect energy use. Direct energy use1 has been reduced as a result of advances in equipment efficiency, irrigation efficiency, adoption of no-till or conservation tillage, and other practices and technologies (USDA-NRCS, 2006). Indirect energy use2 has been reduced by increasing provision of
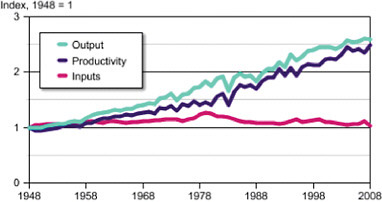
FIGURE 2-1 Agricultural productivity in the United States.
SOURCE: USDA-ERS (2010).
within-farm biogeophysical (ecosystem) services. For example, farming systems have been using crop rotations that could reduce pests and disease incidence so that pesticide use is reduced. Some farms use livestock manure to fertilize crops so that use of synthetic fertilizer is reduced. Precision agriculture for nutrient and pesticide application holds promise for reducing input use and maintain yield.
Despite such advances, much progress in agriculture focuses on primarily one goal—satisfy human food, feed, and fiber fuel needs—and secondarily on the goals of enhancing environmental quality or resource base and of sustaining the economic vitality of
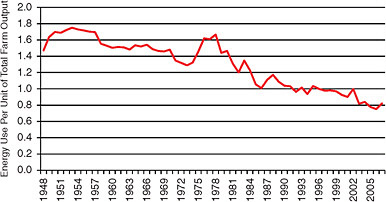
FIGURE 2-2 Total farm output per unit of energy use over time.
NOTE: Energy input use if total farm output was 1 in 1996.
SOURCE: USDA-ERS (2009b).
agriculture. Agriculture worldwide is facing the daunting challenges of providing for an increasing population that has changing food consumption patterns under the constraints of natural resource scarcity, avoiding environmental degradation, climate change, and a restructuring global economy. In addition, consumers (including food buyers) are increasingly conscious about the sources of their food and how it is produced. Consumer concerns can translate into political and market demands for addressing the challenges. Thus, agriculture appears to be at a pivotal stage in terms of societal demands for agricultural systems with improved sustainability—that is, systems that address and balance social, economic, and environmental performance, and increase robustness in the face of new challenges.
There are growing concerns about whether the trends of increasing productivity per acre of land can continue while maintaining or restoring the natural resource base upon which agriculture depends. Similarly, researchers and some members of the public are increasingly worried about many of the unintended negative consequences of agricultural production—for example, the effect of agriculture on environmental quality and ecosystem functioning, the potential risks of agricultural pollutants or risks of contamination of food and water by agricultural input to human health, and the safety and nutritional content of the food produced. Some observers raise the issues of how modern agriculture affects the well-being of farming communities, farm families, farm laborers, and livestock (Friedland et al., 1991; Vitousek et al., 1997). Those concerns have caused observers to question whether U.S. agriculture can continue to supply adequate quantities of reasonably priced food, feed, and fiber using conventional production methods. What are the tradeoffs and risks that will be required to maintain, and even increase, growth in productivity?
Many unintended consequences of agricultural activities can be thought of as externalized costs of production, which are real, but mostly unaccounted for in productivity measures or internal financial budgets of farm enterprises. Societal concerns raise important public policy questions regarding the type, scale, and organization of U.S. agriculture that can best meet society’s needs in the future. Those concerns generate interest in alternatives to the current system of agricultural production that might increase the sustainability and broader performance of modern farming systems. The two major concerns of resource sufficiency and unintended consequences can be summarized in two questions: Are current agricultural practices and systems sustainable? If not, how can agriculture be moved toward a more sustainable trajectory?
The purpose of this report is to identify what is known about farming practices and systems and their ability to address the identified concerns. This chapter provides a brief overview of how U.S. agriculture has evolved over the years to the current state. Despite the many positive changes (for example, increased productivity), farmers now face a different set of challenges related to environmental, social, and economic concerns. This chapter also discusses those challenges.
A BRIEF HISTORY OF U.S. AGRICULTURE
U.S. agriculture’s current structure and organization is a product of a long evolution (Batie, 2008). Since World War II, increased mechanization, rising productivity, and growth in nonfarm employment opportunities combined to produce more than a 60 percent drop in the number of farming operations and a doubling in average farm size in the United States (Gardner, 2002). Between 1982 and 2002, most types of crop farms have at least doubled in size, and the average size of livestock herds has increased by 2–20 times, depending on species (MacDonald and McBride, 2009). Growth in scale and productivity among the remain-
ing commercial farming operations has been sufficient to sustain steady annual growth in agricultural output of almost 2 percent a year (Fuglie et al., 2007).
Unlike many sectors of the U.S. economy in which growth is associated with increased use of inputs, agricultural output has been increasing substantially despite a decline in such purchased inputs as capital, land, labor, and materials (Ball, 2005). For example, land used for crop production, as pasture or as idled cropland, has declined steadily since World War II. Although there is much year-to-year variation in the acreage of cropland used for crops from 1910 to 2005, the acreage in 2005 is comparable to that of 1910 (Figure 2-3). Yet those croplands are producing vastly more food, fiber, and fuel (USDA-NASS, 2002). Yields per acre have grown since 1935 at a rate of 2.1 percent per year (Gardner, 2002). U.S. corn yield, for example, has been increasing steadily (Cassman and Liska, 2007). Many other U.S. crops have similar histories of growth in their yields per acre (Gardner, 2002).
The dramatic changes in farm size and productivity are associated with two important trends in the structure of the U.S. farm sector: increased concentration and specialization in farm production. In the first instance, a smaller fraction of farms is increasingly responsible for producing the overwhelming bulk of American food output (Gardner, 2002). In 2002, for example, the top 6.7 percent of the largest farms in the United States (143,547 farms) accounted for 75 percent of total farm sales (USDA-NASS, 2002). In the second instance, farms have become increasingly specialized since the early 1960s, and the average number of major commodities raised on a typical farm declined from 5.6 in 1920 to 1.3 in 2002 (Gardner, 2002). Prior to World War II, almost all U.S. farms raised a diverse set of commodities (particularly chickens, pigs, cattle, potatoes, hay, and corn). The growing specialization of production is associated with technological change, increased labor productivity, and growing economies of scale3 (Hallam, 1993; MacDonald and McBride, 2009).
One of the most striking specialization trends in U.S. agriculture has been the decoupling of crop and livestock production (Russelle et al., 2007). The growth of highly specialized confinement livestock operations has led to greatly increased animal densities (livestock units per acre of available land) and the geographic movement of poultry, hog, and dairy production away from traditional feed grain production regions (McBride, 1997; Hart, 2003).
The dramatic changes in U.S. agriculture over the last half-century have been influenced by four major drivers: new agricultural technologies, expansion and commercialization of markets, government programs, and research and development.
New agricultural technologies. Resource sufficiency concerns over the last century were overcome by the development and diffusion of new agricultural technologies, rather than increased land area devoted to farming (Figure 2-3). In the case of corn, for example, much of the increase in productivity can be attributed to increased yields per unit land as a result of improved breeding, fertilizer use, pest management, and irrigation (Figure 2-4) (Tilman, 1999; Cassman and Liska, 2007). Most technological innovations have favored larger farms (Halloran and Archer, 2008) because mechanical equipment has to be used for a minimum number of hours or acres to achieve efficiency.
Modern crop varieties and off-farm inputs have become tools used by some farmers to manage the risks associated with large-scale monoculture farming (Halloran and Archer, 2008). Mechanization in agriculture and its improvement over time has reduced labor requirements and increased labor productivity (Sassenrath et al., 2008). The number of workers per acre of production has declined significantly in the last century (Schjonning et al.,
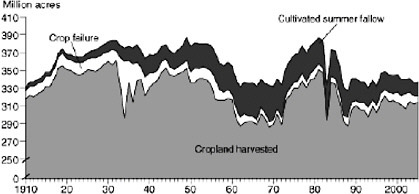
FIGURE 2-3 Acreage of cropland used for crops.
SOURCE: USDA-ERS (Vesterby et al., 2004).
2004). Farms and ranches in the United States are now managed by less than 2 percent of the population (Vesterby and Krupa, 2001), but occupy about half of the total acreage of the country (Lubowski et al., 2006).
Expansion and commercialization of markets. The increased production and productivity of U.S. agriculture has occurred in tandem with a significant expansion of export markets for U.S. farm products and the rapid consolidation and vertical integration of national and global food processing, distribution, and retailing sectors (MacDonald and McBride, 2009). While U.S. population growth has increased by roughly 1 percent annually
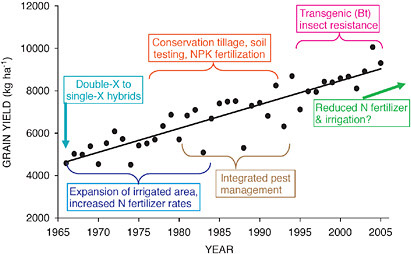
FIGURE 2-4 U.S. maize yield trends, 1966–2005, and the technological innovations that contributed to this yield advance.
SOURCE: Cassman and Liska (2007). Reprinted with permission from Wiley.
since 1970, food production has increased at twice that pace. Increased domestic per capita consumption of food (including changes in diets to include greater consumption of meats and processed foods) and growing international trade have been important contributing factors driving increased production of the farm sector. At the same time, the processing and distribution of U.S. farm products have become controlled by a much smaller number of highly integrated national and global firms than there used to be (Hendrickson and Heffernan, 2007). Demands by processers and retailers for consistent, high-quality products on a year-round basis have influenced patterns of technological innovation and structural change at the farm level.
Government programs. U.S. agricultural policy was initiated during the Great Depression to address low farm income. The U.S. Farm Bill is enacted every four to five years and has a major influence on land management decisions and choice of crops (Halloran and Archer, 2008). The Farm Bill’s commodity programs have had four major effects: (1) scale—total production or total acreage, (2) mix of commodities—which crops or livestock are grown or produced, (3) location—where crops or livestock are grown and produced, and (4) intensity—input use per acre for a specific crop-location combination or density of livestock production per acre (Frisvold, 2004). In addition to the commodity programs, the Farm Bill has provisions for subsidies and technical assistance for conservation, and for nutritional programs and food buying assistance for lower income consumers.
Research and development. Many technological innovations that accelerated growth in productivity came from agricultural experiment stations and colleges of agriculture in land grant universities. Innovations in information and marketing technology also facilitated farmers’ adoption of new production methods (Gardner, 2002). The technological development and innovations were induced and supported by complementary government farm agricultural policies. An example is the large public investments in infrastructure development—for instance, development of water resources for irrigation, which vastly improved the ability to provide food and fiber in arid regions. As a direct result of those taxpayer-supported programs, farmlands that receive subsidized irrigation grew to almost 40 million acres by 1970 (Cochrane, 1979).
U.S. AGRICULTURE TODAY
While the overall trends in U.S. commercial agriculture have been toward fewer, larger, and more specialized farms, the farm sector remains diverse (Hoppe et al., 2007). Using census data, researchers at the U.S. Department of Agriculture (USDA) have identified several important clusters of farm “types” in the United States (Box 2-1). The importance of each farm type across a wide range of indicators is summarized in Table 2-1. As a result, the management practices used on many different types of U.S. farms will each contribute to the overall sustainability performance of the U.S. farm sector. In addition, efforts to assess and improve the sustainability of U.S. farming are likely to require distinctive strategies appropriate for different types of farms.
The data in Table 2-1 indicate the smallest family farms in the United States (those with sales under $100,000) represent over 80 percent of total farm numbers, but produce less than 10 percent of total farm sales. Because a farm is defined in the Census of Agriculture as any operation that sold or could have sold more than $1,000 worth of agricultural products, many of those small farm operators might not even consider themselves to be farmers, and most of those farms are run as recreational or lifestyle farms by people who rely mainly on off-farm income or who are retired. That group of small farms, however, still manages about a third of U.S. cropland and farmland.
BOX 2-1 Farm Typology Developed by the U.S. Departmentof Agriculture Economic Research Service The U.S. farm sector is so diverse that statistics summarizing the sector as a whole can be misleading. The USDA Economic Research Service (ERS) has developed a classification typology to identify relatively homogenous subgroups of U.S. farms. The typology is based largely on farm sales, organizational structure, and the operator’s primary occupation. The farm classification developed by ERS focuses on the “family farm,” or any farm organized as a sole proprietorship, partnership, or family corporation. Family farms exclude farms organized as nonfamily corporations or cooperatives and farms with hired managers. Small Family Farms (sales less than $250,000)
Large-Scale Family Farms (sales of $250,000 or more)
Nonfamily Farms
SOURCE: USDA-ERS (2000). |
The mid-sized family farms (sales between $100,000 and $500,000) are examples of the prototypical “family farm” that has captured much of the public imagination and public policy debates over the future of American agriculture (Browne et al., 1992). According to the 2007 census, these mid-sized farms represented just under 10 percent of all U.S. farms, produced 16.5 percent of all farm sales, and managed another quarter of the nation’s farmland and nearly 30 percent of its cropland.
Small and mid-sized family farms together owned two-thirds of the total value of farmland, buildings, and equipment and managed roughly 60 percent of all U.S. farmland and cropland in 2007. Therefore, they will continue to play an important role in efforts to improve the environmental footprint of agriculture, and their experiences and activities will continue to shape the social and economic well-being of farm families and agricultural communities. Interestingly, the proportion of small and mid-size operations that have chosen to participate in federal land conservation programs is larger than that of
TABLE 2-1 Farm Typology Class and the Relative Contribution of Each Class to Various Farm Indicators in 2007
Indicator | Farm Typology Class | |||||||
Small Family Farms (Sales < $250,000) | Large Family Farms (Sales $250,000+) | |||||||
Limited- Resource Farms | Retirement Farms | Residential-Lifestyle Farms | Farming-Occup. (Sales < $100,000) | Farming-Occup. ($100,000–$249,999) | Large Family Farms ($250,000–$499,999) | Very Large Family Farms ($500,000+) | NonFamily Farms | |
|
|
|
| (Percent of U.S. Total) |
|
|
| |
Farms | 14.0 | 20.7 | 36.4 | 11.7 | 4.5 | 3.9 | 4.6 | 4.1 |
Value of Productiona | 0.9 | 2.3 | 3.7 | 2.2 | 5.8 | 10.7 | 54.3 | 22.9 |
Total Government Payments | 3.3 | 9.9 | 12.1 | 7.2 | 11.0 | 16.1 | 33.1 | 7.4 |
Production Expenses | 1.7 | 3.2 | 5.8 | 3.2 | 5.4 | 9.5 | 48.6 | 22.5 |
Net Cash Farm Income | –1.3 | 1.4 | –1.2 | 0.8 | 7.4 | 13.9 | 60.5 | 18.4 |
Value of Farm Assetsb | 5.9 | 11.8 | 18.1 | 8.9 | 8.4 | 11.5 | 25.2 | 10.3 |
Hired Farm Workers | 3.5 | 7.6 | 11.7 | 6.9 | 6.2 | 8.4 | 34.1 | 21.6 |
Farmland | 4.6 | 9.7 | 13.1 | 9.5 | 11.3 | 13.3 | 22.9 | 15.6 |
Cropland | 3.6 | 8.0 | 11.0 | 7.4 | 11.5 | 16.6 | 34.0 | 7.9 |
Irrigated Land | 1.5 | 3.0 | 4.6 | 3.8 | 7.4 | 13.1 | 50.6 | 16.0 |
Conservation Program Landc | 7.5 | 26.1 | 26.6 | 11.6 | 6.3 | 5.8 | 7.6 | 8.5 |
Crop Insurance Acresd | 1.2 | 2.8 | 5.0 | 4.8 | 13.2 | 21.0 | 44.3 | 7.6 |
Organic Farms | 16.4 | 12.1 | 27.3 | 19.6 | 8.1 | 4.6 | 4.9 | 7.2 |
Organically Certified Land | 6.0 | 6.5 | 11.8 | 13.4 | 16.3 | 15.2 | 19.4 | 11.3 |
Organic Produce Sales | 1.5 | 1.7 | 3.2 | 4.3 | 9.0 | 10.5 | 41.6 | 28.1 |
aMarket value of agricultural product sales. bCombined value of land, buildings, machinery, and equipment. cAcres enrolled in Conservation Reserve Program, Wetlands Reserve Program, Conservation Reserve Enhancement Program, and farmable wetlands programs. dAcres enrolled in crop insurance programs. SOURCE: 2007 Census of Agriculture. | ||||||||
large operations. Eighty-four percent of all land in federal land conservation programs is managed by small and mid-sized farms. Small and mid-sized farms received 88 percent of U.S. total government payments for conservation programs in 2006 (Hoppe et al., 2008). In addition, 70 percent of organically certified land in the United States was managed by small and mid-sized farms in 2007 (although they accounted for only 30 percent of total organic product sales).
In contrast to the small and mid-sized farms, million-dollar farms—that is, those with annual sales of at least $1 million—accounted for nearly half of U.S. farm product sales in 2002, even though there were only about 35,000 of them. They represent only 2 percent of all U.S. farms (Hoppe et al., 2008). Most million-dollar farms were operated as family businesses, and many reflect joint operations that support multiple family members and households. These types of farms particularly dominate the value of U.S. production of high-valued specialty crops (72 percent), dairy products (59 percent), hogs (58 percent), poultry (55 percent), and beef (52 percent). In some crops, production is concentrated. For example “[d]ata on acres harvested [obtained] from the 2002 Census of Agriculture suggest that some specialty crops occur on a relatively small number of farms. For example, the 58 largest producers of head lettuce (out of 830 total producers) in 2002—each harvesting at least 1000 acres of the crop accounted for 65 percent of the total acreage in head lettuce. As another example, the 77 largest broccoli producers (out of 2,493 total producers)—each with at least 500 harvested acres of the crop—accounted for 69 percent of the total harvest acres” (Hoppe et al., 2008, p. 34).
Because of economies of size, and as illustrated in Figure 2-5, those large farms tend to have profit margins that give them a competitive edge when compared to similar, but smaller farms. The million-dollar farms can take better advantage than the small farms of technological changes, economic and financial innovations, business management principles, and coordination with suppliers and processors (Gray and Boehlje, 2007).
Relatively few of the million-dollar farms specialize in crops that are covered by Farm Bill commodity programs, although the 44 percent of these farms that did participate in
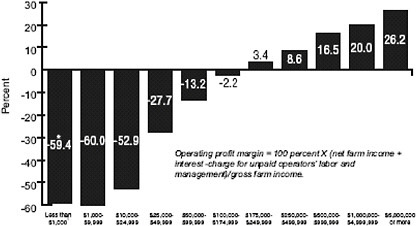
FIGURE 2-5 Operating profit margin, by sales class in 2006.
SOURCE: USDA, Economic Research Service, 2006 Agricultural Resource Management Survey, Phase III (as cited in Hoppe et al., 2008).
commodity programs received a total of 16 percent of all commodity program payments. The million-dollar farms account for 62 percent of all U.S. farm products produced under contracts with processors and other end buyers. Very large farms were somewhat less likely to participate in federal conservation programs than mid-sized farms. In 2006, 6 percent of total government conservation spending was distributed to the million-dollar farms (Hoppe et al., 2008).
Another important form of agricultural diversity in the United States becomes apparent when examining the acreage planted to various crops or used for livestock production. Efforts to address the sustainability of U.S. agriculture will need to confront the distinctive opportunities and challenges associated with production of different types of commodities. The most commonly raised commodities in U.S. agriculture are beef cattle, horses, and forages (each raised by more than a quarter of U.S. farms). However, the most economically important commodities—grains, poultry, dairy products, and specialty crops—are typically raised on a small fraction of U.S. farms (Table 2-2). Those commodities also represent the production systems that use most of the energy, fertilizers, agrichemicals, and hired labor in the United States. From a landscape perspective, most U.S. cropland is planted to
TABLE 2-2 Relative Importance of Different Commodities in U.S. Agriculture, 2002
corn, soybean, forage crops, and wheat. Efforts to significantly increase cropping diversity, change tillage practices, or reduce nonpoint source pollution from cropping activities will need to emphasize those commodity production systems.
The geography of U.S. agriculture is shaped by a range of biophysical, economic, and demographic factors that vary widely by region. Researchers at USDA demonstrate the landscape diversity by combining data on county-level farm characteristics with data on natural resource conditions, such as areas with similar physiographic, soil, and climatic traits. (For maps and definitions, see USDA-ERS, 2009c.) They identified nine major “farm resource regions” in the United States (Heimlich, 2000). Figure 2-6 describes these regions and highlights the importance of them, the combination of which accounts for almost half of U.S. farms, 60 percent of the value of production, and 44 percent of U.S. cropland. The three regions are the “heartland” region in the corn belt, where cash grain and cattle and hog production dominates; the “fruitful rim” along the Pacific coast, southern Texas, and Florida where large farms are concentrated and fruit, vegetable, nursery, and cotton production dominates; and the “northern crescent,” a traditional dairy and cash grain region. Farm commodity systems and production practices often differ markedly across the various farm resource regions in the United States.

FIGURE 2-6 Farm resource regions in the United States.
SOURCE: USDA-ERS (Heimlich, 2000).
CHALLENGES TO U.S. AGRICULTURE IN THE 21ST CENTURY
The U.S. agricultural sector has evolved over time to meet the challenge of providing adequate food, feed, fiber, and landscape ornamental crops at acceptable consumer prices, but new challenges emerge. Demands on agriculture are not limited to food, feed, and fiber needs, but now include biofuel needs. As productivity in agriculture continues to increase, the natural resources used to support agriculture are being depleted or degraded. Such economic concerns as farm sector profitability and rising input costs and such social concerns as labor justice, food quality and safety, animal welfare, and community well-being are also becoming more prominent.
Increasing Demand on U.S. Agriculture
Agriculture faces the pressure of increasing demand for food, feed, fiber, and fuel as a result of population growth, changes in diet, and the emergence of the bioenergy industry. The world population is growing and reached 6.8 billion people in 2009—a 9 percent increase since 2000.
The U.S. population continues to increase at a similar rate as the world population, from 281 million people in 2000 to 307 million people in 2009 (U.S. Census Bureau, 2009). The total consumption of different food groups has been increasing as a result of a larger U.S. population (Lin et al., 2003). It is not merely the absolute population, however, that drives the demand for agricultural products, but rather population growth accompanied by income growth. As incomes grow, the composition of agricultural products demanded also changes. At low levels of intake of meat, milk, and eggs, an increase in consumption of these foods is known to be nutritionally beneficial because the biological value of protein in foods from animals is about 1.4 times that of foods from plants (CAST, 1999). Americans, however, are consuming on average more meat than the amount recommended by the federal dietary guideline (Wells and Buzby, 2008). About 3 pounds (lb) of grains is required to produce 1 lb of meat from any animal species (CAST, 1999). Therefore, a high level of meat consumption increases the demand on agriculture, because farmers have to produce feed for livestock, which in turn will provide meat for consumers (Pimentel and Pimentel, 2003).
In addition to meeting the demands of the domestic market, U.S. agriculture has to meet the demands of its foreign market. Agricultural exports are likely to increase in the coming years because of new demand from emerging markets (Gehlhar et al., 2007). Foreign demand for U.S. agricultural exports is largely determined by income level and the rate of economic growth. U.S. agricultural exports historically were largely dependent on such high-income markets as Canada, Japan, and the European Union. Slow income and population growth in Japan and the European Union have weakened demand for U.S. agricultural exports to those countries (Figure 2-7). Rising incomes in such emerging markets as Mexico and China have led to an increased proportion of U.S. agricultural export to those countries in the last 15 years (Gehlhar et al., 2007) and an overall increase in the value of U.S. agricultural exports (USDA-ERS, 2008).
In addition to meeting domestic and foreign demand for food, feed, and fiber and responding to incentives provided within federal legislation, U.S. agriculture has also been producing crops for the emerging bioenergy and biofuels market over the last 10 years. The corn grain ethanol and soybean biodiesel industries have opened a new market for corn and soybean. In the 2007 crop year (from September 2, 2007, to August 31, 2008), 8.2 billion gallons of ethanol were produced from 3 billion bushels of corn (NCGA, 2008) and 450 million gallons of biodiesel were produced from 275 million bushels of soybean (NBB, 2007). Those
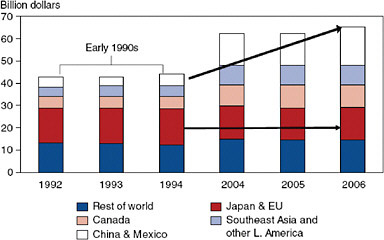
FIGURE 2-7 Shift in United States agricultural exports toward emerging markets.
SOURCE: USDA-ERS (Gehlhar et al., 2007).
quantities represent 23 percent of the year ’s corn harvest (up from 20 percent in 2006) and 17 percent of the year ’s soybean harvest (USDA-NASS, 2008). The biofuel market increases the demand for corn and soybean, which in turn raises the price of those commodities. Although higher commodity prices benefit some farmers, they increase production costs for others that use corn and soybean as part of animal feed (Westcott, 2007; Donohue and Cunningham, 2009). Moreover, increasing production of those commodities could displace other crops and have negative environmental and social consequences (Westcott, 2007; Donner and Kucharik, 2008; Pineiro et al., 2009).
The use of food commodities to produce biofuels has raised concern about competition between food versus fuel and the related impact of biofuel production on food prices. In the early years of corn grain ethanol production, there was little impact on the U.S. corn market because of the slow growth of the ethanol industry, higher corn yields, and large corn stocks (Baker and Zahniser, 2006). As corn grain ethanol production increases, however, the feedstock has to be either diverted from corn exports or come from higher production. Unless the conversion of grain to ethanol becomes more technically efficient, higher production can be achieved by diverting more land to corn production or growing corn more intensively. Both approaches could increase food prices and raise additional environmental concerns (Box 2-2). Although most economists agree that the emerging biofuel market contributes to higher food prices (FAO, 2008), its relative contribution has been widely debated and estimates vary from a few percentage points (Glauber, 2008) to as much as 39 percent of the increase in real prices (Collins, 2008; Rosegrant, 2008).
Natural Resource Scarcity
Land Availability
The long-term adequacy of agricultural land in the United States has been a continuing concern (Sampson, 1981). A study by the American Farmland Trust (2002) reported that
BOX 2-2 Social, Economic, and Environmental Effects of Biofuels Biofuel production in the United States has been considered an option to reduce U.S. reliance on oil because the feedstock for fuel production can be grown domestically. Technological developments and policy changes have contributed to the rapid growth in production of various agricultural crops that can be processed into liquid and gaseous fuels. A key factor was the passage of the Energy Policy Act in 2005 and the Energy Independence and Security Act (EISA) in 2007 by the U.S. Congress that mandates dramatically increased levels of biofuels consumption over the next 15 years. The biofuel industry has created a major new competitive use for U.S. grains. The portion of U.S. corn used to produce ethanol rose from 6 percent in the late 1990s to almost 25 percent in 2008. Growth of the industry, however, has slowed since 2008 partly because of the global economic recession. Production of corn grain ethanol and soybean biodiesel have unintended environmental, social, and economic consequences. Influence on Food Security As of 2009, the overwhelming bulk of biofuel produced in the United States was corn grain ethanol (Wescott, 2009), although some biodiesel is produced from soybean and animal fats. Growth in the use of corn for ethanol production has been associated with reduced availability of corn for livestock feeds (Doering, 2008). Although higher commodity prices benefit some farmers, they also increase production costs for others that use corn and soybean as part of animal feed (Westcott, 2007; Donohue and Cunningham, 2009). The use of dry distiller grain, a byproduct from corn ethanol production, as animal feed for beef and dairy cattle can only partly offset the adverse effects of increased feed costs, because every bushel of corn used for ethanol is two-thirds less of a bushel of corn for livestock feed (Miranowski et al., 2008). As a result, the use of commodity crops for fuel production or use of prime cropland to produce biofuel feedstock instead of food crops has raised concerns about “food versus fuel.” Some estimate that, if the corn grain ethanol industry continues to expand, the positive effects of ethanol industry on rural economies will be offset by the negative economic effect on the livestock industry (Miranowski et al., 2008). In addition, many are concerned that using commodity crops for fuel might contribute to rising world food prices (Collins, 2008; FAO, 2008; Rosegrant, 2008 and references cited therein), although food prices are affected by many other factors, including energy costs (Dewbre et al., 2008). In the United States, retail prices for red meats, poultry, and eggs rose dramatically in 2007 and 2008 in response to many factors, including higher feed prices (Leibtag, 2008). Influence on Environmental Sustainability Biofuels are also viewed as a potential strategy to reduce greenhouse gas emissions from the transportation sector, because the exhaust emissions of carbon monoxide from burning biofuels are considerably lower compared to petroleum-based fuels (EPA, 2002; Ribeiro et al., 2007). Although corn grain ethanol and soybean biodiesel have positive net energy balances (that is, energy in the fuels produced exceeds the energy required to produce them) and have lower greenhouse-gas life-cycle emissions compared to petroleum-based fuel (Hill et al., 2006; Wang et al., 2007), the greenhouse-gas benefits might not be realized if forest or grassland is cleared elsewhere to grow crops displaced by corn and soybean in the United States (Fargione et al., 2008; Searchinger |
urbanized land grew by about 47 percent from 1982 to 1997 even though the U.S. population only grew by about 17 percent during that period. Much of the growth of urbanized land was at the expense of high-productivity cropland. Although various studies and analyses have shown that current land use changes do not represent threats to the nation’s total food production (USDA-NRCS, 2001), there is a growing concern that prime farmland4 near urban areas is being lost to nonagricultural uses through development and that the
et al., 2008). That is because carbon sequestration achieved by changing practices to reduce carbon on one landscape can be offset by increased carbon releases on other landscapes and result in a net increase in total carbon emission (Murray et al., 2004; IPCC, 2006). Although difficult to document, it is plausible that the increasing demand and prices of corn and soybeans—in addition to expanding the acreage dedicated to corn and soybean—have also encouraged farmers to increase production by reducing crop rotations, planting marginal lands, reducing fallow, or returning acreage that was idled because of enrollment in the Conservation Reserve Program (Westcott, 2007), all of which might exacerbate any negative environmental and habitat effects associated with intensive corn production (Donner and Kucharik, 2008; Pineiro et al., 2009). If EISA’s objective of 15 billion gallons of corn grain ethanol by 2022 is realized, for example, the average flux of dissolved nitrogen export by the Mississippi and Atchafalaya Rivers into the Gulf of Mexico is predicted to increase by 10 to 34 percent (Donner and Kucharik, 2008). That level of nutrient influx will greatly expand the hypoxia zone in the Gulf—where dissolved oxygen in the water is too low to support marine life. (See Box 2-4.) Influence on Economic Sustainability Expanding the biofuel industry can enhance farm-level economic security on some farms and decrease it on others. As mentioned earlier, increases in corn and soybean prices benefit those commodity farms, but can have adverse effects on farms that rely on grains for feed. Even for the commodity farmers, the demand of corn grain for ethanol production depends on several factors, including the price of ethanol and biodiesel relative to oil (NAS-NAE-NRC, 2009), the percentage of ethanol that can be blended in fuel, and the number of flex-fuel vehicles (that can use 85 percent ethanol) on the road (Westcott, 2009). Because biomass is bulky and expensive to transport, biorefineries will likely be built in areas where biomass feedstock for fuel is abundant. Biomass feedstock production will likely attract biorefineries to rural communities (as in the case with corn grain ethanol and soybean biodiesel). Biorefineries, particularly those with local investment, provide some additional jobs in rural communities and potentially enhance economic vitality (Kleinschmit, 2007). However, some empirical evidence suggests that job gains have been overestimated (Swenson, 2009), and that there can be other mixed or negative social impacts in host communities (Selfa et al., 2009). Encouraged by EISA, other government-provided incentives, and rising oil prices until 2008, facilities have been constructed to convert corn starch to ethanol and to convert primarily soybean oil and secondarily animal fats and waste cooking oils to biodiesel. The growth of the biofuels industry has slowed since 2008. The economic recession and the steep decline of crude oil prices in the last quarter of 2008 (from the peak of $147 per barrel on July 11, 2008, to about $35 per barrel at the end of the same year) resulted in many ethanol plants running below capacity and caused many to declare bankruptcy (Andrejczak, 2009; Knauss, 2009; The Associated Press, 2009; VeraSun Energy, 2009). According to one source, ethanol production in 2009 was estimated at approximately 10 billion gallons, far less than the previous capacity of 12.5 billion gallons (Krauss, 2009). Meanwhile, biodiesel plants continue to operate at 50 percent of capacity or less. The economic benefits brought by a biorefinery to local communities might be volatile because biofuels are new compared to petroleum-based fuels. The long-term stability of the biofuels market remains to be seen. The ultimate environmental, social, and economic impacts of using corn and soybean grain for production of biofuels are under debate at this time. Another National Research Council study on the economic and environmental impacts of biofuels that is in progress will examine those issues in depth. |
reversal of those developments is politically difficult and expensive (Klein and Reganold, 1997; Nizeyimana et al., 2001). In 2001, the total developed area in the contiguous United States was slightly more than 106 million acres (1 acre = 0.40 hectare), which included 33.2 million acres of agricultural lands—including cropland, pastureland, rangeland, and forest land—that were converted to developed uses (for example, large urban and built-up areas, small built-up areas, and rural transportation land) from 1982 to 2001 (Figure 2-8) (USDA-NRCS, 2003). The rate of prime farmland development increased from an average of 400,000 acres per year between 1982 and 1992 to more than 600,000 acres per year between 1992 and 2001 (Figure 2-9). Researchers (Reganold and Singer, 1984) have shown that ratios of

FIGURE 2-8 Conversion of agricultural and other lands to developed uses in the United States between 1982 and 2001.
SOURCE: USDA-NRCS (2003).
economic input to output for farming on prime farmlands are significantly lower than for non-prime farmlands. The economic return for farming on higher-quality soils tends to be better than farming on lower-quality soils and marginal lands for food production.
A related concern is that of pressure for nonfarm development in areas where many high-value specialty crops are grown. Much of the specialty fruit and vegetable production occurs in southern states such as Florida and California, which are experiencing the most
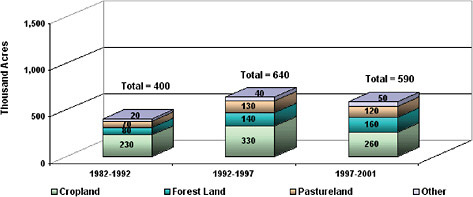
FIGURE 2-9 Conversion of prime farmland to developed uses in the United States between 1982 and 2001.
SOURCE: USDA-NRCS (2003).
rapid rates of land development in the country (Norris and Deaton, 2001). An American Farmland Trust study (2002) estimates that 86 percent of U.S. fruits and vegetables are produced in areas influenced by rapid urban development pressures. While the farms in those areas might benefit from close access to large population centers, they are competing for land and water with urban and industrial uses.
Water Availability
Agriculture accounts for 80 percent of consumptive water use5 in the United States (USDA-ERS, 2004). Irrigated cropland is an important and growing component of the U.S. farm economy and was the largest use of freshwater by 2000 (Hutson et al., 2004). Although only 16 percent of the U.S. cropland is irrigated, that acreage is used for high-value crops that account for nearly half of the total U.S. crop sales (USDA-ERS, 2004).
Some regions of the United States with the greatest water shortages also have the most rapidly growing populations. California’s population is expected to grow from 34 million to nearly 60 million from 2000 to 2050, mostly in the water-starved urban regions of southern California (California Department of Finance, 2007). The seven states sharing the Colorado River are projected to increase their populations by 47 percent from 2000 to 2030, significantly higher than the increase of 29 percent projected for the United States as a whole (U.S. Census Bureau, 2009).
Meanwhile, ground water is extensively pumped from many aquifers to provide water for domestic and agricultural use. When the rate of extraction exceeds the rate of recharge by natural processes, ground water is said to be in a state of overdraft, and water levels drop. Under prolonged overdraft conditions, the water level of an aquifer can fall to a depth where it is no longer economically feasible to pump and the resource becomes exhausted. The time required for natural recharge to return the water level to a depth practical for extraction can be considerable, and in the case of aquifers that were charged in previous climate cycles (so-called fossil aquifers such as the Ogallala), the resource is unrecoverable in any practical time frame (Box 2-3). The challenge to agriculture is to conserve and recycle water to extend the use of the fossil aquifers or adapt to dryland farming.
Although irrigation has become much more water and energy efficient, water scarcity will likely be a challenge for agriculture in years to come as the supply of water decreases and competing demands of water from other sectors increase. As the demand rises and supply declines, the price of water will likely increase, which in turn increases production costs of irrigated agriculture (Box 2-3). The Family Farm Alliance (2007) expressed concern that urban and industrial water demands will be met at the expense of domestic agricultural production.
Climate Change
Agriculture faces uncharted challenges posed by global climate change in the near future. Global surface temperature shows an increase of 0.78ºC since the beginning of the 20th century (NRC, 2008); it is projected to increase by another 1.1–6.4ºC by 2100 (IPCC, 2007). Climate models project an increase in carbon dioxide (CO2) levels and temperature, changes in rainfall, and increased frequency in extreme weather events (for example, heat waves and heavy precipitation) in the mid-latitude to high-latitude regions (IPCC, 2007).
BOX 2-3 Overdrafting of the Ogallala Aquifer The success of large-scale farming in areas lacking adequate precipitation and reliable perennial surface water depends heavily on pumping ground water for irrigation. In the Midwestern United States, ground water overdrafting of the Ogallala or High Plains aquifer presents a significant long-range problem. This aquifer is a large underground reservoir that encompasses portions of eight states ranging from South Dakota to Texas. About 27 percent of the total irrigated land in the United States overlies this aquifer system, which yields about 30 percent of the nation’s ground water used for irrigation. The water is used to produce corn, wheat, cotton, alfalfa, and soybean; some of those crops are used to support about 40 percent of the U.S. supply of feedlot beef (USDA-ERS, 2005b). In addition, the aquifer system provides drinking water to 82 percent of the people who live within its boundary (Dennehy, 2000). Water-level declines started to occur in the Ogallala aquifer soon after the beginning of extensive ground water irrigation development following the end of World War II. By 1997, 13.7 million acres were being irrigated by ground water from the aquifer, accounting for some 20 percent of all U.S. irrigation. Because withdrawals exceed natural recharge, the water table has been declining (Colaizzi et al., 2009). By 1980, water levels in the Ogallala aquifer in parts of southwestern Kansas, New Mexico, Oklahoma, and Texas had declined more than 100 feet (Luckey et al., 1981). Some croplands in Texas have suspended the use of irrigation with ground water because of its expense relative to the value of the crops grown. In effect, the Ogallala aquifer is a nonrenewable resource, similar to a coal mine. The current pumping of groundwater for irrigation is permanently depleting (or mining) ground water quantities available for future uses (Kneese, 1986). |
Although increases in CO2 and temperature could benefit crop production, the interactive effects of CO2, temperature, and rainfall might result in the opposite (Easterling et al., 2007). Because precipitation is the main driver of variability in the water balance over space and time, future changes in regional precipitation could have important implications for agricultural systems. Current climate models simulate a climate change-induced increase in annual precipitation in high and mid-latitudes (Carter et al., 2000). Precipitation extremes are predicted to increase in frequency, with more drought and flood occurrences. Rosenzweig et al. (2002) estimated that production losses as a result of excessive moisture could double in the United States under scenarios of heavy precipitation. Increased frequency of droughts is of particular concern in the arid Southwestern United States, where water resources are already stretched and the population is increasing rapidly, and in the southern regions of the Ogallala where shifts to dryland farming are expected.
Crop yields could be further decreased because of changes in the dynamic between crops and weeds, pests, and diseases as a result of climate change (Patterson et al., 1999). A study reported that C3 weeds tend to benefit more from an increase in CO2 than C3 crops (Ziska, 2003). Research also suggests that the efficacy of glyphosate herbicide on weeds decreases with increasing CO2 (Ziska et al., 1999; Ziska and George, 2004; Ziska and Goins, 2006). Interactions between CO2 and temperature or CO2 and precipitation have been recognized as key factors in determining plant damage (Easterling et al., 2007). For example, warming trends in the United States could increase winter survival of pests and hence proliferation (Diffenbaugh et al., 2008) and could lead to earlier spring activity. Weather extremes could increase the vulnerability of plants to pests and diseases and promote outbreaks. Those potential effects of climate change on U.S. agriculture are discussed in further detail in Hatfield et al. (2008).
Environmental Degradation
There is growing recognition and evidence of the unintended consequences of agriculture. In the last century, U.S. agriculture has been increasingly large-scale, input dependent, and based on monocropping techniques and concentrated animal production. Those changes in agriculture have resulted in shifts in public concerns from productivity and food price issues to concerns about the ecological sustainability of agriculture (for example, water, soil, and air quality degradation and reduction of crop diversity associated with modern U.S. agriculture).
Water Quality
Soil erosion is one of the leading contributors to reduced water quality. Soil erosion from agricultural land increases loading of nutrient-enriched sediment into surface water, which negatively affects aquatic organisms (EPA, 2007).
Transport of dissolved inorganic nitrogen in river and stream flow has increased substantially from preindustrial times to the 1990s, with order-of-magnitude increases in drainage basins that support intensive agriculture. The large increases in nutrient flow are primarily a result of nitrogen fertilizer use in agriculture, especially in the United States. Tilman et al. (2002) suggested that crops take up only 30 to 50 percent of the fertilizer applied. Under current production practices, corn acreage typically loses nitrogen to water at annual rates of 20–40 kg/ha. Of the 93.6 million acres of corn planted in 2007, it is estimated that 117 million kg of nitrogen were deposited into national waterways (Simpson et al., 2008). The availability of nitrogen and phosphorus generally limits algal growth in lakes and reservoirs; thus, large nutrient inputs from agricultural drainage or sewage can cause dramatic shifts in aquatic ecosystems (Box 2-4). A survey of U.S. streams concluded that phosphorus and nitrogen are two of the most widespread stressors on biological communities in streams (EPA, 2007).
Nitrogen undergoes a number of reactions in soil and, under normal conditions of adequate oxygen in the upper layers of soil, culminates in formation of the stable nitrate (NO3–) ion, which is very soluble, does not bind to stationary soil particles, and is extremely mobile in soil. If not taken up by plants, nitrates can seep below the root zone to ground water. In intensely fertilized agricultural fields that contain well-drained soil above shallow ground water, ground water concentrations of NO3– can rise above the U.S. Environmental Protection Agency’s (EPA’s) maximum contaminant level of 10 mg/L of nitrogen. Nolan et al. (2002) reported that 26 percent of the wells sampled in high-risk areas of the Midwest and Western United States had NO3– concentrations above 10 mg/L of nitrogen.
The increase in size of commercial livestock operations results in concentrating large quantities of manure to limited areas (MacDonald and McBride, 2009). Producers either apply manure to their land to provide nutrients to their pasture and crops, or they store the manure temporarily and then move it to another farm for application. MacDonald and McBride (2009) found that about 5 percent of dairy farms and 10 percent of hog farms do not have cropland and therefore have to remove all their manure. For the operations that have cropland or pastureland, the quantities of manure produced often exceed the nutrient needs of the cropland and are exported from the operation. The average ratio of nitrogen to phosphorus in manure removed from livestock and poultry operations ranges from 1:1 to greater than 4:1 depending on species, form of manure, and age (ASABE, 2005). Most manure contains as much phosphorus as nitrogen, but crops require much less phosphorus than nitrogen. If the manure is applied at a rate to satisfy crops’ nitrogen requirements,
BOX 2-4 Hypoxia in the Gulf of Mexico Hypoxia refers to a state reached within coastal waters where oxygen levels drop below 2 mg/L, creating conditions that threaten the survival of fish and other aquatic animals. Hypoxia can be caused by the presence of excess nutrients in water, which cause intensive growth of algae. The consequences of enhanced algal growth are reduced sunlight penetrating the water, a decreased amount of oxygen dissolved in the water, and a loss of habitat for aquatic animals and plants. The decrease in dissolved oxygen is a secondary consequence of algal growth, caused by respiratory consumption of oxygen during degradation of organic remains of the algae. The nutrient enrichment of a water body and its overall effect is called eutrophication. Scientific investigations in the Gulf of Mexico have documented a large area of the Louisiana continental shelf with seasonally depleted oxygen to hypoxic levels. The oxygen depletion begins in late spring, reaches a maximum in midsummer, and disappears in the fall. After the Mississippi River flood of 1993, the spatial extent of this zone more than doubled in size, to over 18,000 km2, and has averaged over 15,600 km2 since then, making it one of the largest hypoxic areas in the world (CENR, 2000). The hypoxic zone forms in the middle of the most important commercial and recreational fisheries in the coterminous United States and could threaten the economy of that region of the Gulf. As of 2008, dead zones had been reported for more than 400 coastal marine systems in the world, affecting a total area of more than 245,000 km2 (Diaz and Rosenberg, 2008). Although the occurrence and extent of conditions of low oxygen in coastal waters can be the collective result of many causes, eutrophication and hypoxia in the northern Gulf of Mexico have been ascribed principally to nitrogen loadings from the Mississippi River (Bricker et al., 1999). Agricultural sources (fertilizer, soil inorganic nitrogen, and manure) are estimated to contribute about 65 percent of the nitrogen loads entering the Gulf from the Mississippi Basin (Goolsby et al., 1999). As much as 15 percent of the nitrogen fertilizer applied to cropland in the Mississippi River Basin, which includes 31 states, ends up in the Gulf of Mexico (Ribaudo and Johansson, 2006). Recent analysis of nutrient flux from the Mississippi River measured by the U.S. Geological Survey (USGS) suggests that algal production in the Gulf might be limited by phosphorus instead of nitrogen, especially in the spring (Sylvan et al., 2006). In 2001, an intergovernmental task force delivered an Action Plan to the President and Congress designed to reduce the five-year running average hypoxic zone to less than 5000 km2 (Mississippi River/Gulf of Mexico Watershed Nutrient Task Force, 2001). The Action Plan was based primarily on a 2000 integrated assessment that evaluated the causes, consequences, and potential remedies for Gulf hypoxia (CENR, 2000; Rabalais et al., 2002) and called for a reassessment of progress every five years. Limited monitoring, a highly variable ocean climate, complex trophic dynamics, and complex biogeochemical cycles can make empirical determination of the causes of hypoxia difficult. As a consequence, process-based or statistical models have played an important role in interpolating across missing data and interpreting observations (Scavia and Donnelly, 2007). Scavia et al. (2003, 2004) and Turner et al. (2005) suggest that historical nitrogen loads were not sufficient to produce significant areas of oxygen-depleted bottom waters before the mid-1970s. They also examined the response of the model to the 30 percent nitrogen load reduction recommended in the Action Plan and concluded that a 40 to 45 percent reduction might be necessary to achieve the goal of reducing the extent of hypoxia to 5000 km2 or less. More recently, Scavia and Donnelly (2007) used data from the 2001 USGS survey to conclude that if phosphorus is now the element limiting algal growth in the Gulf, it became so because of large increases in nitrogen loads during the 1970s and 1980s. Their model suggests that nitrogen load reductions of 37 to 45 percent or phosphorus load reductions of 40 to 50 percent below the 1980–1996 average are needed to meet the remediation goals set by the task force. However, the authors caution that a phosphorus-only strategy is potentially dangerous and suggest it would be prudent to reduce both nutrients. The recent expansion of corn production to produce ethanol will make the task of meeting the goal of reducing hypoxia considerably more difficult. Donner and Kucharik (2008) used modeling to examine the effect of present and future expansion of corn-based ethanol production on nitrogen export by the Mississippi and Atchafalaya Rivers to the Gulf of Mexico. Their results show that the increase in corn cultivation required to meet the goal of 15–36 billion gallons of renewable fuels by 2022 suggested by the 2007 energy policy bill would increase the annual average flux of dissolved inorganic nitrogen export by the Mississippi and Atchafalaya Rivers by 10 to 34 percent. |
excess phosphorus will build up in the soil. As with synthetic fertilizers, excess application of manure to cropland would lead to NO3– leaching to ground water and nutrient runoff with soil to surface water. In addition, zoonotic pathogens present in manure can impair water quality and pose a public health concern.
Pesticides used in agriculture pose another threat to water quality because they can migrate off the farm and into water and the food chain. Chemicals present in soil might dissolve into the soil solution, partition into a gas phase, absorb to soil solids, or undergo chemical or biological transformation depending on their properties. The USGS National Water-Quality Assessment (NAWQA) Program represents the most comprehensive national-scale analysis to date of pesticide occurrence and concentrations in streams and ground water of the United States (Gilliom et al., 2006). Their decade-long survey (1992–2001) involved assessments of 75 pesticides and 8 degradation products in surface water, ground water, and sediments in 51 U.S. major river basins and aquifer systems. At least one pesticide was detected in water from all streams studied, and pesticide compounds were detected throughout most of the year in water from streams with agricultural, urban, or mixed-land-use watersheds. Organochlorine pesticides (including dichlorodiphenyltrichloroethane, or DDT, which has been banned for most uses since 1972) and their degradation byproducts were found in fish and bed-sediment samples from most streams in agricultural, urban, and mixed-land-use watersheds, and in more than half the fish from streams with predominantly undeveloped watersheds. Pesticides were less common in ground water than in streams. They were found most frequently in shallow ground water beneath agricultural and urban areas, where more than 50 percent of wells contained one or more pesticide compounds. Detections were often at low concentrations, and NAWQA personnel estimated that less than 10 percent of their monitored stream sites and about 1 percent of wells surveyed had concentrations greater than levels deemed to be high enough to affect human health.
Occurrence of antibiotics and hormones from agricultural sources in soil and water is another concern (Arikan et al., 2008; Kemper, 2008). A large proportion of antibiotics added in animal feed is excreted in urine and manure, and the antibiotics will end up in soil and possible surface and ground water if that urine and manure is applied to cropland (Kumar et al., 2005). However, little is known about the fate of antibiotics and hormones from agricultural sources in the environment and any impacts that they might have on plants, wildlife, and humans (Shore and Pruden, 2009).
Air Quality
In 2006, agriculture was responsible for 6.4 percent of the total greenhouse gas emissions in the United States (EPA, 2008). Greenhouse gas emissions from the agricultural sector are dominated by nitrous oxide (N2O) from such soil management activities as fertilizer use, manure application, and growing of nitrogen-fixing crops, and by methane (CH4) from enteric fermentation of ruminant animals. The agricultural sector is the largest contributor to N2O and CH4 emissions, both with higher global warming potential,6 than CO2 in the United States (Figures 2-10 and 2-11).
6 | The global warming potential of a gas is the warming caused over a 100-year period by the emission of one ton of the gas relative to the warming caused over the same period by the emission of one ton of CO2. The global warming potential of CO2, CH4, and N2O are 1, 25, and 298, respectively (B. Chameides, 2009, as explained at http://www.nicholas.duke.edu/thegreengrok/co2equivalents). |
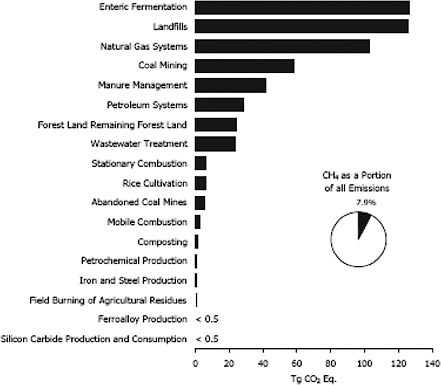
FIGURE 2-10 Methane emission from different sources in the United States.
SOURCE: EPA (2008).
Other than greenhouse gases, farms release particulate matter that can affect human health (Aneja et al., 2008). Airborne particulate matter associated with agricultural activities has been gradually decreasing since the Dust Bowl era. With federal air quality standards as a guide, the problems have been generally divided by particle size and the number of days per year above standards for the size category. Larger particle sizes (categorized as PM10, that is, particulate matter with an aerodynamic diameter of less than 10 μm) are primarily caused by blowing soil particles in seasonally dry areas where farmers maintain a seasonally “clean fallow” and by burning crop residues where the practice is used. In the dryland areas of wheat production on the eastern side of the Cascades and in portions of the Great Plains, clean fallow for moisture conservation has long been practiced. That leads to occasional high wind-blown soil erosion with increasingly unacceptable air quality problems (Sharratt and Lauer, 2006). The new programs for crop rotation, weed and disease control, and reduced-till planting in this wheat-growing area are promising (Schillinger et al., 2007).
Soil Quality
Soil quality can be degraded from physical, chemical, and biological sources. Physical soil degradation includes soil erosion, breakdown of soil structure, soil compaction, reduction in water infiltration and increased runoff, anaerobiosis, and desertification (Lal,
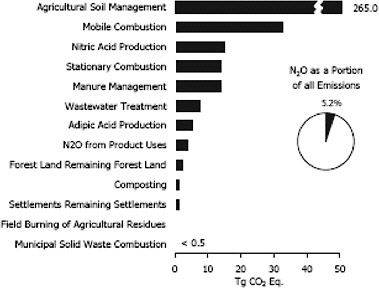
FIGURE 2-11 Nitrous oxide emission from different sources in the United States. SOURCE: EPA (2008).
2004). The soil loss through wind and water erosion has particularly long-term ecological and economical effects by reducing the overall productivity of agricultural lands and by impacting water quality, water supplies, navigation, and irrigation infrastructures. Chemical soil degradation includes salinization, nutrient depletion, acidification, contamination, and toxification from pesticides and excessive fertilization (NRC, 1993a).
Biological soil degradation includes a decline in biodiversity and soil carbon and an increase in soil-borne pathogens (Lal, 2004). Soil organisms contribute to the maintenance of soil quality and control many key processes, such as decomposition of plant residue and organic material, nitrogen fixation, and nutrient availability (Kennedy and Papendick, 1995). However, compared to physical and chemical soil degradation, little is known about how agricultural activities alter soil biological properties and how they affect soil functioning (Heimlich, 2003).
Modern agriculture’s production of a few species of crops (and crops separated from livestock production), with limited rotations or crop diversity, runs counter to the natural tendency for more diversity that can result in high-quality soils. Conventional systems “lead, more often than not, to a decrease in soil quality, as indicated by the soil’s ability to infiltrate and hold water, to maintain particle structure for optimal root habitat, and to hold and recycle nutrients. Less-than-optimal soil quality raises production costs in the long term, lowers production potential, and accentuates production variability” (Harwood, 1994, pp. 34–59).
One particular soil quality concern is that of salinization. In many arid zones where irrigation is practiced, salinization of soil can become a chronic problem. It is exacerbated by high water tables where water can wick upward to the surface or flow laterally to lower terrain and evaporate. Salinity poses a major challenge for farming in many arid areas rely-
ing on irrigation to grow crops. Even when relatively good quality water is used, salinity problems can arise whenever ground water levels are shallow enough to allow upward movement and evaporation at the soil surface. Enlightened management practices have to be used for irrigation water management under saline conditions to avoid land loss and crop damage. About 25 percent of irrigated cropland in the United States (14 million acres) is significantly affected by salts in soil and water (Hedlund and Crow, 1994). The worst salinity problems are in the productive San Joaquin Valley of California, which is experiencing loss of land and yield reductions from salinization due to high water tables (USDA-NRCS, 1997). Some 850,000 acres of the San Joaquin Valley’s 2.5 million irrigated acres are affected by inadequate drainage and accumulating salts. The problem is exacerbated by the fact that the valley is a closed drainage basin with no current legal means for exporting drainage from the region. Land is lost each year due to surface accumulation of seepage from the higher regions to lower ones (San Joaquin Valley Drainage Program, 1990).
Saline soils are not limited to irrigated areas. Mineral weathering and dissolution of cretaceous shale occur over a large portion of the arid West. Saline seeps occur when water that exceeds plant requirements percolates unchecked below the root zone, then moves laterally downhill and emerges in a seep area. Those seeps frequently occur where farmers practice wheat fallow rotations. Seeps have affected about 500,000 acres of cropland in the Great Plains from Montana to Texas and some 2.5 million acres for all land uses (Brown et al., 1982).
Reduced Genetic Diversity
Large-scale farming systems, the need to feed large numbers of people, the globalization of markets, and loss of wild habitats as a result of land conversions have resulted in a dramatic reduction in crop genetic diversity throughout the world. The National Research Council documented those trends more than three decades ago in the report Genetic Vulnerability of Major Crops (1972). According to the Food and Agriculture Organization (FAO) of the United Nations (FAO, 1998), 75 percent of agricultural biological diversity was lost during the 20th century. Modern crop varieties have supplanted traditional varieties or landraces for over 70 percent of the world’s corn, 75 percent of the Asian rice, and half of the wheat in Africa, Latin America, and Asia (Picone and Van Tassel, 2002).
The loss of genetic diversity in agriculture reduces the genetic material available for future use by farmers and plant breeders. In addition, genetic evolutionary processes that lead to the development of new genes and gene combinations might be curtailed. The increase in genetic uniformity within a crop can also lead to greater genetic vulnerability to pest and diseases (NRC, 1972, 1993b). More than the loss of a particular variety or land-race, however, the greatest concern is the irreversible loss of genes within plant gene pools that are critical for breeding. Much of the yield increase, resistance to biotic and abiotic constraints, and adaptation to poor soils, drought, or low temperatures in modern crops is a result of genes from traditional varieties. The ability of crops to adapt to future cropping systems and climate change will depend on access to genetic variation.
Not all breeding efforts, however, have led to reduced genetic diversity. The NRC study Agricultural Crop Issues and Policies (1993b) found that genetic diversity of U.S. wheat and corn has increased since the 1970s, in part because of efforts to breed in greater genetic diversity. However, the genetic uniformity of rice, beans, and many minor crops is still of concern. Since that study, the development and wide-scale adoption of genetically engineered crops (principally corn and soybean) have led to further concerns about the genetic homogenization of crops across large areas within the United States and worldwide. In ad-
dition, the potential contamination of landraces by transgenic varieties growing in the same region, as observed in maize landraces growing in farmers’ fields in Mexico, is a concern (Pineyro-Nelson et al., 2009).
Similar to plant breeding, confinement livestock production systems have been associated with a decrease in the numbers of minor breeds and accelerated the development of genetically similar hogs, poultry, and beef and dairy cattle as a result of selective breeding by humans. Because large processing plants require a steady flow of uniform animals and bird types to achieve economies of scale (RTI International, 2007), uniformity in animals is achieved by controlling their genetics and length of feeding period (MacDonald and McBride, 2009). Genetic diversity is necessary for sustained genetic improvements of farm animals in the future and for rapid adaptation to changes in breeding objectives (Notter, 1999).
Much of the world’s plant germplasm is stored in repositories in the United States in the USDA National Plant Germplasm System, the International Agricultural Research Centers, and other public and private collections. Likewise, animal germplasm is managed by the USDA National Animal Germplasm Program, which was initiated in 1999. Although there has been significant progress in collecting and conserving crop and animal germplasm, a number of problems remain; for example, collections were not adequately documented and seed and propagule viability is reduced as a result of improper storage (Plucknett, 1987; Blackburn, 2006). There has also been considerable discord on who owns, controls, and benefits from germplasm collections.
To slow or prevent the loss of crop genetic diversity worldwide and provide for the fair sharing of benefits arising from the use of genetic resources, a number of international agreements have been developed to encourage preservation of genetic diversity and to promote the exchange of germplasm. The most important is the International Treaty on Plant Genetic Resources for Food and Agriculture, which entered into force in June 2004. The treaty, of which the United States is a signatory, is a comprehensive international agreement that aims at guaranteeing food security through the conservation, exchange, and sustainable use of the world’s plant genetic resources, as well as fair use and equitable benefit-sharing. It also recognizes farmers’ rights to freely access genetic resources and to use and save seeds under national laws. The treaty implements a multilateral system of access to 64 of the most important food and forage crops essential for food security and interdependence for countries that ratified the treaty. Progress towards implementation of the treaty has been slowed by lack of consensus among the treaty parties on the value of particular genetic resources, and consequently many of the treaty’s provisions are vague (Day-Rubenstein et al., 2005).
Economic Concerns
Farm Sector Profitability and Rising Input Costs
The estimated value of U.S. gross farm income has increased by 31 percent in real terms since 1970 (Figure 2-12). However, the aggregate value of net farm income received by farmers has not changed dramatically over the last 40 years. In essence, increases in gross farm receipts have generally been cancelled out by increases in the costs of production. For example, U.S. farms sold $324 billion in agricultural products in 2008 (up 65 percent from 1998 values in nominal dollars) but incurred $291 billion in production expenses, including $204 billion in purchased inputs (an increase of 57 percent and 73 percent since 1998, respectively). Much of the increase in purchased input costs was related to the rising prices
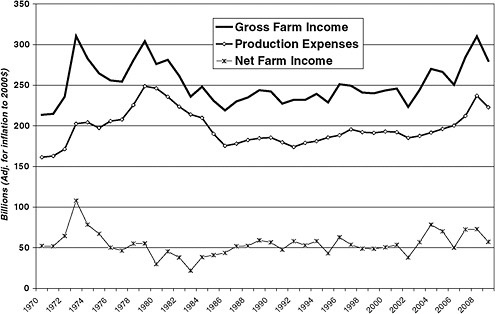
FIGURE 2-12 U.S. aggregate gross farm income, production expenses, and net farm income from 1970 to 2009 (expressed in constant 2000 dollars).
NOTES: Gross farm income includes estimated value of total farm production plus direct government payments. Production expenses include all purchased inputs and payments to stakeholders (payment to stakeholders includes hired labor, rental payments to nonoperator landlords, and payment of real estate interest and other interests. Net farm income is the result of subtracting production expenses from gross farm income.
DATA SOURCE: USDA-ERS (2009d).
of fuel and synthetic fertilizer, which were affected by crude oil prices that rose from an average price of about $12 per barrel in 1998 to $95 in 2008 (EIA, 2009). Annual farm product market gyrations are normal, but the potential effect of rising production costs, especially for fuel and fertilizers, could have a long-term impact on farm productivity, farm income, and increasing food prices.
Statistics on the aggregate profitability of the U.S. farm sector disguise considerable variation in the economic performance of individual farms. For example, in 2007, only 47 percent of all U.S. farms reported positive net farm income, a drop from 57 percent of all farms in 1987. Most farms that lost money were relatively small operations that relied principally on nonfarm sources of income. Most farms in the United States are essentially family businesses that rely mainly on farm family members for their labor force (Gasson and Errington, 1993; Hoppe et al., 2007), and the majority of farm families also gain income from off-farm work. Nonfarm work or transfer payments are commonly used to supplement income from the farm business. The proportion of farm operators who work off-farm increased from 44 percent in 1979 to 52 percent in 2004. The proportion of spouses working off-farm grew from 28 percent to 45 percent during the same period (Fernandez-Cornejo et al., 2007). The contribution of off-farm income to the total household income of U.S. farm-
ers rose from about 50 percent in 1960 to more than 80 percent in 2004 (Fernandez-Cornejo et al., 2007).
Table 2-1 reported the percent of U.S. net cash farm income that was received by different types of farms. The data suggest that almost 80 percent of total U.S. net cash farm income went to farms with gross sales over $500,000 in 2007, while just 7 percent of total U.S. net farm income was shared by the 87 percent of farms that had gross sales under $250,000. Internal variations in the rate of return for different types of U.S. farms help explain why so many individual farmers report increasingly difficult economic stress at the same time that the performance of the overall farm sector appears to be relatively stable.
Producers of different commodities also report different levels of profitability. Table 2-3 reported data from the 2007 Census of Agriculture aggregated by the type of commodity that provides the majority of income to each farm. In general, the results suggest that crop farms generate higher average profit margins than do livestock operations. The worst performing commodity sectors are cattle feedlots and beef cattle ranching (which averaged less than a 10 percent return) and sheep, goat, aquaculture, and mixed livestock farms (which registered negative net income overall).
The profitability of many U.S. farms is partly determined by the level of federal government program payments. For example, in 2008, direct government payments totaled $12 billion, which accounted for 3.7 percent of total gross farm receipts and 13.9 percent of net farm income in the United States. Over the past 10 years, however, government payments have tended to be significantly higher than before, averaging roughly 7 percent of gross farm returns and 27 percent of net farm income.
The distribution of government payments across different segments of the farm sector varies widely (see Tables 2-1 and 2-3). According to data collected by the Census of Agriculture, only 38 percent of farms reported receiving government payments in 2007 (16 percent participated in conservation programs like the Conservation Reserve Program, Wetlands Reserve Program, and Conservation Reserve Enhancement Program; 2 percent received a loan from the Commodity Credit Corporation; and 31 percent participated in other federal farm programs). The farms that receive the bulk of government farm program payments raise cash grains that are eligible for non-recourse production loans, price supports, and other commodity programs. Government program payments are much more common among farms in the Midwest and Great Plains (where over two-thirds of farms in North Dakota, Iowa, Illinois, South Dakota, Nebraska, Minnesota, and Kansas received government program payments in 2007).
Loss of Mid-Sized Commercial Family Farms
Reduced and more volatile farm income can affect the economic vitality of individual farm households and rural communities.7 Indeed, declining rates of return for individual farms have been linked to changes in the size structure of U.S. farms (Hallam, 1993; Gardner, 2002). Table 2-4 shows the percent of farms and farm sales that were produced by different-sized farms from 1997 to 2007. Mid-sized farm sales categories ($10,000–$249,999) are declining in importance, while small farms have increased in number and large farms
TABLE 2-3 Distribution of Farm Income and Estimated Profit Margins by Farm Commodity Type
NAICS Farm Type (Majority of Income from Commodity) | Gross Farm Sales and Government Payments (Billion $) | % Total | Net Cash Farm Income from Operations (Billion $) | % Total | Crude Profit Margin (Net/Total) | Value of Government Payments Billion $) | % Total | Crude Percent Return (Without Government Payments) |
Crop Farms |
|
|
|
|
|
|
|
|
Oilseed and grain farming | 78.6 | 25.8 | 28.7 | 38.4 | 36.5 | 4.052 | 50.7 | 33.0 |
Vegetable and melon farming | 15.1 | 4.9 | 4.5 | 6.0 | 29.6 | 0.092 | 1.1 | 29.2 |
Fruit and tree nut farming | 18.4 | 6.0 | 5.0 | 6.6 | 26.9 | 0.059 | 0.7 | 26.7 |
Greenhouse, nursery, and floriculture production | 17.0 | 5.6 | 4.7 | 6.3 | 27.5 | 0.025 | 0.3 | 27.4 |
Other crop farminga | 19.3 | 6.3 | 5.3 | 7.1 | 27.6 | 2.244 | 28.1 | 18.1 |
Specialty crop farms (combined)b | 50.5 | 16.5 | 14.1 | 18.9 | 27.9 | 0.175 | 2.2 | 27.7 |
All crop farms | 148.4 | 48.6 | 48.1 | 64.5 | 32.4 | 6.471 | 81.1 | 29.3 |
Livestock Farms |
|
|
|
|
|
|
|
|
Poultry and egg production | 37.9 | 12.4 | 8.7 | 11.6 | 22.9 | 0.060 | 0.7 | 22.8 |
Dairy cattle and milk production | 35.1 | 11.5 | 10.6 | 14.2 | 30.1 | 0.312 | 3.9 | 29.5 |
Cattle feedlots | 30.4 | 9.9 | 3.0 | 4.0 | 9.8 | 0.103 | 1.3 | 9.5 |
Beef cattle ranching and farming | 28.4 | 9.3 | 2.6 | 3.5 | 9.2 | 0.823 | 10.3 | 6.5 |
Hog and pig farming | 18.2 | 6.0 | 2.9 | 3.9 | 16.0 | 0.109 | 1.4 | 15.5 |
Animal aquaculture and other animal production | 6.4 | 2.1 | –0.9 | –1.3 | –14.8 | 0.082 | 1.0 | –16.3 |
Sheep and goat farming | 0.6 | 0.2 | –0.3 | –0.4 | –52.8 | 0.026 | 0.3 | –59.9 |
All livestock farms | 156.8 | 51.4 | 26.5 | 35.5 | 16.9 | 1.513 | 18.9 | 16.1 |
Total | 305.2 | 100.0 | 74.6 | 100.0 | 24.4 | 7.984 | 100.0 | 22.4 |
aIncludes tobacco, cotton, sugarcane, and other mixed crops. bSubtotal that includes farms that receive most income from sale of vegetables, melon, fruit, treenut, greenhouse, nursery, and floriculture products. SOURCE: 2007 Census of Agriculture. | ||||||||
TABLE 2-4 Changing Size Structure of U.S. Farms, 1997–2007
Farm Sales Class | Percent of U.S. Farms | Percent of U.S. Farm Sales | ||||||
1997 | 2002 | 2007 | Gain-Loss | 1997 | 2002 | 2007 | Gain-Loss | |
< $10,000 | 55.3 | 59.3 | 59.8 | +4.5 | 1.7 | 1.4 | 0.9 | –0.8 |
$10,000–$99,999 | 28.7 | 26.0 | 24.0 | –4.8 | 11.3 | 9.8 | 6.2 | –5.1 |
$100,000–$249,999 | 8.6 | 7.5 | 6.7 | –1.9 | 15.1 | 12.7 | 8.1 | –7.0 |
$250,000–$499,999 | 4.1 | 3.8 | 4.2 | +0.1 | 15.8 | 14.2 | 11.2 | –4.6 |
$500,000+ | 3.2 | 3.3 | 5.3 | +2.1 | 56.1 | 61.9 | 73.5 | +17.4 |
SOURCE: U.S. Census of Agriculture, 2007 (USDA-NASS, 2009). | ||||||||
have rapidly increased their share of total U.S. farm production value. A number of farm and rural advocacy organizations have decried the loss of independent, moderate-scale commercial family farms, which are viewed as important foundations for rural community life, small business entrepreneurial innovation, and a wide range of “agrarian” values (Strange, 1988; Wirzba, 2003; Kirschenmann et al., 2008).
Social Concerns
Environmental degradation and the debate of food versus fuel represent two of many social concerns facing modern agriculture. Others concerns focus on social issues, including labor justice and health, food quality and safety, animal welfare, and community well-being.
Labor Concerns
Hired farm workers contribute to maintaining high agricultural productivity by providing labor during critical periods of time (for example, harvest). Yet, they continue to be one of the most economically disadvantaged groups in the United States (USDA-ERS, 2009d). In 2006, hired farm workers were paid an average of $9.87 per hour but that average includes wages of managers and supervisors. The median wage for nonsupervisory hired farm labor was $6.75 per hour, which is among the lowest wages paid for a typical unskilled occupation. Furthermore, many farm workers are only employed seasonally (USDA-ERS, 2009d).
The health and safety of farm workers and their families is another concern. Das et al. (2001) found pesticide-related illness is an important cause of acute morbidity among migrant farm workers in California. A few categories (organophosphates and carbamates, inorganic compounds, and pyrethroids) account for over half of the cases of acute illness. Studies have documented the presence of pesticide metabolites in children of farm workers because the pesticides were carried home by the workers on their clothes (Coronado et al., 2004; Arcury et al., 2007). Some studies suggest that exposure to agricultural pesticides could result in cancers and dermatological, neurological, mental, and reproductive effects (Dich and Wiklund, 1998; Villarejo et al., 2000; Das et al., 2001; Pearce and McLean, 2005; Eskenazi et al., 2007).
Food Quality and Safety
A recent survey indicated that safety, nutrition, and taste are among the most important food attributes to American consumers (Lusk and Briggeman, 2009). Halweil (2007)
suggested that modern plant breeding has been able to nearly triple the per-acre yield of grains, vegetables, and fruits, but that the increases in size and yield have diluted the crops’ nutritional quality and flavor. He reviewed published literature and suggested that the concentrations of essential minerals such as zinc and iron in fruits, grain, and vegetables have been declining over time. Other than Halweil’s metaanalysis, most studies on nutritional quality and flavor of crops focus on the effect of cultivar (Koudela and Petkikova, 2007, 2008) and farming practices (Magkos et al., 2003; Mäder et al., 2007) or storage and processing of produce on those qualities.
Pesticide residue in food is a concern of many consumers (Tucker et al., 2006), even though the Food and Drug Administration (FDA) has been monitoring pesticide residue in food since 1993. FDA concluded that levels of pesticide residues in the U.S. food supply are overwhelmingly in compliance with EPA’s permitted pesticide uses and tolerances (FDA, 2009). Given the level of compliance with respect to pesticide use, a more serious food safety concern appears to be food-borne illnesses. Mead et al. (1999) estimated that food-borne diseases cause approximately 76 million illnesses, 325,000 hospitalizations, and 5,000 deaths in the United States each year. More than 200 known diseases are transmitted through food and contamination of food-borne pathogens that can occur in various stages of production and processing (Oliver et al., 2009). Food safety begins with the soil, plant, or animal. Manure is a principal source of enteric pathogens on the farm (Doyle and Erickson, 2008). Fecal contamination of crops and of animal products at harvest can spread pathogenic organisms to humans. Enteric pathogens from parent flocks of poultry can be transmitted to progeny (Methner et al., 1995; Cox et al., 2000), as in the case of eggs. Therefore, food safety concerns need to be addressed in ways that consider not only postharvest handling and processing, but also how food is produced on the farm.
Food Security Concerns
Although the U.S. farm sector consistently produces vastly more crop and livestock products than required to meet the basic nutritional needs of U.S. citizens, a significant number of Americans still suffer from malnutrition or hunger each year. The USDA Economic Research Service (ERS), for example, estimates that 11.1 percent of U.S. households (or 13 million households) are food insecure in that they do not have enough access to food at all times for an active healthy life for all household members (Nord et al., 2008). In addition, an estimated 833 million people in developing countries are considered food insecure (Shapouri et al., 2009).
While production of an adequate amount of food is a necessary prerequisite to solving food insecurity (by ensuring a sufficient supply of food products and by keeping the cost of food down), most scholars argue that other factors are important contributors to the problem. Specifically, many households lack sufficient income to afford to buy even low-priced foods. Although farm production cost affects the price of food, it is one of many components of food price in the market place. Some households live in so-called “food deserts” that do not have ready access to grocery stores or other sources of balanced, fresh, and nutritious food products. Setting up farmers’ markets in those neighborhoods could potentially alleviate that problem (IOM and NRC, 2009). Domestic and international food insecurity is also aggravated by volatility in farm commodity prices associated with climate variability, shifts in global market supply and demand conditions, and competition for agricultural commodities from the bioenergy sector.
Animal Welfare Concerns
Consumers’ concern about animal welfare is not a new phenomenon, but pressures from consumer groups and supply chain management companies have prompted increased attention on animal health and welfare (Mitchell, 2001; Johnson, 2009). Concerns about animal welfare include animal housing, access to food and water, health (and disease management), and behavior (Keeling, 2005).There is an increasing awareness among consumer groups about some animal-rearing practices (Petherick, 2007) and concerns among animal scientists of tradeoffs in animal health and welfare that are associated with alternative systems (Mench, 2008), such as in organic systems where antibiotic use is prohibited.
Community Well-Being
The idea that rural towns surrounded by small family farms provide the bedrock of strong democratic values and community life has been a powerful image in American culture (Wirzba, 2003). Similarly, as society has become less rural and agrarian, and as agricultural operations have increased in size and scale, there have been repeated concerns expressed about possible negative effects on the social and economic welfare of communities (Lobao and Meyer, 2001; Berry, 2004). Observers have linked the process of farm consolidation, increased specialization and mechanization, and growing vertical integration to the slow erosion of traditional rural community life and the decline of farm-dependent community economies. More recently, scholars have pointed to the consolidation of the larger agrifood system and the increased importance of vertical economic relationships (as opposed to horizontal linkages among local firms) as a source of some community problems.
Most empirical research on this topic has focused on comparing the social and economic linkages between large versus small farms and their surrounding communities. Lobao and Stofferahn (2008, p. 223) recently reviewed more than 50 empirical studies of the impact of industrialized farming systems on local communities. They note that socioeconomic impacts can reflect both direct effects “through the quantity of jobs produced and the earnings quality of those jobs; by the extent to which these farms purchase inputs and sell outputs locally” and indirect effects where the structure of the farm labor force and farm purchasing patterns can affect “total community employment, earnings, and income (for example, economic multiplier effects); the local poverty rate; and the level of income inequality.” They report that the majority of studies (57 percent) found negative effects of industrialized agriculture on community well-being, 25 percent found mixed impacts, and 18 percent found no significant impacts.
Generally speaking, individual-level studies and regional models demonstrate that the net effect of farm size changes on local farm-related economic activity appears to depend more on trends in the overall volume of farming activity (for example, total regional livestock inventories or acreages devoted to certain crops) than on the size distribution of farms per se. In addition, the direct and indirect economic impacts of farm input purchases from and sales to local businesses appear to generate less total aggregate economic activity than the total amount of net farm income among farm households (Dobbs and Cole, 1992). That evidence suggests that maintaining farm profitability is a critical link to ensuring that farm dollars circulate in the local economy. By contrast, in a study of dairy farms in Austria, Kirner and Kratochvil (2006) found that larger farms generated more net income per unpaid family work unit, but argued that smaller farms exhibited greater enterprise diversification and as a result generally contributed more to the regional economy. Despite
disputes about how to achieve strong community agricultural connections, there is a growing interest in finding ways to maintain a local and robust agricultural sector that has strong community ties.
Community Health and Quality of Life
Although some farming operations can improve the aesthetics of the landscape, others such as large-scale confined animal feeding operations (CAFOs) can negatively affect the health and quality of life in nearby neighborhoods (Wing et al., 2008). Wing and Wolf (2000) found residents in the vicinity of hog operations in eastern North Carolina reported increased occurrences of headaches, runny nose, sore throat, excessive coughing, diarrhea, and burning eyes as compared to residents of the community with no intensive livestock operations. Quality of life, as indicated by the number of times residents could not open their windows or go outside even in nice weather, was similar in the control and the community in the vicinity of the cattle operation but greatly reduced among residents near the hog operation. Respiratory and mucous membrane effects were consistent with the results of studies of occupational exposures among swine confinement-house workers and previous findings for neighbors of intensive swine operations.
Horrigan et al. (2002) suggested that the proliferation of large-scale confinement animal agriculture creates environmental and public health concerns, including pollution from the high concentration of animal wastes and the extensive use of antibiotics, which may compromise their effectiveness in medical use. Using antibiotics to treat animals with clinical infections has undoubtedly contributed to improving the health and welfare of farm animals over the years. Therapeutic use of antibiotics reduces the economic losses endured by farmers as a result of animal sickness and death. Antibiotics have been used subtherapeutically to promote growth, improve feed efficiency, and reduce incidence of certain diseases (Doyle, 2001). The effect of antibiotics as a growth promoter of agricultural animals was discovered in 1940s (Castanon, 2007). FDA approved the use of certain antibiotics in animal feed in 1951. The antimicrobial drugs permitted for use in food animal production represent all major classes of clinically important drugs (Silbergeld et al., 2008).
The accumulation of antibiotic-resistant bacteria as a result of antibiotic use in agricultural animals has been documented (Teuber, 2001). A preliminary study by Chander et al. (2008) showed that antibiotic-resistant bacteria are more prevalent in turkey farms that use antibiotics subtherapeutically compared to those that do not use antibiotics. The European Union withdrew approval for antibiotics as growth promoters in poultry feeds out of concern for development of antimicrobial resistance and about transference of antibiotic resistance genes from animal to human microbiota (Castanon, 2007).
SYSTEMS APPROACH TO IMPROVING THE SUSTAINABILITY OF AGRICULTURE
U.S. agriculture has been meeting the demands of higher production (Cassman and Liska, 2007), but with unintended costs as discussed above. At the same time, land-grant university research and farmer or practitioner experiences have improved the knowledge and understanding of how to improve yield and reduce agriculture’s impact on the environment and resource use. The accumulated knowledge has led to actions being taken that suggest promising directions to pursue for enhanced sustainability in farming systems.
The research on the application of approaches that improve sustainability of agriculture suggests that agriculture has the potential to meet the demand of food, feed, and fiber; reduce its environmental footprint; and address other social concerns such as animal wel-
fare and labor justice, but gaps in understanding remain. For example, how the collective actions of a number of farms could improve sustainability on a landscape scale is not well studied. Filling those gaps of understanding will require innovative new approaches, in particular in the realms of complex systems science and management as applied to agro-ecosystems, and a better understanding of economic and social outcomes of the farming approaches.
SUMMARY
U.S. agriculture has celebrated much success in the last 50 years as farmers continue to increase productivity on about the same acreage of farmland and increase energy efficiency in their production systems. However, agricultural sustainability is characterized by not only productivity and efficiency, but also by its impact on the environment and natural resource base, its economic vitality, and the quality of life of farmers and society as a whole. Although many farming practices, technologies, and approaches have improved one or two aspects of sustainability, they might have unintended negative effects on the other aspects of sustainability. As awareness on the importance of balancing the four sustainability goals increases, U.S. agriculture is at a pivotal point that can change the trajectory of farming toward improved sustainability by increasing understanding of the interactions and net impact of combinations of practices and approaches at the farm level and the collective actions of a number of farms on the landscape level.
REFERENCES
Arikan, O.A., W. Mulbry, and C. Rice. 2009. Management of antibiotic residues from agricultural sources: use of composting to reduce chlortetracycline residues in beef manure from treated animals. Journal of Hazardous Materials 164(2–3):483–489.
American Farmland Trust. 2002. Farming on the edge: sprawling development threatens America’s best farmland. Washington, D.C.: Author.
Andrejczak, M. 2009. Pacific ethanol units joins others in bankruptcy court. Market Watch, May 18, 2009.
Aneja, V.P., W.H. Schlesinger, and J.W. Erisman. 2008. Farming pollution. Nature Geoscience 1(7):409–411.
Arcury, T.A., J.G. Grzywacz, D.B. Barr, J. Tapia, H.Y. Chen, and S.A. Quandt. 2007. Pesticide urinary metabolite levels of children in eastern North Carolina farmworker households. Environmental Health Perspectives 115(8): 1254–1260.
ASABE (American Society of Agricultural and Biological Engineers). 2005. Manure production and characteristics. ASAE Standards (March):20.
Baker, A., and S. Zahniser. 2006. Ethanol reshapes the corn market. Amber Waves 4(2):30–35.
Ball, E. 2005. Ag productivity drives output growth. Available at http://www.ers.usda.gov/AmberWaves/June05/findings/AgProductivity.htm. Accessed on August 31, 2009.
Batie, S. 2008. The sustainability of U.S. cropland soils. In Perspectives on Sustainable Resources in America, R.A. Sedjo, ed. Washington, D.C.: RFF Press.
Berry, W. 2004. The Unsettling of America. 3rd edition. San Francisco: Sierra Club Books.
Blackburn, H.D. 2006. National animal germplasm program: challenges and opportunities for poultry genetic resources. Poultry Science 85:210–215.
Bricker, S.B., C.G. Clement, D.E. Pirhalla, S.P. Orlando, and D.R.G. Farrow. 1999. National estuarine eutrophication assessment: effects of nutrient enrichment in the nation’s estuaries. Silver Spring, Md.: National Oceanic and Atmospheric Administration, National Ocean Service, Special Projects Office and the National Centers for Coastal Ocean Science.
Brown, P.L., A.D. Halvorsen, F.H. Siddoway, H.F. Mayland, and M.R. Miller. 1982. Saline-seep diagnosis, control, and reclamation. Available at http://www.wsi.nrcs.usda.gov/products/W2Q/downloads/Salinity/Saline_Seeps.pdf. Accessed on February 18, 2010.
Browne W.P., J.R. Skees, L.E. Swanson, P.B. Thompson, and L.J. Unnevehr. 1992. Sacred Cows and Hot Potatoes: Agrarian Myths in Agricultural Policy. Boulder, Colo.: Westview Press.
California Department of Finance. 2007. Population projections by race/ethnicity for California and its coun-
ties 2000–2050. Available at http://www.dof.ca.gov/html/DEMOGRAP/ReportsPapers/Projections/P1/P1.asp. Accessed on June 8, 2009.
Carter, T.R., M. Hulme, J.F. Crossley, S. Malyshev, M.G. New, M.E. Schlesinger, and H. Uomenvirta. 2000. Climate change in the 21st century: interim characterizations based on the new IPCC emissions scenarios. The Finnish Environment 433:148.
Cassman, K.G., and A.J. Liska. 2007. Food and fuel for all: realistic or foolish? Biofuels Bioproducts & Biorefining-Biofpr 1(1):18–23.
CAST (Council for Agricultural Science and Technology). 1999. Animal Agriculture and Global Food Supply. Ames, Iowa: Author.
Castanon, J.I.R. 2007. History of the use of antibiotic as growth promoters in European poultry feeds. Poultry Science 86(11):2466–2471.
CENR (Committee on Environment and Natural Resources). 2000. Integrated Assessment of Hypoxia in the Northern Gulf of Mexico. Washington, D.C.: National Science and Technology Council.
Chameides, B. 2009. Climate change: what is equivalent to “CO2 equivalents”? Available at http://www.nicholas.duke.edu/thegreengrok/co2equivalents. Accessed on February 19, 2010.
Chander, Y., S.C. Gupta, K. Kumar, S.M. Goyall, and H. Murray. 2008. Antibiotic use and the prevalence of antibiotic resistant bacteria on turkey farms. Journal of the Science of Food and Agriculture 88(4):714–719.
Cochrane, W. 1979. The Development of American Agriculture: A Historical Analysis. St. Paul: University of Minnesota Press.
Colaizzi, P.D., P.H. Gowda, T.H. Marek, and D.O. Porter. 2009. Irrigation in the Texas High Plains: a brief history and potential reductions in demand. Irrigation and Drainage 58(3):257–274.
Collins, K. 2008. The role of biofuels and other factors in increasing farm and food prices. Available at http://www.foodbeforefuel.org/files/Role%20of%20Biofuels%206–19-08.pdf. Accessed on June 8, 2009.
Coronado, G.D., B. Thompson, L. Strong, W.C. Griffith, and I. Islas. 2004. Agricultural task and exposure to organo-phosphate pesticides among farmworkers. Environmental Health Perspectives 112(2):142–147.
Cox, N.A., M.E. Berrang, and J.A. Cason. 2000. Salmonella penetration of egg shells and proliferation in broiler hatching eggs—a review. Poultry Science 79(11):1571–1574.
Cromartie, J., and S. Bucholtz. 2008. Defining the “rural” in rural America. Amber Waves 6(3):28–34.
Das, R., A. Steege, S. Baron, J. Beckman, and R. Harrison. 2001. Pesticide-related illness among migrant farm workers in the United States. International Journal of Occupational and Environmental Health 7(4):303–312.
Day-Rubenstein, K., P. Heisey, R. Shoemaker, J. Sullivan, and G. Frisvold. 2005. Crop Genetic Resources: An Economic Appraisal. Washington, D.C.: U.S. Department of Agriculture Economic Resource Service.
Dennehy, K.F. 2000. 2009. High Plains regional ground-water study: U.S. Geological Survey fact sheet FS-091-00. Available at http://co.water.usgs.gov/nawqa/hpgw/factsheets/DENNEHYFS1.html. Accessed on August 12, 2009.
Dewbre, J., C. Giner, W. Thompson, and M. Von Lampe. 2008. High food commodity prices: will they stay? Who will pay? Agricultural Economics 39(3):393–403.
Diaz, R.J., and R. Rosenberg. 2008. Spreading dead zones and consequences of marine ecosystems. Science 321: 926–929.
Dich, J., and K. Wiklund. 1998. Prostate cancer in pesticide applicators in Swedish agriculture. The Prostate 34: 100–112.
Diffenbaugh, N.S., C.H. Krupke, M.A. White, and C.E. Alexander. 2008. Global warming presents new challenges for maize pest management. Environmental Research Letters 3(4).
Dobbs, T.L., and J.D. Cole. 1992. Potential effects on rural economies of conversion to sustainable farming systems. American Journal of Alternative Agriculture 7(1/2):70–80.
Doering, O. 2008. Biofuel Implications for Agriculture and the Environment. Presentation to the Committee on March 27, 2008, in Kansas City, Missouri.
Donner, S.D., and C.J. Kucharik. 2008. Corn-based ethanol production compromises goal of reducing nitrogen export by the Mississippi River. Proceedings of the National Academy of Sciences 105:4513–4518.
Donohue, M., and D.L. Cunningham. 2009. Effects of grain and oilseed prices on the costs of US poultry production. Journal of Applied Poultry Research 18(2):325–337.
Doyle, M.E. 2001. Alternatives to antibiotic use for growth promotion in animal husbandry. Available at http://fri.wisc.edu/briefs/antibiot.pdf. Accessed on July 14, 2009.
Doyle, M.P., and M.C. Erickson. 2008. Summer meeting 2007—the problems with fresh produce: an overview. Journal of Applied Microbiology 105(2):317–330.
Easterling, W.E., P.K. Aggarwal, P. Batima, K.M. Brander, L. Erda, S.M. Howden, A. Kirilenko, J. Morton, J.-F. Soussana, J. Schmidhuber, and F.N. Tubiello. 2007. Food, fibre and forest products. In Impacts, Adaptation and Vulnerability. Contribution of Working Group II to the Fourth Assessment Report of the Intergovern-
mental Panel on Climate Change, M.L. Parry, O.F. Canziani, J.P. Palutikof, P.J.V.D. Linden, and C.E. Hanson, eds. Cambridge: Cambridge University Press.
EIA (Energy Information Administration). 2009. Weekly all countries spot price FOB weighted by estimated export volume (dollars per barrel). Available at http://tonto.eia.doe.gov/dnav/pet/hist_xls/WTOTWORLDw.xls. Accessed on June 30, 2009.
EPA (U.S. Environmental Protection Agency). 2002. A Comprehensive Analysis of Biodiesel Impacts on Exhaust Emissions. Washington, D.C.: Author.
———. 2007. Wadeable Streams Assessment: A Collaborative Survey of the Nation’s Streams. Washington, D.C.: Author.
———. 2008. Inventory of U.S. Greenhouse Gas Emissions and Sinks: 1990–2006. Washington, D.C.: Author.
Eskenazi, B., A.R. Marks, A. Bradman, K. Harley, D.B. Barr, C. Johnson, N. Morga, and N.A. Jewell. 2007. Organo-phosphate pesticide exposure and neurodevelopment in young Mexican-American children. Environmental Health Perspectives 115(5):792–798.
Family Farm Alliance. 2007. Water supply in a changing climate—the perspective of family farmers and ranchers in the irrigated west. Available at http://familyfarmalliance.clubwizard.com/IMUpload/FFA%20Report2.pdf. Accessed on February 18, 2010.
FAO (Food and Agriculture Organization). 1998. Biodiversity of food and agriculture. Available at http://www.fao.org/sd/epdirect/epre0040.htm. Accessed on February 19, 2010.
———. 2008. Soaring Food Prices: Facts, Perspectives, Impacts, and Actions Required. Rome: Author.
Fargione, J., J. Hill, D. Tillman, S. Polasky, and P. Hawthorne. 2008. Land clearing and the biofuel carbon debt. Science 319:1235–1238.
FDA (Food and Drug Administration). 2009. Pesticide residue monitoring program FY2004–2006. Available at http://www.fda.gov/Food/FoodSafety/FoodContaminantsAdulteration/Pesticides/ResidueMonitoringReports/ucm125183.htm. Accessed on July 27, 2009.
Fernandez-Cornejo, J., A. Mishra, R. Nehring, C. Hendricks, M. Southern, and A. Gregory. 2007. Off-farm Income, Technology Adoption, and Farm Economic Performance. Washington, D.C.: U.S. Department of Agriculture Economic Research Service.
Friedland, W., L. Busch, F.H. Buttel, and A.P. Rudy, eds. 1991. Towards a New Political Economy of Agriculture. Boulder, Colo.: Westview Press.
Frisvold, G.B. 2004. How federal farm programs affect water use, quality and allocation among sectors. Water Resources Research 40:W12SO15.
Fuglie, K.O., J.M. MacDonald, and E. Ball. 2007. Productivity Growth in U.S. Agriculture. Washington, D.C.: U.S. Department of Agriculture Economic Research Service.
Gardner, B.L. 2002. American Agriculture in the Twentieth Century: How It Flourished and What It Cost. Cambridge: Harvard University Press.
Gasson, R., and A. Errington. 1993. The Farm Family Business. Wallingford, UK: CAB International.
Gehlhar, M., E. Dohlman, N. Brooks, A. Jerardo, and T. Vollrath. 2007. Global Growth, Macroeconomic Change, and U.S. Agricultural Trade. Washington, D.C.: U.S. Department of Agriculture Economic Research Service.
Gilliom, R.J., J.E. Barbash, C.G. Crawford, P.A. Hamilton, J.D. Martin, N. Nakagaki, L.H. Nowell, J.C. Scott, P.E. Stackelberg, G.P. Thelin, and D.M. Wolock. 2006. The Quality of Our Nation’s Waters: Pesticides in the Nation’s Streams and Ground Water, 1992–2001. Reston, Va: U.S. Geological Survey.
Glauber, J. 2008. Statement of Joseph Glauber, Chief Economist before the Committee on Energy and Natural Resources, United States Senate, on June 12, 2008. Available at http://energy.senate.gov/public/_files/GlauberTestimony061208.pdf. Accessed on April 6, 2010.
Goolsby, D.A., W.A. Battaglin, G.B. Lawrence, R.S. Artz, B.T. Aulenbach, R.P. Hooper, D.R. Keeney, and G.J. Stensland. 1999. Flux and Sources of Nutrients in the Mississippi-Atchafalaya River Basin—topic 3. Silver Spring, Md.: National Oceanic and Atmospheric Administration, National Ocean Service, National Centers for Coastal Ocean Science.
Gray, A.W., and M.D. Boehlje. 2007. The industrialization of agriculture: Implications for future policy. Available at http://ageconsearch.umn.edu/bitstream/6712/2/wp070010.pdf. Accessed on February 19, 2010.
Hallam, A., ed. 1993. Size, Structure, and the Changing Face of American Agriculture. Boulder, Colo.: Westview Press.
Halloran, J.M., and D.W. Archer. 2008. External economic drivers and US agricultural production systems. Renewable Agriculture and Food Systems 23(4):296–303.
Halweil, B. 2007. Still No Free Lunch: Nutrient Levels in U.S. Food Supply Eroded by Pursuit of High Yields. Boulder, Colo.: The Organic Center.
Hart, J.F. 2003. The Changing Scale of American Agriculture. Charlottesville, Va.: University of Virginia Press.
Harwood, R.R. 1994. Managing the living soil for human well-being. In Environment and Agriculture: Rethinking
Development Issues for the 21st Century, S.A. Breth, ed. Morrilton, Ark.: Winrock International Institute for Agricultural Development.
Hatfield, J., K. Boote, P. Fay, L. Hahn, C. Izaurralde, B.A. Kimball, T. Mader, J. Morgan, D. Ort, W. Polley, A. Thomson, and D. Wolfe. 2008. Agriculture. Washington, D.C.: U.S. Climate Change Science Program.
Hedlund, J.D., and S. Crow. 1994. Draft Material on Salinity. Washington, D.C.: U.S. Department of Agriculture Natural Resource Conservation Service
Heimlich, R. 2000. Farm Resource Regions. Washington, D.C.: U.S. Department of Agriculture Economic Research Service.
———. 2003. Agricultural Resources and Environmental Indicators. Washington, D.C.: U.S. Department of Agriculture.
Hendrickson, M., and W. Heffernan. 2007. Concentration of agricultural markets. Available at http://www.nfu.org/wp-content/2007-heffernanreport.pdf. Accessed on December 11, 2009.
Hill, J., E. Nelson, D. Tilman, S. Polasky, and D. Tiffany. 2006. Environmental, economic, and energetic costs and benefits of biodiesel and ethanol biofuels. Proceedings of the National Academy of Sciences 103:11206–11210.
Hoppe, R.A., P. Korb, E.J. O’Donoghue, and D.E. Banker. 2007. Structure and Finances of U.S. Farms: Family Farm Report, 2007 Edition. Washington, D.C.: U.S. Department of Agriculture Economic Research Service.
Hoppe, R.A., P. Korb, and D.E. Banker. 2008. Million-Dollar Farms in the New Century. Washington, D.C.: U.S. Department of Agriculture Economic Research Service.
Horrigan, L., R. Lawrence, and P. Walker. 2002. How sustainable agriculture can address the environmental and human health harms of industrial agriculture. Environmental Health Perspectives 110(5):445–456.
Hutson, S.S., N.L. Barber, J.F. Kenny, K.S. Linsey, D.S. Lumia, and M.A. Maupin. 2004. Estimated Use of Water in the United States in 2000. Reston, Va.: U.S. Geological Survey.
IOM (Institute of Medicine) and NRC (National Research Council). 2009. The Public Health Effects of Food Deserts. Workshop Summary. Washington, D.C.: National Academies Press.
IPCC (Intergovernmental Panel on Climate Change). 2006. Guidelines for National Greenhouse Gas Inventories, Volume 4, Agriculture, Forestry and Other Land Use. Available at http://www.ipccnggip.iges.or.jp/public/2006gl/vol4.html. Accessed on April 24, 2009.
IPCC (Intergovernmental Panel on Climate Change). 2007. Climate Change 2007: Synthesis Report. Contribution of Working Groups I, II and III to the Fourth Assessment Report of the Intergovernmental Panel on Climate Change. Geneva: Author.
Jackson-Smith, D., and J. Sharp. 2008. Farming in the urban shadow: supporting agriculture at the rural-urban interface. Rural Realities 2(4):1–12.
Johnson, A.K. 2009. ASAS centennial paper: farm animal welfare science in the United States. Journal of Animal Science 87(6):2175–2179.
Keeling, L.J. 2005. Healthy and happy: animal welfare as an integral part of sustainable agriculture. Ambio 34(4–5): 316–319.
Kemper, N., H. Färber, D. Skutlarek, and J. Krieter. 2008. Analysis of antibiotic residues in liquid manure and leachate of dairy farms in Northern Germany. Agricultural Water Management 95(11):1288–1292.
Kennedy, A.C., and R.I. Papendick. 1995. Microbial characteristics of soil quality. Journal of Soil and Water Conservation 50(3):243–248.
Kirner, L., and R. Kratochvil. 2006. The role of farm size in the sustainability of dairy farming in Austria: an empirical approach based on farm accounting data. Journal of Sustainable Agriculture 28(4):105–123.
Kirschenmann, F., G.W. Stevenson, F. Buttel, T.A. Lyson, and M. Duffy. 2008. Why worry about the agriculture of the middle. Pp. 3–22 in Food and the Mid-Level Farm, T.A. Lyson, G.W. Stevenson, and R. Welsh, eds. Cambridge, Mass.: MIT Press.
Klein, L.R., and J.P. Reganold. 1997. Agricultural changes and farmland protection in western Washington. Journal of Soil and Water Conservation 52(1):6–12.
Kleinschmit, J. 2007. Biofueling Rural Development: Making the Case for Linking Biofuel Production to Rural Revitalization. Durham: University of New Hampshire.
Knauss, T. 2009. Oswego County ethanol plant in bankruptcy. The Post-Standard, January 14, 2009.
Kneese, A. 1986. Water resource constraints: the case of the Ogallala aquifer. In The Future of the North American Granary: Politics, Economics, and Resource Constraints in North American Agriculture, C.F. Runge, ed. Ames: Iowa State University Press.
Koudela, M., and K. Petkikova. 2007. Nutritional composition and yield of endive cultivars—Cichorium endivia L. Horticultural Science 34(1):6–10.
———. 2008. Nutritional compositions and yield of sweet fennel cultivars—Foeniculum vulgare Mill. ssp vulgare var. azoricum (Mill.) Thell. Horticultural Science 35(1):1–6.
Krauss, C. 2009. Valero Energy, the oil refiner, wins an auction for 7 ethanol plants. Available at http://www.nytimes.com/2009/03/19/business/energy-environment/19ethanol.html. Accessed on February 19, 2010.
Kumar, K., S. C. Gupta, et al. (2005). Antibiotic uptake by plants from soil fertilized with animal manure. Journal of Environmental Quality 34(6):2082–2085.
Lal, R. 2004. Soil carbon sequestration impacts on global climate change and food security. Science 304.
Leibtag, E. 2008. Corn prices near record high, but what about food costs. Amber Waves 6(1):10–15.
Lin, B-H., J.N. Variyam, J. Allshouse, and J. Cromartie. 2003. Food and Agricultural Commodity Consumption in the United States: Looking Ahead to 2020. Washington, D.C.: U.S. Department of Agriculture Economic Research Service.
Lobao, L., and K. Meyer (2001). The great agricultural transition: crisis, change, and social consequences of twentieth century U.S. farming. Annual Review of Sociology 27:103–124.
Lobao, L., and C. Stofferahn. 2008. The community effects of industrialized farming: social science research and challenges to corporate farming laws. Agriculture and Human Values 25(2):219–240.
Lubowski, R.N., S. Bucholtz, R. Claassen, M. Roberts, J. Cooper, A. Gueorguieva, and R. Johansson. 2006. Environmental Effects of Agricultural Land Use. Washington, D.C.: U.S. Department of Agriculture Economic Research Service.
Luckey, R.R., E.D. Gutentag, and J.B. Weeks. 1981. Water-Level and Saturated-Thickness Changes, Predevelopment to 1980, in the High Plains Aquifer in Parts of Colorado, Kansas, Nebraska, New Mexico, Oklahoma, South Dakota, Texas, and Wyoming: U.S. Geological Survey Hydrologic Investigations Atlas HA-652, 2 sheets, scale 1:2,500,000.
Lusk, J.L., and B.C. Briggeman. 2009. Food values. American Journal of Agricultural Economics 91(1):184–196.
MacDonald, J.A., and W.D. McBride. 2009. The Transformation of U.S. Livestock Agriculture: Scale, Efficiency, and Risks. Washington, D.C.: U.S. Department of Agriculture Economic Research Service.
Mäder, P., D. Hahn, D. Dubois, L. Gunst, T. Alföldi, H. Bergmann, M. Oehme, R. Amadò, H. Schneider, U. Graf, A. Velimirov, A. Fließbach, and U. Niggli. 2007. Wheat quality in organic and conventional farming: results of a 21 year field experiment. Journal of the Science of Food and Agriculture 87(10):1826–1835.
Magkos, F., F. Arvaniti, and A. Zampelas. 2003. Organic food: nutritious food or food for thought? A review of the evidence. International Journal of Food Sciences and Nutrition 54(5):357–371.
McBride, W. 1997. Change in U.S. Livestock Production, 1969–92. Washington, D.C.: U.S. Department of Agriculture Economic Research Service.
Mead, P.S., L. Slutsker, V. Dietz, L.F. McCaig, J.S. Bresee, C. Shapiro, P.M. Griffin, and R.V. Tauxe. 1999. Food-related illness and death in the United States. Emerging Infectious Diseases 5(5):607–625.
Mench, J.A. 2008. Scientific Basis for Improving Animal Welfare. Presentation to the Committee on August 6, 2008, in Washington, D.C.
Methner, U., S. Alshabibi, and H. Meyer. 1995. Experimental oral infection of specific pathogen-free laying hens and cocks with Salmonella enteritidis strains. Journal of Veterinary Medicine Series B-Zentralblatt Fur Veterinarmedizin Reihe B-Infectious Diseases and Veterinary Public Health 42(8):459–469.
Miranowski, J., D. Swenson, L. Eathington, and A. Rosburg. 2008. Biofuel, the rural economy, and farm structure. Paper read at Farm Foundation Conference Transition to a Bioeconomy: Risk, Infrastructure and Industry Evolution, at Berkeley, California, on June 24, 2008. Available at http://www.farmfoundation.org/news/articlefiles/365-John%20Miranowski.pdf. Accessed on January 28, 2010.
Mississippi River/Gulf of Mexico Watershed Nutrient Task Force. 2001. Action Plan for Reducing, Mitigating, and Controlling Hypoxia in the Northern Gulf of Mexico. Washington, D.C.: Author.
Mitchell, L. 2001. Impact of consumer demand for animal welfare on global trade. In Changing Structure of Global Food Consumption and Trade, A. Regmi, ed. Washington, D.C.: U.S. Department of Agriculture Economic Research Service.
Murray, B.C., B.A. McCarl, and H.C. Lee. 2004. Estimating leakage from forest carbon sequestration programs. Land Economics 80(1):109–124.
NAS-NAE-NRC (National Academy of Sciences, National Academy of Engineering, and National Research Council). 2009. Liquid Transportation Fuels from Coal and Biomass: Technological Status, Costs, and Environmental Impacts. Washington, D.C.: National Academies Press.
NBB (National Biodiesel Board). 2007. National Biodiesel Board Annual Report 2007. Jefferson City, Mo.: Author.
NCGA (National Corn Growers Association). 2008. World of Corn. Chesterfield, Mo.: Author.
Nizeyimana, E.L., G.W. Peterson, M.L. Imhoff, H.R. Sinclair, Jr., S.W. Waltman, D.S. Reed-Margetam, E.R. Levine, and J.M. Russo. 2001. Assessing the impact of land conservation to urban uses on soils with different productivity levels in the USA. Soil Science Society of America Journal 65:391–402.
Nolan, B.T., K.J. Hitt, and B.C. Ruddy. 2002. Probability of nitrate contamination of recently recharged ground-waters in the conterminous United States. Environmental Science & Technology 36(10):2138–2145.
Nord, M., M. Andrews, and S. Carlson. 2008. Household Food Security in the United States, 2007. Washington, D.C.: U.S. Department of Agriculture Economic Research Service.
Norris, P., and B.J. Deaton. 2001. Understanding the demand for farmland preservation: implications for Michigan policies. In Staff paper 2001–18. East Lansing: Michigan State University, Department of Agricultural Economics.
Notter, D.R. 1999. The importance of genetic populations diversity in livestock populations of the future. Journal of Animal Science 77(1):61–69.
NRC (National Research Council). 1972. Genetic Vulnerability of Major Crops. Washington, D.C.: National Academy Press.
———. 1993a. Soil and Water Quality. Washington, D.C.: National Academy Press.
———. 1993b. Agricultural Crop Issues and Policies. Washington, D.C.: National Academy Press.
———. 2008. Understanding and Responding to Climate Change—Highlights of National Academies Reports. Washington, D.C.: The National Academies Press.
Oliver, S.P., D.A. Patel, T.R. Callaway, and M.E. Torrence. 2009. ASAS centennial paper: developments and future outlook for preharvest food safety. Journal of Animal Science 87(1):419–437.
Patterson, D.T., J.K. Westbrook, R.J.V. Joyce, P.D. Lingren, and J. Rogasik. 1999. Weeds, insects, and diseases. Climatic Change 43(4):711–727.
Pearce, N., and D. McLean. 2005. Agricultural exposures and non-Hodgkin’s lymphoma. Scandinavian Journal of Work, Environment & Health 31(Suppl. 1):18–25.
Petherick, J.C. 2007. Spatial requirements of animals: allometry and beyond. Journal of Veterinary Behavior-Clinical Applications and Research 2(6):197–204.
Picone, C., and D. Van Tassel. 2002. Agriculture and biodiversity loss: industrial agriculture. In Life on Earth: An Encyclopedia of Biodiversity, Ecology, and Evolution, N. Eldredge, ed. Santa Barbara, Calif.: ABC-CLIO.
Pimentel, D., and M. Pimentel. 2003. Sustainability of meat-based and plant-based diets and the environment. American Society for Clinical Nutrition 78(3):660S–663S.
Pineiro, G., E.G. Jobbagy, J. Baker, B.C. Murray, and R.B. Jackson. 2009. Set-asides can be better climate investment than corn ethanol. Ecological Applications 19(2):277–282.
Pineyro-Nelson, A., J. Van Heerwaarden, H.R. Perales, J.A. Serratos-Hernandez, A. Rangel, M.B. Hufford, P. Gepts, A. Garay-Arroyo, R. Rivera-Bustamante, and E.R. Alvarez-Buylla. 2009. Transgenes in Mexican maize: molecular evidence and methodological considerations for GMO detection in landrace populations. Molecular Ecology 18(4):750–761.
Plucknett, D.L., N.J. Smith, J.T. Williams, and N.M. Anishetty. 1987. Genebanks and the World’s Food. Princeton, N.J.: Princeton University Press.
Rabalais, N.N., R.E. Turner, and D. Scavia. 2002. Beyond science into policy: Gulf of Mexico hypoxia and the Mississippi River. BioScience 52:129–142.
Reganold, J.P., and M.J. Singer. 1984. Comparing farm production input/output ratios using two land classification systems. Journal of Soil and Water Conservation 39(1):47–53.
Ribaudo, M., and R. Johansson. 2006. Water quality: impacts of agriculture. In Agricultural Resources and Environmental Indicators, 2006 Edition / EIB–16. Washington, D.C.: U.S. Department of Agriculture Economic Research Service.
Ribeiro, N.M., A.C. Pinto, C.M. Quintella, G.O. da Rocha, L.S.G. Teixeira, L.L.N. Guarieiro, M.D. Rangel, M.C.C. Veloso, M.J.C. Rezende, R.S. da Cruz, A.M. de Oliveira, E.A. Torres, and J.B. de Andrade. 2007. The role of additives for diesel and diesel blended (ethanol or biodiesel) fuels: a review. Energy & Fuels 21(4):2433–2445.
Rosegrant, M.W. 2008. Biofuels and grain prices: impacts and policy responses. Available at http://beta.irri.org/solutions/images/publications/papers/ifpri_biofuels_grain_prices.pdf. Accessed on June 8, 2009.
Rosenzweig, C., F.N. Tubiello, R. Goldberg, E. Mills, and J. Bloomfield. 2002. Increased crop damage in the US from excess precipitation under climate change. Global Environmental Change—Human and Policy Dimensions 12(3):197–202.
RTI International. 2007. GIPSA livestock and meat marketing study. Volume 3: Fed cattle and beef industries. Available at http://archive.gipsa.usda.gov/psp/issues/livemarketstudy/LMMS_Vol_3.pdf. Accessed on July 24, 2009.
Russelle, M.P., M.H. Entz, and A.J. Franzluebbers. 2007. Reconsidering integrated crop-livestock systems in North America. Agronomy Journal 99:325–224.
Sampson, R.N. 1981. Farmland or Wasteland: A Time to Choose. Emmaus, Pa.: Rodale Press.
San Joaquin Valley Drainage Program. 1990. A Management Plan for Agricultural Subsurface Drainage and Related Problems on the Westside San Joaquin Valley. U.S. Department of Interior and California Resources Agency.
Sassenrath, G.F., P. Heilman, E. Lusche, G.L. Bennett, G. Fitzgerald, P. Klesius, W. Tracy, J.R. Williford, and P.V. Zimba. 2008. Technology, complexity and change in agricultural production systems. Renewable Agriculture and Food Systems 23(4):285–295.
Scavia, D., and K.A. Donnelly. 2007. Reassessing hypoxia forecasts for the Gulf of Mexico. Environmental Science & Technology 41(23):8111–8117.
Scavia, D., N.N. Rabalais, R.E. Turner, D. Justic, and W.J. Wiseman, Jr. 2003. Predicting the response of Gulf of Mex-ico hypoxia to variations in Mississippi River nitrogen load. Limnology and Oceanography 48(3):951–956.
Scavia, D., D. Justic, and V.J. Bierman. 2004. Reducing hypoxia in the Gulf of Mexico: advice from three models. Estuaries 27(3):419–425.
Schillinger, W.F., A.C. Kennedy, and D.L. Young. 2007. Eight years of annual no-till cropping in Washington’s winter wheat-summer fallow region. Agriculture Ecosystems & Environment 120(2–4):345–358.
Schjonning, P., S. Elmholt, and B.T. Christensen. 2004. Managing Soil Quality: Challenges in Modern Agriculture. Cambridge: CABI Publishing.
Schnepf, R. 2004. Energy Use in Agriculture—Background and Issues. CRS Report for Congress. Washington, D.C.: Congressional Research Service.
Searchinger, T., R. Heimlich, R.A. Houghton, F. Dong, A. Elobeid, J. Fabiosa, S. Tokgoz, D. Hayes, and T.-H. Yu. 2008. Use of U.S. croplands for biofuels increases greenhouse gases through emissions from land use change. Science 319:1238–1240.
Selfa, T., L. Kulcsar, R. Goe, and G. Middendorf. 2009. Biofuels bonanza? Exploring community perceptions of the promises and perils of biofuels production. Available at http://sustainability.nationalacademies.org/pdfs/Selfa072909.pdf. Accessed on February 19, 2010.
Shapouri, S., S.R. Rosen, B. Meade, and F. Gale. 2009. Economic Research Service Food Security Assessment 2008–09 Outlook Report. Washington, D.C.: U.S. Department of Agriculture Economic Research Service.
Sharratt, B.S., and D. Lauer. 2006. Particulate matter concentration and air quality affected by windblown dust in the Columbia plateau. Journal of Environmental Quality 35:2011–2016.
Shoemaker, R., D. McGranahan, and W. McBride. 2006. Agricultural and rural communities are resilient to high energy costs. Amber Waves 4(2):16–21.
Shore, L.S., and A. Pruden, eds. 2009. Hormones and Pharmaceuticals Generated by Concentrated Animal Feeding Operations. New York: Springer.
Silbergeld, E.K., J. Graham, and L.B. Price. 2008. Industrial food animal production, antimicrobial resistance, and human health. Annual Review of Public Health 29:151–169.
Simpson, T.W., A.N. Sharpley, R.W. Howarth, H.W. Paerl, and K.R. Mankin. 2008. The new gold rush: fueling ethanol production while protecting water quality. Journal of Environmental Quality 37(2):318–324.
Strange, M. 1988. Family Farming: A New Economic Vision. Lincoln: University of Nebraska Press.
Swenson, D. 2009. Biofuels and rural development. Available at http://sustainability.nationalacademies.org/ pdfs/Swenson.pdf. Accessed on February 19, 2010.
Sylvan, J.B., Q. Dortch, D.M. Nelson, A.F. Maier Brown, W. Morrison, and J.W. Ammerman. 2006. Phosphorus limits phytoplankton growth on the Louisiana shelf during the period of hypoxia formation. Environmental Science & Technology 40(24):7548–7553.
Teuber, M. 2001. Veterinary use and antibiotic resistance. Current Opinion in Microbiology 4(5):493–499.
The Associated Press. 2009. Owner of Nebraska ethanol plant files bankruptcy. July 20, 2009.
Tilman, D. 1999. Global environmental impacts of agricultural expansion: the need for sustainable and efficient practices. Proceedings of the National Academy of Sciences 96(11):5995–6000.
Tilman, D., K. Cassman, P.A. Matson, R. Naylor, and S. Polasky. 2002. Agricultural sustainability and intensive production practices. Nature 418:671–677.
Tucker, M., S.R. Whaley, and J.S. Sharp. 2006. Consumer perceptions of food-related risks. International Journal of Food Science and Technology 41(2):135–146.
Turner, R.E., N.N. Rabalais, E.M. Swenson, M. Kasprzak, and T. Romaire. 2005. Summer hypoxia in the northern Gulf of Mexico and its prediction from 1978 to 1995. Marine Environmental Research 59:65–77.
U.S. Census Bureau. 2009. The 2009 population estimate for the United States is 307,006,550. Available at http://factfinder.census.gov/servlet/SAFFPopulation?_submenuId=population_0&_sse=o n. Accessed on February 11, 2010.
USDA-ERS (U. S. Department of Agriculture Economic Research Service). 2000. ERS Farm Typology for a Diverse Agricultural Sector. Washington, D.C.: Author.
———. 2004. Irrigation and water use briefing room. Available at http://www.ers.usda.gov/Briefing/WaterUse/. Accessed on June 5, 2009.
———. 2005a. Food CPI, price and expenditures: food expenditures by families and individuals as a share of disposable personal income. Available at http://www.ers.usda.gov/Briefing/CPIFoodAndExpenditures/Data/table7.htm. Accessed on May 13, 2006.
———. 2005b. Agricultural chemicals and production technology: sustainability and production systems. Available at http://www.ers.usda.gov/Briefing/AgChemicals/sustainability.htm. Accessed on July 30, 2009.
———. 2008. Value of U.S. agricultural exports by commodity group, 2003–07. Available at http://www.ers.usda.gov/Data/StateExports/2008/commx5yr.xls. Accessed on August 4, 2009.
———. 2009a. Value of U.S. agricultural trade, by calendar year. Available at http://www.ers.usda.gov/Data/Fatus/DATA/XMScy1935.xls. Accessed on February 11, 2010.
———. 2009b. A Preliminary analysis of the effects of HR 2454 on U.S. agriculture. Available at http://www.usda.gov/oce/newsroom/archives/releases/2009files/HR2454.pdf. Accessed on March 25, 2010.
———. 2009c. Agricultural resource management survey (ARMS): resource regions. Available at http://www.ers.usda.gov/Briefing/arms/resourceregions/resourceregions.htm. Accessed on August 4, 2009.
———. 2009d. Rural labor and education: farm labor. Available at http://www.ers.usda.gov/Briefing/LaborAndEducation/FarmLabor.htm. Accessed on June 30, 2009.
———. 2010. Agricultural productivity in the United States. Available at http://www.ers.usda.gov/Data/agproductivity/. Accessed on February 11, 2010.
USDA-NASS (U.S. Department of Agriculture National Agricultural Statistics Service). 2009. 2007 Census of Agriculture. Washington, D.C.: U.S. Department of Agriculture National Agricultural Statistics Service.
———. 2002. Historical highlights: 2002 and earlier census years. Available at http://www.agcensus.usda.gov/Publications/2002/Volume_1,_Chapter_1_US/st99_1_001_001.pdf. Accessed on April 13, 2010.
———. 2008. Quick stats. Available at http://www.nass.usda.gov/QuickStats/PullData_US.jsp. Accessed on October 6, 2008.
USDA-NRCS (U.S. Department of Agriculture National Resource Conservation Service). 1997. National Irrigation Guide. East Lansing, Mich.: U.S. Department of Agriculture Natural Resources Conservation Service.
———. 2001. 1997 National resources inventory summary report (revised December 2000). Available at http://www.nrcs.usda.gov/technical/NRI/1997/summary_report/report.pdf. Accessed on September 2, 2009.
———. 2003. National resources inventory 2001 annual NRI—urbanization and development of rural land. Available at http://www.nrcs.usda.gov/technical/NRI/2001/urban.pdf. Accessed on September 13, 2008.
———. 2006. Energy management. Conservation Research Brief No. 0608. Available at http://www.nrcs.usda.gov/feature/outlook/Energy.pdf. Accessed on February 6, 2010.
VeraSun Energy. 2009. VeraSun Energy Corporation launches chapter 11 case to enhance liquidity while it reorganizes. Available at http://www.verasun.com/Press/details.cfm?ID=161. Accessed on July 24, 2009.
Vesterby, M., and K.S. Krupa. 2001. Major uses of land in the United States, 1997. Washington, D.C.: U.S. Department of Agriculture Economic Research Service.
Vesterby, M., K.S. Krupa, and R.N. Lubowski. 2004. Estimating U.S. cropland area. Amber Waves 2(5):54.
Villarejo, D., D. Lighthall, D. Williams, A. Souter, R. Mines, B. Bade, S. Samuels, and S.A. McCurdy. 2000. Suffering in Silence: A Report on the Health of California’s Agricultural Workers. Davis, Calif.: California Institute for Rural Studies
Vitousek, P.M., J.D. Aber, R.W. Howarth, G.E. Likens, P.A. Matson, D.W. Schindler, W.H. Schlesinger, and G.D. Tilman. 1997. Human alteration of the global nitrogen cycle: sources and consequences. Ecological Applications 7(3):737–750.
Wang, M., W. May, and H. Huo. 2007. Life-cycle energy and greenhouse gas emission impacts of different corn ethanol plant types. Environmental Research Letters 2:1–9.
Wells, H.F., and J.C. Buzby. 2008. Dietary Assessment of Major Trends in U.S. Food Consumption, 1970–2005. Washington, D.C.: U.S. Department of Agriculture Economic Research Service.
Westcott, P.C. 2007. Ethanol Expansion in the United States: How Will the Agricultural Sector Adjust? Washington, D.C.: U.S. Department of Agriculture Economic Research Service.
Wescott, P.C. 2009. Full throttle: U.S. ethanol expansion faces challenges down the road. Amber Waves 7(3): 28–35.
Wing, S., R.A. Horton, S.W. Marshall, K. Thu, M. Taiik, L. Schinasi, and S.S. Schiffman. 2008. Air pollution and odor in communities near industrial swine operations. Environmental Health Perspectives 116(10):1362–1368.
Wing, S., and S. Wolf. 2000. Intensive livestock operations, health, and quality of life among Eastern North Carolina residents. Environmental Health Perspectives 108(3):233–238.
Wirzba, N., ed. 2003. The Essential Agrarian Reader: The Future of Culture, Community, and the Land. Lexington: The University Press of Kentucky.
Ziska, L.H. 2003. Evaluation of yield loss in field sorghum from a C-3 and C-4 weed with increasing CO2. Weed Science 51(6):914–918.
Ziska, L.H., and K. George. 2004. Rising carbon dioxide and invasive, noxious plants: potential threats and consequences. World Resource Review 16:427–447.
Ziska, L.H., and E.W. Goins. 2006. Elevated atmospheric carbon dioxide and weed populations in glyphosate treated soybean. Crop Science 46(3):1354–1359.
Ziska, L.H., J.R. Teasdale, and J.A. Bunce. 1999. Future atmospheric carbon dioxide may increase tolerance to glyphosate. Weed Science 47(5):608–615.