Future Directions for the National Healthcare Quality and Disparities Reports (2010)
Chapter: Appendix F: The Expected Population Value of Quality Indicator Reporting (EPV-QIR): A Framework for Prioritizing Healthcare Performance Measurement
Appendix F
The Expected Population Value of Quality Indicator Reporting (EPV-QIR): A Framework for Prioritizing Healthcare Performance Measurement
David O. Meltzer, MD, PhD, and Jeanette W. Chung, PhD
The University of Chicago
I.
INTRODUCTION
In “The Opportunity Costs of Haphazard Social Investments in Life-Saving,” Tengs and Graham (1996) studied the costs and benefits of 185 interventions that reduce the risk of premature mortality to evaluate the allocative efficiency of investment in life-saving opportunities in the United States. According to their estimates, the United States spent approximately $21 billion on life-saving interventions that prevented roughly 56,700 premature deaths. However, reallocating those dollars using cost-effectiveness criteria to maximize the number of lives saved could have avoided an additional 60,200 premature deaths.
Tengs and Graham’s analysis provides a cautionary tale for stakeholders in healthcare quality improvement, patient safety, and disparities. There are currently more than 1,400 measures in the U.S. Department of Health and Human Services (HHS) National Quality Measures Clearinghouse (NQMC) and more than 250 measures in the Agency for Healthcare Research and Quality (AHRQ) National Healthcare Quality and Disparities Reports (NHQR and NHDR). Given limited resources and an ever-proliferating set of healthcare measures, Tengs and Graham’s analysis reminds us of the importance of asking whether we are maximizing the returns on our investments that seek to improve healthcare quality and safety.
This paper proposes a conceptual and methodological approach to quantifying the population value of efforts to improve quality and reduce disparities, specifically through the selection of quality and disparities indicators such as the AHRQ National Healthcare Quality and Disparities Reports that are the subject of this IOM Committee. To do so, the paper draws upon the literature using measurement approaches from medical cost-effectiveness analysis to prospectively assess the value of research (Claxton and Posnett, 1996; Fenwick et al., 2008; Meltzer, 2001). The result is an approach to estimate the expected population value of quality indicator reporting (EPVQIR). Although analytic tools of cost-effectiveness analysis are used, our approach recognizes that “identifying and issuing guidance regarding the use of cost-effective health technologies does not, in itself, lead to cost-effective services provision” (Fenwick et al., 2008). This gap between evidence on the potential cost-effectiveness of an intervention and the cost-effectiveness of its implementation in practice can arise for many reasons. One reason is uncertainty about the costs and benefits of an intervention. In such cases, modeling the expected value of research has led to useful applications in prioritizing research agendas in domains including Alzheimer’s disease treatments (Claxton et al., 2001), antipsychotic drugs in schizophrenia (Meltzer et al., 2009), bronchodilators in chronic obstructive pulmonary disease (Oostenbrink et al., 2008), and anti-platelet medications in cardiac care (Rogowski et al., 2009). However, while uncertainty in the effectiveness of interventions is relevant in addressing
quality and disparities, quality and disparities reporting is more often targeted at variability in the implementation of available information. Recently, value of research approaches have been adapted to address issues of imperfect implementation (Fenwick et al., 2008; Hoomans et al., 2009).
The expected population value of quality indicator reporting (EPV-QIR) we propose is intended to be a useful tool in selecting quality indicators that can produce the largest improvements in population health. Quality indicators can be ranked in terms of their EPV-QIR and a set of indicators can be identified that offer the highest expected returns to investing in quality improvement. The EPV-QIR depends on several factors:
-
The net health benefit of the appropriate implementation of the intervention, which is the magnitude of the potential health benefit of the intervention (measured in quality adjusted life years (QALYs)) net of the opportunity costs in health when the intervention is fully implemented to maximize its benefit net of costs,
-
The size of the population of persons who should receive the intervention given the standard of care, e.g., those with a positive net health benefit from the intervention,
-
The current state of implementation, which potentially includes both the rate of utilization among parts of the population with positive net health benefits and the rate of use among those parts of the population with negative net health benefits (for whom there are potential gains in net health benefits that can be obtained by eliminating inappropriate use in that population), and
-
The potential for quality improvement, especially as produced by reporting quality indicators. This depends on the probability that providers (or patients) will make choices likely to improve quality when given information on provider performance is provided, and the effectiveness of existing quality improvement interventions to improve outcomes. Because data on these effects may be especially incomplete, our approach also specifically highlights uncertainty in the extent to which quality reporting will stimulate quality improvement action, and quality improvement action will change implementation. This includes both estimating the expected (average) effects of reporting on quality, and bounding estimates of these effects when data on the effectiveness of reporting on quality is especially incomplete. For example, if an intervention is not currently used or at least not used in persons in whom it produces net harms, one such bound would the value of perfect implementation, which is the total benefit that can be achieved in a population if everyone who should receive an intervention receives it and everyone who should not receive an intervention does not receive it.
We explicate our framework in detail in the remainder of this paper, and demonstrate its application in calculating the expected value of quality improvement for selected NHQR measures. We develop our framework in Section II, progressively developing concepts that are critical to the EPV-QIR framework. In Section III, we demonstrate the EPV-QIR calculations for selected measures in the NHQR, while also paying close attention to opportunities to bound estimates of EPV-QIR with more limited data. In Section IV, we discuss the scope of potential application for the EPV-QIR method and its limitations and implementation issues. Section V concludes with a discussion of areas for future development.
II.
THE EPV-QIR FRAMEWORK
Our framework begins with the assumption that all measures are based explicitly or implicitly on some standard of care, which we denote by S. We use O to denote all other alternatives, which could include some other standard of care, or “usual care” or “doing nothing.” Our model could easily be generalized to include multiple alternative standards of care (Oi) by indexing groups additionally according to the care they receive currently. For simplicity, however, we develop our theoretical framework in the case in which there is only a single alternative current pattern of care.
Given this single current pattern of care, the incremental benefit of S is the difference between the effectiveness of the standard of care (eS) and the effectiveness of the alternative (eO) current pattern. The incremental benefit of
S can be written as ∆e = eS – eO. The incremental cost of S is the difference between the cost of the standard of care (cS) and the cost of the alternative (cO). The incremental cost of S can be written as ∆c = cS – cO.
Net Health Benefit (NHB). The net health benefit of the standard of care (NHBS) relative to O, is the incremental health benefits of the standard of care net of its incremental costs, where costs are denominated in units of foregone health benefits due to the financial costs of the standard of care (Stinnett and Mullahy, 1998):
[Eq. 1]
In Eq. 1, λ is a society’s threshold willingness-to-pay for an additional unit of health benefit, which might be measured in life years or quality-adjusted life years (QALYs).1 In these cases, λ would be the amount of money that society is willing to pay to save an additional life year or quality-adjusted life year. The term ∆c/λ is in units of health benefits and represents the foregone health benefits that could have been obtained by allocating money to some marginally cost-effective standard of care. In other words, ∆c/λ represents the opportunity costs in terms of health of accomplishing the standard of care. When an intervention is cost-effective, so its incremental cost-effectiveness ratio (ICER) <λ , the NHB will be positive. Conversely, the NHB will be negative when an intervention is not cost-effective, because the opportunity cost of the intervention will exceed its health benefits.
Because the NHB depends on how opportunity costs are valued in terms of health, NHB depends on the level used for λ. Thresholds of $50,000 and $100,000 per QALY have been commonly used in cost-effectiveness studies, but no universally accepted reference value for λ exists (Hirth et al., 2000). More recent literature has scrutinized the validity of these traditional threshold values and general failure to adjust the threshold for inflation (Ubel et al., 2003). Studies have suggested threshold values of: $109,000-$297,000 USD2003 per QALY (Braithwaite et al., 2008); $12,500-$32,200 USD2003 per QALY (King et al., 2005); $24,777-$428,286 USD1997 per QALY (Hirth et al., 2000). Because the net health benefit framework is sensitive to the value used for λ, the NHB is traditionally reported over a broad range of values of λ.
Population Value of Perfect Implementation (PVPI). A standard of care should generally be implemented when its expected benefits exceed its expected risks. We define the number of individuals, NS, in a population who should receive the standard of care as the measure population. Assuming that individuals outside the measure population do not receive the care, perfect implementation occurs when all individuals in the measure population receive the standard of care. The population value of perfect implementation (PVPI) is the total NHB achieved in the measure population when the standard of care is applied to every patient in the measure population. PVPI is calculated by multiplying the total number of individuals in the measure population (NS) by the net health benefit of S (NHBS):
[Eq. 2]
Population Value of Current Implementation (PVCI). Under perfect implementation, all individuals in a measure population receive the standard of care. When a standard is “underused,” the rate of current implementation, rSC, is less than 100%. The population value of current implementation (PVCI) is the total net health benefits achieved from the health intervention given current implementation rates:
[Eq. 3]
When performance is perfect, every eligible individual in the population receives the standard of care, so PVPI = PVCI, and no further net health benefits can be gained from improving performance.
Maximum Population Value of Quality Improvement (MaxPVQI). Quality effort improvements can be thought of as interventions to perfect implementation. The maximum population value of quality improvement (MaxPVQI)
is the total net health benefits that can be gained by improving implementation from current rates to 100%. MaxPVQI is simply the difference between PVPI and PVCI, or
[Eq. 4]
This MaxPVQI defines the maximum population net gain in health from adopting some standard of care relative to the absence of that standard, in essence providing the net health benefits of the intervention to the fraction (1 − rSC) of the population who should receive the intervention who are not currently receiving it.
Inappropriate Use and Overuse. As noted above, these same general equations can be used to estimate the value of quality improvement when there are multiple other patterns of care, as in the case in which an intervention is overused or inappropriately used, for example. The adjustments that are needed in such cases are to define the relevant population in terms of their current (inappropriate) treatment and then to measure the net health benefit of the change to the current standard of care relative to that inappropriate care. The net health benefit of S implemented within the measure population to which S is meant to apply will not be the same as the net health benefit of implanting S in another population. Hence, calculating the EPV-QIR of measures of overuse or inappropriate use will require estimates of the costs and health effects of implementing the standard in patients outside the measure population. Because the focus of the AHRQ quality indictors is on increasing appropriate use, we do not focus on overuse in our primary exposition, but we do discuss in Appendix A how our analysis can be extended to incorporate overuse and illustrate one calculation incorporating overuse.
Expected Population Value of Quality Improvement (EPV-QI). The MaxPVQI assumes that both the current rate of implementation is known and that quality improvement results in 100% implementation. The expected population value of quality improvement (EPV-QI) reflects the fact that there may be uncertainty about several aspects of the process by which quality initiatives will improve population outcomes. In particular, both the current levels of implementation and the extent to which quality improvement efforts will improve implementation. Indeed, it is well recognized that quality improvement approaches are generally not 100% effective in raising performance to levels of perfection (Oxman et al., 1995). To characterize the uncertainty in this imperfect implementation both before and after QI efforts, let ![]() and
and ![]() be the rates of implementation before and after some QI initiative so that
be the rates of implementation before and after some QI initiative so that ![]() is the change in implementation before and after the intervention. Because these elements and their change can be uncertain, we reflect this uncertainty by assuming the change in implementation with a quality improvement effort
is the change in implementation before and after the intervention. Because these elements and their change can be uncertain, we reflect this uncertainty by assuming the change in implementation with a quality improvement effort ![]() is distributed
is distributed ![]() so that the expected extent of quality improvement would be
so that the expected extent of quality improvement would be ![]() and the expected population value of quality improvement would be:
and the expected population value of quality improvement would be:
[Eq. 5]
Expected Population Value of Quality Indicator Reporting (EPV-QIR). A crucial element in the consideration of quality reporting and the reporting of other indicators is that they do not themselves change quality but instead depend on some sort of action model by which reporting leads to changes in the behavior of providers or others that can improve quality. Fully specifying such an action model is beyond the scope of this paper, but Figure 1 provides some potentially salient elements of such a model, including that quality reporting would need to produce changes in behavior by either providers or patients in order to produce improvements in quality. Because such changes in behavior are unlikely to completely realize potential quality gains (Schneider and Epstein, 1996), it is important to account for the likelihood that the gain in implementation with quality reporting will generally be less than ![]() . We denote this gain in implementation with quality reporting as
. We denote this gain in implementation with quality reporting as ![]() , and for simplicity assume that the uncertainty in how reporting will effect quality can be represented by a probability of undertaking quality improvement action, πQI, so that
, and for simplicity assume that the uncertainty in how reporting will effect quality can be represented by a probability of undertaking quality improvement action, πQI, so that ![]() is the expected change in implementation with quality reporting and the expected population value of quality reporting is:
is the expected change in implementation with quality reporting and the expected population value of quality reporting is:
[Eq. 6]
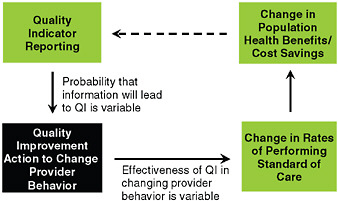
FIGURE 1 Conceptual Model for the Expected Population Value of Quality Indicator Reporting
NOTE: Patients may also change behavior based on quality indicator reporting, for example by selecting high-quality providers, causing changes in the rates at which care delivered meets standards of care.
This equation provides our fundamental framework for developing estimates of the value of quality reporting efforts.
Summary of EPV-QIR Framework
The EPV-QIR framework provides a method for estimating the expected value of improving quality for existing quality measures, measured in units of net health benefits that can be gained within a specified population. This method can be used to estimate the potential value of improving performance on existing quality measures, which can then be used to prioritize measures for reporting or for other investment in quality improvement. Figure 2 provides a summary of the EPV-QIR approach. First, we assume that reporting on a quality measure leads to quality improvement action with probability πQ. The effectiveness of a quality improvement action is the effect size of that action, or ∆rSC. The population value of perfect implementation (PVPI) is equal to the net health benefit that can be achieved by improving quality on a measure to perfect or 100% levels of performance. The expected value of quality improvement (EPV-QIR) is the product of the likelihood quality reporting leads to quality improvement efforts, the improvement in implementation that comes from these quality improvement efforts, and the PVPI. Thus, the expected value of quality improvement for a specific quality indicator depends on the probability that quality improvement efforts will be undertaken, the effectiveness of those efforts, and the maximum potential gain in population net health benefits that can be achieved by closing the quality gap for that measure.
The EPV-QIR will equal the PVPI only when reporting a quality measure will result in quality improvement action with certainty and that quality improvement action is 100% effective in perfecting performance. Thus the PVPI and, if current implementation is known, the MaxPVQI, provide bounds on the EPV-QIR.
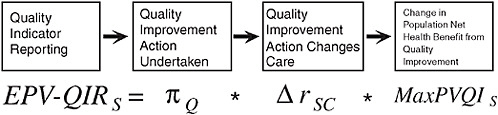
FIGURE 2 Conceptual Summary of the EPV-QIR Approach
III.
USING THE EPV-QIR FRAMEWORK TO PRIORITIZE MEASURES
Using the EPV-QIR framework to prioritize measures ideally requires data on all the elements included in Eq. 6. Because all the other elements depend on defining an intervention in terms of its net health benefits, we begin by exploring the data requirements for NHB and then proceed to defining the other elements. Along the way, we also elaborate on these opportunities identified above in which it may be possible to bound the EPV-QIR using more limited data.
Net Health Benefits. Calculating an estimate of NHBS requires information on: (1) the total cost of implementing the standard of care per person (or per unit, e.g., per infection avoided); (2) the effectiveness of implementing the standard of care per person (or per unit, e.g., per infection avoided); (3) the total cost of implementing the comparator per person (or per unit, e.g., per infection avoided); (4) the effectiveness of implementing the comparator per person (or per unit, e.g., per infection avoided); and (5) the societal cost-effectiveness threshold. As noted, the societal cost-effectiveness threshold is generally varied across a range of values reflecting the uncertainty in this value from the literature. Items 1-4 may be obtained from published cost-effectiveness studies evaluating the standard of care against the comparator, if such studies exist. Preference should be given to cost-effectiveness studies conducted in a population that is similar, if not the same, as the population defined by the denominator of the measure in question. For example, for the NHQR measure, “Percent of individuals age 65+ who ever received a pneumococcal vaccination,” a cost-effectiveness study evaluating the pneumococcal vaccination among adults age 45-55 would be less ideal than a cost-effectiveness study evaluating vaccination among adults age 65-85. Preference might also be given to cost-effectiveness studies conducted in U.S. populations, because difference in healthcare systems might influence total costs of implementing a particular treatment or standard of care. This will affect the validity of net health benefit estimates. It is essential that cost-effectiveness studies publish sufficient data to assess effects on both costs and effectiveness in QALYs for the standard of care/comparator in question. Cost-effectiveness studies that only publish cost-effectiveness ratios (dollars per QALY) are not sufficient to calculate NHB because neither costs nor effectiveness is known.
Number of Individuals Eligible for the Standard of Care. In order to calculate these population-based measures, it is necessary to have an estimate of the number of individuals eligible for the standard of care. In other words, it is necessary to have an estimate of the size of the denominator population. If maximizing population health remains the goal, the eligible population is best selected when the population is defined as that within which the intervention is cost-effective, but if another population is chosen for any reason then the size of that population should be used. To use the same example above, calculating the VPI for the measure “Percent of individuals age 65+ who ever received a pneumococcal vaccination” requires an estimate of the total number of individuals in the U.S. age 65+. For some public-health population-based measures, estimates of the eligible population may be as simple as obtaining age-group and perhaps sex-specific population estimates from the U.S. Census Bureau. For measures denominated on the basis of healthcare utilization such as hospitalizations, weighted population estimates of services and utilization from national healthcare surveys such as the National Hospital Discharge Survey (NHDS) may be useful. For measures defined on the basis of a specific clinical process of care, estimating the size of the denominator population may require estimates of the prevalence of certain conditions.
Rate of Current Implementation. The rates at which individuals in a population receive indicated standards of care are reflected by quality indicators. The denominator of the measure is equal to the measure population (NS, as defined above), and the numerator of the measure is equal to the number of individuals in the measure population who received the standard of care within some reporting period—i.e., for whom “the standard was met,” ![]() .
.
This data would typically be available for existing quality measures that had previously been collected, allowing for efforts to characterize the maximum potential improvements from existing levels of quality (MaxPVQI). Sources of data for implementation rates include: the National Healthcare Quality Report (NHQR) itself, the Behavioral Risk Factor Surveillance Survey (BRFSS), and other quality reports. For new measures being considered about which nothing is known, less informative bounds based on the population value of perfect implementation (PVPI) might be the most informative bound possible.
Expected Quality Improvements. To develop more precise estimates of the EPV-QIR, it is necessary to know the probability of quality improvement (πQ) and the effect size of quality improvement interventions (∆rSC).2
Probability of Quality Improvement (πQ). One key factor is how providers might approach quality improvement when faced with new quality indicators. Understanding the distribution of quality improvement modalities in the provider population is necessary to derive an aggregate estimate of the effect size—i.e., the amount of change in provider behavior and performance rates that can be expected, conditional on a decision to undertake quality improvement. Indeed, studies have pointed to the heterogeneity of quality improvement efforts undertaken at the provider level (Bradley et al., 2005). As a result, information about both the range and potential effectiveness of these quality improvements efforts will very often be lacking.
Indeed, there are several reasons to believe that πQ is much less than 1, as there is relatively little evidence supporting a strong direct link between public reporting and quality improvement activities (Epstein, 2006; Fung et al., 2008; Matthews et al., 2007; Robinowitz and Dudley, 2006). Part of the weak link may be attributable to the finding that hospitals and physicians often discount report cards on the basis of methodology, suggesting that in some cases performance reporting may have little direct effect on provider propensity to engage in targeted quality improvement efforts (Rainwater et al., 1998; Romano et al., 1999; Schneider and Epstein, 1996). A second issue complicating the link between public reporting of quality indicators and quality improvement action is that public reporting has often been studied in the context of pay for performance, making it difficult to parse out the independent effect of public reporting on provider quality improvement activities and/or outcomes (Lindenauer et al., 2007; Rodriguez et al., 2009). Finally, insofar as the existing literature has primarily focused on state-level or payer-specific reporting programs, it seems unlikely that responses to quality measures reported aggregated to the national level would elicit a stronger response to initiate focused quality improvement initiatives.
Effectiveness of Quality Improvement (∆rSC). There are numerous studies of the effectiveness of quality improvement programs (e.g., systems-based interventions to improve cancer screening [Carney et al., 1992; Carpiano et al., 2003]), general approaches to practice/provider behavior change (e.g., continuing medical education [Davis et al., 1995], educational outreach [O’Brien et al., 2007]), and/or specific tools (e.g., printed educational materials [Farmer et al., 2008]) in the context of specific standards of care or clinical conditions (Arnold and Straus, 2005; Renders et al., 2001). However, even when there is some evidence on the efficacy of these approaches, it is unlikely that they will be equally effective in improving performance across different standards of care.
Summary. The relative paucity of evidence on the likely effectiveness of quality reporting on quality improvement activities and of quality improvement activities on implementation of standards of care suggest that efforts to quantify the EPV-QIR will have to rely heavily on bounds implied by estimates of the EPV-QI or MaxPVQI.
EPV-QIR Calculations for Selected NHQR Measures
Table 1 presents the results of attempts to estimate or bound EPV-QIR calculations for 14 NHQR measures for which we were able to obtain information on costs, effectiveness (in QALYs), denominator population, and current implementation rate. Appendix C lists the sources of data elements used in our calculations for each measure. Because of resource limitations, our primary goal in developing these estimates was to illustrate potential issues that could arise in the application of the EPV-QIR approach rather than to develop the best possible estimate for any one of these indicators. To facilitate discussion, we assigned a brief mnemonic to each NHQR measure in this report, listed in Column 1 of Table 1. Column 2 provides the measure definition for each NHQR measure. Column 3 shows the denominator population for each measure—i.e., the total number of individuals in the U.S. who should receive the standard of care for a given measure. Column 4 presents the total number of QALYs that can be achieved if all individuals in the denominator population received the standard of care—this is the population value of perfect implementation (PVPI). Column 5 presents the total number of QALYs currently achieved given existing patterns of care in the population—this is the population value of current implementation (PVCI).
TABLE 1 EPV-QIR Calculations for 18 NHQR Measures
|
Mnemonic |
NHQR Measure |
Denominator Population |
Pop. VPI (QALYs) |
Pop. VCI (QALYs) |
Pop. Max VQI (QALYs) |
|
NHQR_DMHTN |
Percent of adults with diagnosed diabetes with most recent blood pressure <140/80 mm/Hg |
17,268,973 |
7,021,537 |
4,107,599 |
2,913,938 |
|
NHQR_DMCHOL |
Adults age 40 and over with diagnosed diabetes with total cholesterol <200 mg/dL |
17,268,973 |
1,828,056 |
1,003,602 |
824,453 |
|
NHQR_DMFOOT |
Adults age 40+ with diagnosed diabetes who had their feet checked for sores or irritation in the calendar year |
17,268,973 |
2,326,165 |
1,644,599 |
681,566 |
|
NHQR_DMHBA1C |
Percent of adults with diagnosed diabetes with HbA1c level >9.5% (poor control); <7.0 (optimal); <9.0 (minimally acceptable) |
17,268,973 |
1,474,394 |
805,019 |
669,375 |
|
NHQR_HIVEVER |
People ages 15-44 who ever received an HIV test outside of blood donation |
126,006,034 |
529,704 |
241,545 |
288,159 |
|
NHQR_PAP3YR |
Percent of women (age 18 and over) who report they had a Pap smear within the past 3 yrs |
15,272,448 |
2,120,558 |
1,903,757 |
216,801 |
|
NHQR_DMEYE |
Adults age 40+ with diagnosed diabetes who received a dilated eye examination in the calendar year |
17,268,973 |
414,132 |
247,237 |
166,895 |
|
NHQR_CRC50EVERCOLON |
Adults age 50 and over who ever received a colonoscopy, sigmoidoscopy, or proctoscopy |
14,992,188 |
366,829 |
219,454 |
147,375 |
|
NHQR_BRCA2YRMAMM |
Percent of women (age 40+) who report they had a mammogram within the past 2 years |
60,428,554 |
1,167,474 |
1,046,640 |
120,833 |
|
NHQR_CRCBIFOBT |
Adults age 50 and over who received a fecal occult blood test (FOBT) in the last 2 years |
6,895,908 |
253,938 |
152,497 |
101,441 |
|
NHQR_CAPVACC65EVER |
Percent of individuals age 65+ who ever received a pneumococcal vaccination |
38,869,716 |
161,291 |
92,420 |
68,871 |
|
NHQR_BSICVC VQI represents QALYs that can be saved by using chlorhexidine silver sulfadiazine coated catheters (external coat) |
Bloodstream infections (BSIs) per 1,000 central venous catheter (CVC) placements |
140,000 |
0 |
–27,809 |
27,809 |
|
NHQR_BSICVC VQI represents QALYs that can be saved by using silver, platinum and carbon coated catheters |
Bloodstream infections (BSIs) per 1,000 central venous catheter (CVC) placements |
140,000 |
0 |
−27,095 |
27,095 |
|
NHQR_BSICVC VQI represents QALYs that can be saved by using chlorhexidine minocycline and rifampicin coated catheters |
Bloodstream infections (BSIs) per 1,000 central venous catheter (CVC) placements |
140,000 |
0 |
–24,864 |
24,864 |
|
NHQR_BSICVC VQI represents QALYs that can be saved by using chlorhexidine silver sulfadiazine coated catheters (internal + external coat) |
Bloodstream infections (BSIs) per 1,000 central venous catheter (CVC) placements |
140,000 |
0 |
–23,001 |
23,001 |
|
NHQR_AMIBB |
Percent of AMI patients administered beta blockers prescribed at discharge |
682,699 |
123,172 |
109,623 |
13,549 |
|
Mnemonic |
NHQR Measure |
Denominator Population |
Pop. VPI (QALYs) |
Pop. VCI (QALYs) |
Pop. Max VQI (QALYs) |
|
NHQR_HFACE |
Percent of hospital patients with heart failure and left ventricular systolic dysfunction who were prescribed ACE inhibitor or ARB at discharge |
295,101 |
64,976 |
55,359 |
9,616 |
|
NHQR_AMIACE |
Percent of AMI patients with LVSD prescribed ACE inhibitor at discharge |
185,695 |
44,830 |
38,509 |
6,321 |
Column 6 presents the total number of QALYs that can be gained by improving performance on a measure to 100% compliance—this is the maximum population value of quality improvement (MaxPVQI), and it is equal to the difference between PVPI and PVCI.
Table 2 sorts the 14 NHQR measures by descending order of PVPI. Perfect implementation of all 14 measures would yield a total of 17,852,224 QALYs. Nearly 40% of this total can be obtained by achieving perfect implementation of blood pressure control among adults with diagnosed diabetes (NHQR_DMHTN measure). More than half of the total number of QALYs achievable can be obtained by perfecting implementation of both blood pressure control for adults with diabetes and ensuring annual optimal foot care for adults with diabetes. Examining these 14 NHQR measures alone, we see that perfect implementation of the top 7 measures would yield over 90% of total QALYs possible. Moreover, these high-impact measures are all concentrated in public health domains—diabetes, cervical cancer screening, breast cancer screening, and HIV testing.
Table 3 lists the 14 NHQR measures in descending order of MaxPVQI. This table provides important complementary insights to Table 2. Whereas Table 2 identifies those measures with the greatest net health benefit at the population level, Table 3 identifies those measures promising the greatest returns to additional quality improvement in terms of net health benefit. For example, as shown in Table 2, biennial mammography is associated with large health benefits; however, additional investment to improve mammography may not be warranted. As shown in Table 3, further improvement on this measure is expected to yield only 120,833 extra QALYs—less than 2% of the total additional QALYs that can be potentially gained from improving quality on the full set of 14 indicators.
IV.
SCOPE OF APPLICATION, LIMITATIONS, AND ADDITIONAL AREAS FOR FUTURE DEVELOPMENT
Scope of Application
A key determinant of the value of the EPV-QIR approach to selecting and/or prioritizing measures is the extent to which it is applicable across a broad range of measure types. To assess the scope of the approach, it is usual to consider several broad classes of quality indicators:
Process Measures. For process measures defined explicitly on the basis of some standard of care, EVQI can be estimated as long as the net health benefit of S can be estimated using data from published studies.
Composite Process Measures. The 2008 NHQR/NHDR reports on 10 composite process measures. These composites are constructed as “all-or-none” aggregates of individual process measures that measure whether an individual received all standards of care for a given condition. Individuals receiving only some of the enumerated standards are considered to have not received appropriate care, and are scored as such. The EVQI of the composite requires an estimate of the NHBS associated with receiving all components of care in the composite measure. Although NHBs may be calculated for each component in the composite, one cannot sum NHBs across components
TABLE 2 14 NHQR Measures Ranked in Descending Order of Value of Perfect Implementation
|
Mnemonic |
NHQR Measure |
Denominator Population |
VPI (QALYs) |
Share of Total VQI |
Cumulative % VQI |
|
NHQR_DMHTN |
Percent of adults with diagnosed diabetes with most recent blood pressure <140/80 mm/Hg |
17,268,973 |
7,021,537 |
39.33% |
39.33% |
|
NHQR_DMFOOT |
Adults age 40+ with diagnosed diabetes who had their feet checked for sores or irritation in the calendar year |
17,268,973 |
2,326,165 |
13.03% |
52.36% |
|
NHQR_PAP3YR |
Percent of women (age 18 and over) who report they had a Pap smear within the past 3 yrs |
15,272,448 |
2,120,558 |
11.88% |
64.24% |
|
NHQR_DMCHOL |
Adults age 40 and over with diagnosed diabetes with total cholesterol <200 mg/dL |
17,268,973 |
1,828,056 |
10.24% |
74.48% |
|
NHQR_DMHBA1C |
Percent of adults with diagnosed diabetes with HbA1c level >9.5% (poor control); <7.0 (optimal); <9.0 (minimally acceptable) |
17,268,973 |
1,474,394 |
8.26% |
82.74% |
|
NHQR_ BRCA2YRMAMM |
Percent of women (age 40+) who report they had a mammogram within the past 2 years |
60,428,554 |
1,167,474 |
6.54% |
89.28% |
|
NHQR_HIVEVER |
People ages 15-44 who ever received an HIV test outside of blood donation |
126,006,034 |
529,704 |
2.97% |
92.25% |
|
NHQR_DMEYE |
Adults age 40+ with diagnosed diabetes who received a dilated eye examination in the calendar year |
17,268,973 |
414,132 |
2.32% |
94.57% |
|
NHQR_ CRC50EVERCOLON |
Adults age 50 and over who ever received a colonoscopy, sigmoidoscopy, or proctoscopy |
14,992,188 |
366,829 |
2.05% |
96.62% |
|
NHQR_CRCBIFOBT |
Adults age 50 and over who received a fecal occult blood test (FOBT) in the last 2 years |
6,895,908 |
253,938 |
1.42% |
98.04% |
|
NHQR_ CAPVACC65EV |
Percent of individuals age 65+ who ever received a pneumococcal vaccination |
38,869,716 |
161,291 |
0.90% |
98.95% |
|
NHQR_AMIBB |
Percent of AMI patients administered beta blockers prescribed at discharge |
682,699 |
123,172 |
0.69% |
99.64% |
|
NHQR_HFACE |
Percent of hospital patients with heart failure and left ventricular systolic dysfunction who were prescribed ACE inhibitor or ARB at discharge |
295,101 |
64,976 |
0.36% |
100.00% |
|
NHQR_BSICVC |
Bloodstream infections (BSIs) per 1,000 central venous catheter (CVC) placements—CH/SSD ext |
140,000 |
0 |
0.00% |
100.00% |
|
TOTAL |
|
|
17,852,224 |
100.00% |
|
to calculate the total NHB associated with the composite. The reason for this is that one cannot assume additive separability across components. There may be—for example—complementarities across components of care.
Outcomes Measures. A number of intermediate- and final-outcomes measures are reported in the NHQR/NHDR, and vary substantially in the way that they are defined. The primary problem with these measures is the lack of a specific treatment or intervention that can be identified as a target for improvement, which makes it impossible to estimate net health benefits of a standard of care, intervention, or treatment.
Access/Utilization Rates. The NHQR/NHDR includes several measures defined as population utilization rates. A utilization-based measure is intended to track desirable or appropriate use of health services. These measures may be evaluated using the EVQI approach if the net health benefit for an appropriate unit of access to care can be constructed. However, if these measures are indirect measures of the failure to provide unspecified interventions or services which then, as a consequence, result in otherwise-avoidable utilization of health services, then these
TABLE 3 14 NHQR Measures Ranked in Descending Order of Value of Quality Improvement
|
Mnemonic |
NHQR Measure |
Denominator Population |
VQI (QALYs) |
Share of Total VQI |
Cumulative % VQI |
|
NHQR_DMHTN |
Percent of adults with diagnosed diabetes with most recent blood pressure <140/80 mm/Hg |
17,268,973 |
2,913,938 |
46.62% |
46.62% |
|
NHQR_DMCHOL |
Adults age 40 and over with diagnosed diabetes with total cholesterol <200 mg/dL |
17,268,973 |
824,453 |
13.19% |
59.81% |
|
NHQR_DMFOOT |
Adults age 40+ with diagnosed diabetes who had their feet checked for sores or irritation in the calendar year |
17,268,973 |
681,566 |
10.90% |
70.71% |
|
NHQR_DMHBA1C |
Percent of adults with diagnosed diabetes with HbA1c level >9.5% (poor control); <7.0 (optimal); <9.0 (minimally acceptable) |
17,268,973 |
669,375 |
10.71% |
81.42% |
|
NHQR_HIVEVER |
People ages 15-44 who ever received an HIV test outside of blood donation |
126,006,034 |
288,159 |
4.61% |
86.03% |
|
NHQR_PAP3YR |
Percent of women (age 18 and over) who report they had a Pap smear within the past 3 yrs |
15,272,448 |
216,801 |
3.47% |
89.50% |
|
NHQR_DMEYE |
Adults age 40+ with diagnosed diabetes who received a dilated eye examination in the calendar year |
17,268,973 |
166,895 |
2.67% |
92.17% |
|
NHQR_ CRC50EVERCOLON |
Adults age 50 and over who ever received a colonoscopy, sigmoidoscopy, or proctoscopy |
14,992,188 |
147,375 |
2.36% |
94.53% |
|
NHQR_ BRCA2YRMAMM |
Percent of women (age 40+) who report they had a mammogram within the past 2 years |
60,428,554 |
120,833 |
1.93% |
96.46% |
|
NHQR_CRCBIFOBT |
Adults age 50 and over who received a fecal occult blood test (FOBT) in the last 2 years |
6,895,908 |
101,441 |
1.62% |
98.08% |
|
NHQR_ CAPVACC65EVER |
Percent of individuals age 65+ who ever received a pneumococcal vaccination |
38,869,716 |
68,871 |
1.10% |
99.18% |
|
NHQR_BSICVC |
Bloodstream infections (BSIs) per 1,000 central venous catheter (CVC) placements—CH/SSD (ext) |
140,000 |
27,809 |
0.44% |
99.63% |
|
NHQR_AMIBB |
Percent of AMI patients administered beta blockers prescribed at discharge |
682,699 |
13,549 |
0.22% |
99.85% |
|
NHQR_HFACE |
Percent of hospital patients with heart failure and left ventricular systolic dysfunction who were prescribed ACE inhibitor or ARB at discharge |
295,101 |
9,616 |
0.15% |
100.00% |
|
TOTAL |
|
349,927,514 |
6,250,682 |
100.00% |
|
suffer the same challenges as mortality-based measures and clinical intermediate outcomes measures in that net health benefits cannot be constructed.
Overuse and Inappropriate Use Measures. As noted above, the EPV-QIR approach can be extended to consider overuse. The cervical cancer screening example discussed in Appendix A provides a good example of how overuse might be addressed. As discussed in Appendix A, inappropriate use measures work similarly, with effects applied over the relevant populations in which inappropriate use is occurring.
Patient Experience Measures. Finally, NHRQ/NHDR contains a number of measures of patient experience/satisfaction. If these measures are assumed to reflect interpersonal quality of care, then the EPV-QIR approach can be applied if net health benefits can be constructed for dimensions of interpersonal relations between patients and providers. If the motivation for patient experience measures is instead driven by interest in promoting patient-centered or preference-concordant care, then estimating the EPV-QIR is more complicated. The EPV-QIR for com-
munication will itself depend on the expected value of perfect information in a specific decision-making context, or what Basu and Meltzer (2007) term the expected value of individualized care (EVIC). Moreover, the expected value of perfect information may vary considerably depending on the amount of financial risk-sharing that a patient faces (Basu and Meltzer, 2007). In general, the EPV-QIR for communication will tend to be greater in the context of preference-sensitive care where alternative treatment modalities or plans of care present “significant tradeoffs affecting the patient’s quality and/or length of life” (Dartmouth Center for the Evaluative Clinical Sciences, 2007). Although methods for estimating EVIC have been proposed (Basu and Meltzer, 2007), the communication-themed quality indicators in NHQR/NHDR do not measure individualized care, but rather the potential for obtaining individualized care. Valuation of the benefits of communication in this regard will require not only some estimate of the expected value of individualized care in the context of a specific preference-sensitive clinical care context, but also a patient’s willingness-to-pay for communication that will result in preference-concordant care.
Disparities. The EVQI approach could be adapted to calculate measures appropriate for the study of disparities. For example, one could evaluate the value of equal implementation (VEI), or the elimination of disparities across groups. EPV-QIR also lends itself to methods for summarizing disparities across discrete groups. The PVCI of a standard of care in a population comprised of a certain number of groups, denoted by G, can be calculated as the sum of PVCI across all G groups. Each group’s share of population health benefits can be calculated as the fraction of PVCI in the gth group, divided by the population total PVCI. The level of disparity in a measure might then be measured using a concentration index to determine the extent to which health benefits are concentrated in a single or a few groups within the population.
Limitations and Implementation Issues
The scope of applicability of the EPV-QIR framework, delineated in the preceding section, also defines the limitations of our approach. The EPV-QIR approach to prioritizing quality indicators may not be feasible for measures where data on costs and benefits of a standard of care within a population (or sub-population) of interest is not available. Practically speaking, it may not be feasible to use EPV-QIR for prioritizing some of the outcomes, access/utilization, and patient experience measures.
In our limited efforts to date in applying the EPV-QIR framework as we have reviewed the current set of 250+ NHQR quality measures, the main challenges we have observed are: 1) lack of data on costs and effectiveness; 2) multiple standards of care or comparators implicit in the quality measure; 3) undefined standards of care/comparators in the quality measure; and 4) lack of data on the size of the eligible population.
Lack of Data Costs, Effectiveness, and the Value of Health. A large number of NHQR quality measures focus on processes or standards of care for which we have not been able to find published studies providing usable estimates of costs and effectiveness. A prime example of a measure with no known cost or effectiveness data is the NHQR Patient Experience of Care Measure, “Children who had a doctor’s office or clinic visit in the last 12 months whose health providers showed respect for what they had to say.” While we appreciate the intuitive value of this measure, we are not aware of any study measuring the costs and health effects of provider demonstration of respect for patient communication.
Also, the existence of cost-effectiveness studies for a standard or process of care in a measure does not necessarily imply the existence of usable estimates of costs and effectiveness. It is not uncommon for cost-effectiveness studies to publish (incremental) cost-effectiveness ratios only, without a separate table of costs and effects. Unfortunately, cost-effectiveness ratios alone are insufficient inputs into the EPV-QIR calculations. Furthermore, the EPV-QIR technically requires that effects be measured in QALYs, because the NHB calculation involves dividing incremental costs by the cost-effectiveness threshold, which is denominated in units of dollars per QALY.
Also, there may be cost-effectiveness evaluations of a standard or process of care in a measure, but it may not have been conducted in the same population (or a similar population) as that in the denominator of a measure. In these cases, one must judge whether it may be reasonable or valid to use these estimates of costs and effectiveness from dissimilar populations in EPV-QIR calculations, if they are the only estimates available.
Finally, uncertainty about how to value health will surely change estimates of the magnitude and even sign of NHB calculations and all calculations that rely on them. Given this, the robustness of the results of analyses
using this framework must be routinely assessed across a range of estimates of the value of health appropriate to the setting (e.g., at least $50,000 to $200,000 per QALY in the United States).
Multiple Standards of Care/Comparators. The EPV-QIR framework requires assigning an estimate of NHB to the standard of care as well as the comparator or “non-standard” care. For some measures, a single standard of care and comparator may be identified, but for the majority of measures, there are multiple treatment patterns that may be compliant with the standard of care, and/or multiple comparator treatment patterns that are non-compliant with the standard of care. In theory, all treatment patterns that are compliant and non-compliant should be identified, treatment-specific NHBs should be used in the calculations, and the proportion of individuals in the eligible population receiving each treatment pattern needs to be known.
In practice, for measures with multiple standards of care and/or comparators, simplifying assumptions must be made to restrict the analysis to a limited set of treatment patterns that will be considered “compliant” with the standard of care and “non-compliant” with the standard of care. Identification of this set of treatment patterns will hinge on the availability of usable estimates of costs and effectiveness, the prevalence and evidence base for these patterns, and the availability of data on the proportion of the eligible population receiving these different patterns of care. For example, for the NHQR measure, “Percent of women (age 40+) who report they had a mammogram within the past 2 years” any screening occurring at intervals of 2 years or less can be considered compliant with the measure. All other screening schedules—triennial, quadrennial, or intervals of 5 years or longer, in addition to no screening at all, are non-compliant. Each of these non-compliant schedules is associated with different lifetime costs and effectiveness, and thus, a separate NHB should be estimated for each screening schedule. Calculations for this measure are discussed in detail in Appendix B, Calculation 2.
Outcomes-Based Measure with No Defined Standard of Care/Comparator. A related problem exists for many outcome measures when there is no explicit standard or process of care referenced in the quality measure. In some cases, it may be reasonable to identify one or a few interventions or standards of care with direct links to the outcomes of interest. EPV-QIR calculations can be carried out if cost-effectiveness studies for the identified standards of care exist. An example of a quality measure with undefined standards and comparators is the NHQR measure, “Number of bloodstream infections (BSIs) per 1,000 central venous catheter (CVC) placements.” Bloodstream infection rates are influenced only in part by processes of care by healthcare providers, of which there are many. To calculate the EPV-QIR of this measure and other outcomes-based measures with no defined standards of care, it is necessary to: identify an intervention or group of interventions to be considered; find estimates of the NHB of each intervention and comparator under consideration; and to find estimates of the proportion of the population receiving each intervention/comparator. An example of these calculations is presented in Appendix B, Calculation 3.
Lack of Data on Population Estimates. For some measures, it may be difficult to obtain population estimates of the number of individuals eligible for the standard of care in a measure. For example, for the NHQR measure, “Percent of hospital patients with heart attack and left ventricular systolic dysfunction who were prescribed ACE inhibitor or ARB at discharge,” determining the number of individuals eligible for the standard of care requires estimating the number of individuals hospitalized with AMI, as well as the prevalence of LVSD among hospitalized AMI patients. Data from national healthcare utilization surveys can be used to obtain population estimates of the number of discharges for AMI each year; however, information in these surveys may not be sufficient to determine whether a patient had LVSD. Prevalence of LVSD among AMI inpatients may be obtained from reviewing clinical literature. This measure is discussed in detail in Calculation 4, Appendix B.
Uncertainty in Estimates. All the inputs into the above framework may be uncertain and finding ways to reflect this may be important when considering the use of this framework for decision making. When the consequences of a decision are small, a case can be made for making policy based only on expected value (Arrow and Lind, 1970; Claxton, 1999; Meltzer, 2001).
Additional Directions for Future Development
The current formulation of the EPV-QIR framework considers expected value of quality improvement based on net health benefits accruing to a single cohort at a given time point. However, quality improvement undertaken
at a single point in time will alter the quality of care for succeeding cohorts. A more elaborate model can be constructed that estimates the expected value of quality improvement based on discounted streams of net health benefits that may be realized over a specific time horizon. Prioritization of measures based on such a model would result in selection of measures offering the greatest rate of return on investment over a fixed period. Similarly, analyses could examine the value of quality improvement research in multiple settings, and through numerous diverse strategies for quality improvement, whether through indicator reporting or other mechanisms.
REFERENCES
Arnold SR, Straus SE. Interventions to improve antibiotic prescribing practices in ambulatory care. Cochrane Database Syst Rev. 2005 Oct 19;(4):CD003539.
Arrow, K, Lind, R. Uncertainty and the evaluation of public investment decisions. American Economic Review. 1970;16(3):364-78.
Basu, A, Meltzer D. Value of information on preference heterogeneity and individualized care. Medical Decision Making. 2007; 27(2):112-127.
Bradley EH, Herrin J, Mattera JA, Holmboe ES, Wang Y, Frederick P, et al. Quality improvement efforts and hospital performance: rates of beta-blocker prescription after acute myocardial infarction. Med Care. 2005;43(3):282-92.
Braithwate RS, Meltzer DO, King JT, Leslie D, Roberts MS. What does the value of modern medicine say about the $50,000 per quality-adjusted life-year decision rule? Medical Care. 2008;36:349-56.
Carney PA, Dietrich AJ, Keller A, Landgraf J, O’Connor GT. Tools, teamwork, and tenacity: an office system for cancer prevention. J Fam Pract. 1992 Oct;35(4):388-94.
Carpiano RM, Flocke SA, Frank SH, Stange KC. Tools, teamwork, and tenacity: an examination of family practice office system influences on preventive service delivery. Prev Med. 2003 Feb;36(2):131-40.
Claxton K. The irrelevance of inference: a decision-making approach to the stochastic evaluation of health care technologies. Journal of Health Economics. 1999;18(3):341-64.
Claxton K, Neumann PJ, Araki S, Weinstein MC. Bayesian value-of-information analysis. An application to a policy model of Alzheimer’s disease. Int J Technol Assess Health Care. 2001;17(1):38-55.
Claxton K, Posnett J. An economic approach to clinical trial design and research priority setting. Health Economics. 1996;5(6):513-24.
Dartmouth Center for the Evaluative Clinical Sciences. Preference-sensitive care. A Dartmouth Atlas Topic Brief. 2007-01-05. Available at: www.dartmouthatlas.org/topics/preference_sensitive.pdf. Accessed September 2, 2009.
Davis DA, Thomson MA, Oxman AD, Haynes RB. Changing physician performance. A systematic review of the effect of continuing medical education strategies. JAMA. 1995 Sep 6;274(9):700-5.
Epstein AJ. Do cardiac surgery report cards reduce mortality? Assessing the evidence. Med Care Res Rev. 2006;63(4):403-26.
Farmer AP, Légaré F, Turcot L, Grimshaw J, Harvey E, McGowan JL, Wolf F. Printed educational materials: effects on professional practice and health care outcomes. Cochrane Database Syst Rev. 2008 Jul 16;(3):CD004398.
Fenwick E, Claxton K, Sculpher M. The value of implementation and the value of information: combined and uneven development. Medical Decision Making. 2008;28:21-32.
Fung CH, Lim YW, Mattke S, Damberg C, Shekelle PG. Systematic review: the evidence that publishing patient care performance data improves quality of care. Ann Intern Med. 2008;148(2):111-23.
Hirth RA, Chernew ME, Miller E, Ma A, Fendrick M, Weissert WG. Willingness to pay for a quality-adjusted life year: in search of a standard. Medical Decision Making. 2000;20:332-42.
Hoomans T, Fenwick E, Palmer S, Claxton K. Value of information and value of implementation: application of an analytic framework to inform resource allocation decisions in metastatic hormone-refractory prostate cancer. Value in Health. 2009;12(2):315-24.
King JT Jr., Tsevat J, Lave JR, Roberts MS. Willingness to pay for a quality-adjusted life year: implications for societal health care resource allocation. Medical Decision Making. 2005;25:667-77.
Lindenauer PK, Remus D, Roman S, Rothberg MB, Benjamin EM, Ma A, Bratzler DW. Public reporting and pay for performance in hospital quality improvement. N Engl J Med. 2007;356(5):486-96.
Mandelblatt JS, Lawrence WF, Womack SM, Jacobson D, Yi B, Hwang Y, Gold K, Barter J, Shah K. Benefits and costs of using HPV testing to screen for cervical cancer. JAMA. 2002;287:2372-81.
Matthews JC, Johnson ML, Koelling TM. The impact of patient-specific quality-of-care report cards on guideline adherence in heart failure. Am Heart J. 2007;154(6):1174-83.
McGlynn EA, Asch SM, Adams J, Keesey J, Hicks J, DeCristofaro A, Kerr EA. The quality of health care delivered to adults in the United States. NEJM. 2003;348:2635-45.
Meltzer DO. Addressing uncertainty in medical cost-effectiveness analysis: implications of expected utility maximization for methods to perform sensitivity analysis and the use of cost-effectiveness analysis to set priorities for medical research. Journal of Health Economics. 2001;20:109-129.
Meltzer DO, Basu A, Meltzer HY. Comparative effectiveness research for antipsychotic medications: how much is enough? Health Affairs. 2009;28(5):w794-w808.
National Healthcare Quality Report, 2003. Agency for Healthcare Research and Quality, Rockville, MD. http://www.ahrq.gov/qual/nhqr03/nhqr03.htm.
National Healthcare Quality Report, 2008. Agency for Healthcare Research and Quality, Rockville, MD. http://www.ahrq.gov/qual/nhqr08/nhqr08.htm.
O’Brien MA, Rogers S, Jamtvedt G, Oxman AD, Odgaard-Jensen J, Kristoffersen DT, Forsetlund L, Bainbridge D, Freemantle N, Davis DA, Haynes RB, Harvey EL. Educational outreach visits: effects on professional practice and health care outcomes. Cochrane Database Syst Rev. 2007 Oct 17;(4):CD000409. Review.
Oostenbrink JB, Al MJ, Oppe M, Rutten-van Molken MP. Expected value of perfect information: an empirical example of reducing decision uncertainty by conducting additional research. Value in Health. 2008;11(7):1070-80.
Oxman AD, Thomson MA, Davis DA, Haynes RB. No magic bullets: a systematic review of 102 trials of interventions to improve professional practice. CMAJ. 1995 Nov 15;153(10):1423-31.
Rainwater JA, Romano PS, Antonius DM. The California Hospital Outcomes Project: how useful is California’s report card for quality improvement? Jt Comm J Qual Improv. 1998;24(1):31-9.
Renders CM, Valk GD, Griffin S, Wagner EH, Eijk JT, Assendelft WJ. Interventions to improve the management of diabetes mellitus in primary care, outpatient and community settings. Cochrane Database Syst Rev. 2001;(1):CD001481. Review.
Robinowitz DL, Dudley RA. Public reporting of provider performance: can its impact be made greater? Annu Rev Public Health. 2006;27: 517-36.
Rodriguez HP, von Glahn T, Elliott MN, Rogers WH, Safran DG. The effect of performance-based financial incentives on improving patient care experiences: a statewide evaluation. J Gen Intern Med. 2009;Oct 14 [Epub ahead of print].
Rogowski W, Burch J, Palmer S, Craigs C, Golder S, Woolacott N. The effect of different treatment durations of clopidogrel in patients with non-ST-segment elevation acute coronary syndromes: a systematic review and value of information analysis. Health Technology Assessment. 2009;13(31):1-77.
Romano PS, Rainwater JA, Antonius D. Grading the graders: how hospitals in California and New York perceive and interpret their report cards. Medical Care. 1999;37(3):295-305.
Schneider EC, Epstein AM. Influence of cardiac-surgery performance reports on referral practices and access to care—a survey of cardiovascular specialists. NEJM. 1996;335:251-56.
Stinnett AA, Mullahy J. Net health benefits: a new framework for the analysis of uncertainty in cost-effectiveness analysis. Medical Decision Making. 1998;18:S68-S80.
Tengs TO, Graham JD. The opportunity cost of haphazard social investments in life-saving. In: Hahn RW (editor). Risks, Costs, and Lives Saved: Getting Better Results from Regulation. New York: Oxford University Press, 1996, pp. 167-182.
Ubel PA, Hirth RA, Chernew ME, Fendrick AM. What is the price of life and why doesn’t it increase at the rate of inflation? Archives of Internal Medicine. 2003;163(14):1637-41.
U.S. Census Bureau, Population Division. Table 2. Projections of the Population by Selected Age Groups and Sex for the United States: 2010 to 2050 (NP2008-T2). August 14, 2008.
Walton SM, Schumock GT, Lee KV, Alexander GC, Meltzer D, Stafford RS. Prioritizing future research on off-label prescribing: results of a quantitative evaluation. Pharmacotherapy. 2008;28(12):1443-52.
APPENDIX A
Incorporating Inappropriate Use into the EPV-QIR Framework
Incorporating inappropriate use or overuse into the EPV-QIR framework requires adjustments to the framework.
If overuse is defined as excessive use of an intervention in a measure population, the primary adjustment is that the NHB of current use can be negative compared to no use. Therefore, the population value of current implementation (PVCI), needs to be calculated over the parts of the measure population receiving appropriate and excessive levels of use, and can be negative if the extent and negative net health benefits of overuse exceed the positive net health benefits produced by overuse. Because of the potential to increase overuse, the maximum population value of quality improvement (MaxPVQI) with overuse will exceed that if overuse did not exist.
Example: Cervical cancer screening provides a good example of how overuse might be addressed in this framework. The NHQR process measure for assessing the effectiveness of cervical cancer screening is defined as “the percent of women age 18 and older who report they had a Papaniculaou (Pap) smear within the past 3 years.” However, women often receive Pap smears annually rather than triennially although some estimates suggest that more frequent screening is not cost-effective. Below, we demonstrate our calculations of the maximum value of quality improvement that may be attained for a cohort of 18-year-old women.
According to data from the 2005 Behavioral Risk Factor Surveillance System (BRFSS), 94% of women reported ever having a Pap smear. Of those women, 64% reported having a Pap smear less than one year ago; 16.3% reported having a Pap smear between 1 and 2 years ago; 5.9% reported a Pap smear between 2 and 3 years ago; and 13.6% reported having a Pap smear 3 or more years ago. We estimate the rate of women having a Pap smear within 3 years as (0.94) * (0.862) = 0.81.
According to the U.S. Census Bureau, the projected population of women in the 18-24 year age group in the U.S. in 2010 is 15,037,000. We will use 2,148,143 as a rough estimate of the number of women in the 18-yearold cohort in 2010.
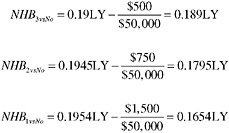
Meltzer (unpublished research) has previously estimated that triennial screening increases life expectancy by 70 days or 0.19178 life years (LY) compared to no screening, at a cost of $500. Biennial screening increases life expectancy by 71 days or adds an additional 0.1945LY compared to no screening at an incremental cost of $750. Annual screening increases life expectancy by 0.1954LY compared to no screening at an incremental cost of $1,500. Assuming λ = $50,000, the net health benefit of triennial screening vs. alternative standards are:
Value of Perfect Implementation. If all 18-year-olds received triennial screening, VPI3 = 2,148,143 × 0.189LY = 405,999LY could be gained.
Using screening rates above, we estimate that 60% of 18-year-olds will receive annual screening, 15% will receive biennial screening, 5.5% will receive triennial screening, and we will assume the rest (20%) will be treated as not screened. Thus the value of current implementation (VCI) consists of the sum of value over these three groups:
The total value of current implementation is the sum of these values: 293,351LY.
The maximum value of quality improvement in this cohort is equal to 405,999LY – 293,351LY = 112,648LY. Note that this is more than simply implementing triennial screening among the 20% of the cohort who are not screened. By reducing underuse among 20%, and moving that subgroup to triennial screening, one would achieve a maximum of (429,629 women) * (0.189LY) = 81,200 LY. Adding this number to current implementation would equal 374,551LY, which is still 31,448LY short of the maximum potential value achievable in this cohort. The reason for this is that screening more frequently than every 3 years results in negative net health benefits, and such frequent screening constitutes overuse. In this example, if all women in the cohort receiving annual screening received triennial screening instead, 30,418LY could be saved. Similarly, if all women receiving biennial screening received triennial screening instead, 3,061LY could be saved. This example demonstrates the flexibility of our general framework in being able to address quality improvement that reduces underuse, as well as quality improvement that reduces overuse.
Inappropriate Use. If inappropriate use is defined as use in a population in which the NHB is negative, then the EPV-QIR framework needs to add in the population value of the harms arising from that inappropriate use, which would be calculated by multiplying the number of persons in the population experiencing inappropriate use and multiplying it times the per-capita negative NHB in that population. This is easily generalized to multiple populations in which inappropriate use can occur, each of which might have different levels of negative NHB. As with overuse, the total benefit of perfect implementation will exceed the benefits of perfect implementation if overuse did not occur. As a result, measures such as the MaxPVQI based only the measure population cannot be used to place upper bounds on the benefits of better use in the entire population, and more detailed calculations that reflect effects in the entire population are needed to establish bounds. Because of the net health benefit framework, an intervention can produce negative net health benefits either because it harms health or because its costs exceed the value of the health benefits it produces. As a result, bounds developed would need to reflect potential effects on both health outcomes and costs.
APPENDIX B
Sample EPV-QIR Calculations
CALCULATION 1. A Basic Example. Percent of Individuals Age 65+ Who Ever Received a Pneumococcal Vaccination [NHQR CAPVACC65EVER]
Standard of Care. The standard of care in this measure is receipt of at least one pneumococcal vaccination among individuals age 65+. This measure essentially implies at least a one-time vaccination at age 65.
Number of Individuals Receiving Standard of Care and Non-Standard Care. We used data from the U.S. Census Bureau to obtain estimates of the U.S. population age 65+ in 2008. Table A.1.1 provides the distribution of individuals age 65+ in the U.S. by receipt of standard/non-standard care.
TABLE A.1.1 Number of Individuals Receiving Standard and Non-standard Care: CAPVACC65EVER.
|
Parameter |
Estimate |
Source |
|
Base Population |
38,869,716 |
U.S. Census Bureau |
|
Current Implementation Rate |
57% |
NHQR 2008 (2006) |
|
N Receiving Standard of Care |
22,272,347 |
|
|
N Not Receiving Standard of Care |
16,597,369 |
|
|
SOURCE: [Base Population] Table 1: Annual Estimates of the Resident Population by Sex and Five-Year Age Groups for the United States: April 1, 2000 to July 1, 2008 (NCEST2008-01). Source: Population Division, U.S. Census Bureau. Release Date: May 14, 2009. |
||
Calculation of Net Health Benefit. Table A.1.2 presents the inputs into the calculation of net health benefit (NHB) associated with one-time vaccination at age 65, and no vaccination. Estimates of the costs and effectiveness of one-time pneumococcal vaccination at age 65 come from Sisk et al. (1997). This study was chosen because it was conducted in the U.S. population age 65+, and because it evaluated one-time vaccination at age 65. This study was also chosen because estimates of costs and QALYs were provided in the published article for both the standard of care and the comparator (no vaccination). Column 1 shows the vaccination category. Column 2 shows the cost per person in 2009 U.S. dollars, and Column 3 shows the QALYs gained per person under no vaccination and under one-time vaccination at age 65. Columns 4 and 5 show the incremental cost and incremental effectiveness of one-time vaccination at age 65 compared to no vaccination. Column 6 shows the cost-effectiveness threshold value used in this analysis, which is $100,000 per QALY. Column 7 shows the final NHB associated with one-time vaccination at age 65.
TABLE A.1.2 Calculation of Net Health Benefits: CAPVACC65EVER
|
Care Type |
Cost per Person in 2009 $USD |
Outcomes (QALYs per Person) |
Incr. Cost† |
Effect’ness† in QALYs |
λ ($/QALY) |
Net Health Benefit in QALYs |
|
No Vaccination |
147 |
7.88752 |
|
|
100,000 |
|
|
Vaccination at Age 65 |
137 |
7.89157 |
−10 |
0.00405 |
100,000 |
0.00415 |
|
† Incremental cost and effectiveness are relative to baseline care type of no vaccination. SOURCE: Sisk JE, Moskowitz AJ, Whang W, Lin JD, Fedson DS, McBean AM, Plouffe JF, Cetron MS, Butler JC. Cost-effectiveness of vaccination against pneumococcal bacteremia among elderly people. JAMA. 1997;278:1333-39. |
||||||
EVQI Calculations. Table A.1.3 displays our calculations for the population value of perfect implementation, population value of current implementation, and maximum population value of quality improvement for the CAPVACC65EVER measure. Columns 2-4 display the NHB associated with the standard of care and non-standard care (no vaccination), the NHB associated with perfect implementation, and the number of persons age 65+ in the U.S. who currently receive non-standard care and the number receiving the standard of care. The VPI is given
in Column 5, and is calculated by multiplying the NHB in Column 2 by the number of persons in Column 4. The sum of PVPI (“Total”) is equal to the total number of QALYs that can be achieved if all individuals age 65+ received one-time pneumococcal vaccination at age 65. The VPI for CAPVACC65EVER is 529,704 QALYs. The PVCI is calculated in Column 6 by multiplying the NHB associated with perfect implementation (Column 3) by the number of individuals in Column 4. The total PVCI is the total number of QALYs that is currently achieved given current patterns of vaccination in this population. The PVCI of CAPVACC65EVER is 241,545 QALYs. The gap between perfect implementation and current implementation is quantified by the maximum value of quality improvement (VQI) in Column 7. The MaxPVQI is simply the difference between PVPI and PVCI, and represents the upper bound on the number of additional QALYs that can be gained by improving quality of care with respect to CAPVACC65EVER. If an intervention that was 100% effective in moving provider behavior toward consistent performance of the standard of care could be costlessly implemented, 288,159 QALYs could be gained.
TABLE A.1.3 The Value of Perfect and Current Implementation, and Quality Improvement: CAPVACC65EVER
|
Care Type |
Net Health Benefit QALYs |
NHB under Perfect Imp. QALYs |
N Persons |
Population Value of Perfect Implement’n (VPI) QALYs |
PopulationValue of Current Implement’n (VCI) QALYs |
Maximum Population Value of Quality Improvem’t QALYs |
|
No Vaccination |
0.00000 |
0.00415 |
16,597,369 |
68,871 |
0 |
68,871 |
|
Vaccination at Age 65 |
0.00415 |
0.00415 |
22,272,347 |
92,420 |
92,420 |
0 |
|
Total |
|
|
38,869,716 |
161,291 |
92,420 |
68,871 |
In the case of CAPVACC65EVER, 54% of individuals age 65+ report ever having received pneumococcal vaccination. However, this rate of implementation has yielded only a 45.6% net health benefit achievement rate.
Limitations. In our calculations for CAPVACC65EVER, we assumed that individuals would be compliant with the measure if they ever had a pneumococcal vaccination from age 65 onwards. As currently defined, however, individuals aged 65+ who received vaccination before the age of 65 could be considered to have received treatment compliant with the measure. This measure may benefit from additional clarification of the numerator and denominator definitions.
CALCULATION 2. The Multiple Standard/Multiple Comparator (MSMC) Problem. Percent of Women Age 50+ Who Report They Had a Mammogram within the Past 2 Years [NHQR BRCA2YRMAMM]
Standard of Care. The standard of care in this measure is lifetime annual or biennial screening mammography among women beginning at age 40.
Multiple Standards. In the case of BRCA2YRMAMM, two screening strategies can be considered to meet the standard of care: annual mammography and biennial mammography. Separate estimates of NHB should be used for annual mammography and biennial mammography because the total costs of annual and biennial screening over a woman’s lifetime (past age 40) must surely be different, even if there may be less difference in clinical effectiveness.
Multiple Comparators. Women who do not receive annual or biennial mammography beginning at age 40 cannot easily be grouped into a single “no screening within 2 years” category. Women who receive non-standard care may never receive screening. Or, they may be screened at intervals other than every one or two years; they may begin screening at an age other than 40 years; and/or they may terminate screening at some point in their lives. All of these alternative screening strategies, including the absence of screening, are non-compliant with the standard of care in the BRCA2YRMAMM measure.
Simplifying Assumptions. For our calculations, we assumed that women age 40+ could be classified into the following mutually exclusive screening categories:
-
Never received mammography
-
Annual mammography
-
Biennial mammography
-
Triennial mammography
-
Mammography at 4-year or greater intervals
As specified, women receiving annual mammography or biennial mammography are said to be in compliance with the standard of care in the NHQR measure.
Number of Women Receiving Standard of Care and Non-Standard Care. We used data from the 2005 Behavioral Risk Factor Surveillance Survey (BRFSS) to obtain weighted estimates of the number of women age 40+ in the U.S. population who received a mammogram within the past 2 years.3 Table A.2.1 provides the distribution of women age 40+ in the U.S. by screening interval.
TABLE A.2.1 Numbers of Women Receiving Standard and Non-standard Care, and Screening Strategy Used for NHB Estimates: BRCA2YRMAMM
|
Care Type |
Number of Women Receiving Standard of Care (NS) |
Number of Women NOT Receiving Standard of Care (NSN) |
Corresponding Screening Strategy from Stout et al. (2006) |
|
Annual Mamm. |
5,838,335 |
|
Begin age 40, end age 80, 1 y interval |
|
Biennial Mamm. |
1,586,308 |
Begin age 40, end age 80, 2 y interval |
|
|
Triennial Mamm. |
585,818 |
Begin age 45, end age 75, 3 y interval |
|
|
Mamm. Interval between 3 and 5 yrs |
378,626 |
Begin age 55, end age 70, 5 y interval |
|
|
Mamm. Interval 5 yrs or greater |
538,696 |
Begin age 55, end age 70, 5 y interval |
|
|
Don’t know |
61,398 |
No screening |
|
|
Refused |
1,340 |
No screening |
|
|
TOTAL |
7,424,643 |
1,565,878 |
|
|
SOURCES: 2006 BRFSS. Stout NK, Rosenberg MA, Trentham-Dietz A, Smith MA, Robinson SM, Fryback DG. Retrospective cost-effectiveness analysis of screening mammography. J Natl Cancer Inst. 2006;98(11):774-82. |
|||
Net Health Benefits. We obtained estimates of costs and effectiveness for each of the five screening strategies from Stout et al. (2006). This study was chosen because of its relative recency, the availability of cost and effectiveness estimates in dollars and QALYs, and because both standards of care (annual and biennial mammography) were evaluated. However, screening strategies in Stout et al. (2006) were not perfectly congruent with implied standards in BRCA2YRMAMM. Whereas BRCA2YRMAMM suggests annual or biennial mammography beginning at age 40 and continuing for the rest of a woman’s lifetime, Stout et al. evaluated annual and biennial mammography beginning at age 40 and ending at age 80. Estimates of costs and effectiveness for comparator screening strategies can also be obtained from Stout et al. For triennial mammography, we use estimates of costs and effectiveness associated with triennial screening beginning at age 45 and ending at age 75. For intervals greater than 3 years, we use estimates of costs and effectiveness associated with screening every 5 years beginning at age 55 and ending at age 70. Table A.2.1 provides a crosswalk between observed screening intervals in the BRFSS data, and the screening strategies corresponding to the NHB estimates from Stout et al. (2006) that we use in our calculations.
Calculation of Net Health Benefit. Table A.2.2 shows data elements and end-calculation of net health benefits for each screening interval or “screening policy.” The first column shows the cost per woman in 2009 U.S. dollars for each screening standard and comparator.4 The second column shows the effectiveness of each screening standard and comparator in QALYs. The third and fourth columns present the incremental cost and incremental effectiveness of each screening modality relative to a baseline of “no screening.” The fifth column contains the cost-effectiveness threshold value that we used in our analysis, which we assumed to be $100,000. This value is roughly equal to the inflation-adjusted 2009 dollar value corresponding to $50,000 in 1982 $USD.5 The sixth column presents the net health benefit calculated for each screening modality.
As evident in Column 6, the NHBs across screening modalities can differ substantially. In our example, the
|
3 |
We used the Web-enabled Analysis Tool (WEAT) available at www.cdc.gov/BRFSS/ to cross-tabulate the number of years since a respondent’s last mammogram by respondent’s age. |
|
4 |
The original cost data in Stout et al. (2006) were presented for the aggregate cohort of 95 million women studied, and were measured in 2000 $USD. We divided the aggregate cost by 95 million to obtain an estimate of the cost per woman for each screening modality. We then used the Consumer Price Index to adjust for inflation. |
|
5 |
A common cost-effectiveness threshold is $50,000. However, this value was first used in 1982, and rarely adjusted in studies to account for inflation. |
NHB of mammography ranges from 0.005 QALYs per woman following a 5-year screening strategy, to 0.02039 QALYs per woman following an annual screening strategy. Indeed, the NHB accruing to annual screening is 1.25 times larger than the NHB accruing to biennial screening, and both annual and biennial screening are considered to be compliant with BRCA2YRMAMM. This illustrates why it can be problematic to use a single estimate of NHB for multiple standards and multiple comparators.
TABLE A.2.2 Calculation of Net Health Benefits: BRCA2YRMAMM
|
Care Type |
Cost per Woman in 2009 $USD |
Outcomes (QALYs per Person) |
Incr. Cost† |
Effect’ness† in QALYs |
λ ($/QALY) |
Net Health Benefit in QALYs |
|
Annual Screening* (begin age 40, end age 80) |
3,316 |
9.9958 |
1,961 |
0.04000 |
100,000 |
0.02039 |
|
Biennial Screening* (begin age 40, end age 80) |
2,461 |
9.9832 |
1,105 |
0.02737 |
100,000 |
0.01632 |
|
Triennial Screening (begin age 45, end age 75) |
1,987 |
9.9726 |
632 |
0.01684 |
100,000 |
0.01053 |
|
5-year Screening (begin age 55, end age 70) |
1,592 |
9.9632 |
237 |
0.00737 |
100,000 |
0.00500 |
|
No screening |
1,355 |
9.9558 |
|
|
100,000 |
|
|
† Incremental cost and effectiveness are relative to baseline care type of no screening. * Care Type compliant with quality measure. SOURCE: Stout NK, Rosenberg MA, Trentham-Dietz A, Smith MA, Robinson SM, Fryback DG. Retrospective cost-effectiveness analysis of screening mammography. J Natl Cancer Inst. 2006;98(11):774-82. |
||||||
EPV-QIR Calculations. Table A.2.3 presents our population value of perfect implementation, population value of current implementation, and (maximum) population value of quality improvement calculations. Column 1 presents each screening standard and comparator under consideration; Column 2 presents the NHB associated with each standard/comparator as computed in Table A.2.2, Column 3 presents the NHB associated with the acceptable standards of care (annual, biennial, or an average of the two), and Column 4 presents the number of women currently in each screening category.
TABLE A.2.3 The Value of Perfect and Current Implementation, and Quality Improvement: BRCA2YRMAMM
|
Care Type |
Net Health Benefit QALYs |
NHB under Perfect Imp. QALYs |
N Women (40+) in Screening Category |
Population Value of Perfect Implement’n (VPI) QALYs |
Population Value of Current Implement’n (VCI) QALYs |
Maximum Population Value of Quality Improvem’t QALYs |
|
Annual Screening* (begin age 40, end age 80) |
0.02039 |
0.02039 |
39,244,638 |
800,384 |
800,384 |
0 |
|
Biennial Screening* (begin age 40, end age 80) |
0.01632 |
0.01632 |
10,662,986 |
173,975 |
173,975 |
0 |
|
Triennial Screening (begin age 45, end age 75) |
0.01053 |
0.01836 |
3,937,803 |
72,279 |
41,451 |
30,829 |
|
5-year Screening (begin age 55, end age 70) |
0.00500 |
0.01836 |
6,166,136 |
113,181 |
30,831 |
82,350 |
|
No screening |
0.00000 |
0.01836 |
416,990 |
7,654 |
0 |
7,654 |
|
Total |
|
|
60,428,554 |
1,167,474 |
1,046,640 |
120,833 |
|
* Care Type compliant with quality measure. |
||||||
As shown in Column 5, the value of perfect implementation (VPI) is the total possible number of QALYs that can be gained by moving all women who are not currently receiving the standards of care, to biennial or annual screening. We take the average of the NHB associated with annual screening and the NHB associated with biennial screening, and then multiply this average by the number of women in each of the comparator screening categories. For women receiving annual or biennial screening, we multiply the number of women in these categories by the NHB associated with annual screening and the NHB associated with biennial screening, respectively. The VPI for the BRCA2YRMAMM measure is the sum of VPI across all screening modalities, and represents the total number of QALYs that could be achieved if all women received mammograms annual or biennially.
Column 6 presents the value of current implementation (VCI), which is the number of QALYs currently achieved given current patterns of mammography. The VCI for each screening strategy is calculated by multiplying the number of women in each screening category by the NHB associated with that screening strategy (see Table A.2.2). The PVCI for the BRCA2YRMAMM is the sum of PVCI across all screening modalities and represents the total number of QALYs currently achieved under existing practice.
Column 7 shows the maximum potential value of quality improvement, which is the difference PVPI, PVCI, and PVQI. As discussed in Part I, the maximum potential value of quality improvement represents an upper bound on the QALYs that can be achieved from improving quality of care if an intervention that was 100% effective in changing provider behavior to comply with standards of care were implemented costlessly.
For the BRCA2YRMAMM measure, the maximum potential value of quality improvement (MaxPVQI) is 120,833 QALYs. A total of 1,167,474 QALYs can be achieved if all women age 40+ received annual or biennial screening beginning at age 40 and continuing for the rest of their lives. Given present patterns of screening mammography, 1,046,640 QALYs are being achieved. Although 82% of eligible women are receiving annual or biennial mammography, roughly 90% of total possible QALYs are being achieved.
APPENDIX C
Data Sources Used in EVQI Calculations Presented in This Report
[NHQR_DMHTN] Percent of adults with diagnosed diabetes with most recent blood pressure <140/80 mm/Hg.
Costs and Effectiveness
-
The CDC Diabetes Cost-Effectiveness Group. Cost-effectiveness of intensive glycemic control, intensified hypertension control, and serum cholesterol level reduction for Type 2 diabetes. JAMA. 2002; 287(19):2542-2551.
-
Note—this study evaluated an intervention involving the use of ACE-I or Beta-blocker to achieve a blood pressure of <144/82 mmHg compared to “usual care.”
Population
-
Table 1: Annual Estimates of the Resident Population by Sex and Five-Year Age Groups for the United States: April 1, 2000 to July 1, 2008 (NC-EST2008-01). Source: Source: Population Division, U.S. Census Bureau. Release Date: May 14, 2009.
-
Centers for Disease Control and Prevention, National Center for Health Statistics, Division of Health Interview Statistics, data from the National Health Interview Survey. U.S. Bureau of the Census, census of the population and population estimates. Data computed by the Division of Diabetes Translation, National Center for Chronic Disease Prevention and Health Promotion, Centers for Disease Control and Prevention.
Current Implementation Rate
-
NHQR 2008 (Data from 2003-6).
[NHQR_DMCHOL] Adults age 40 and over with diagnosed diabetes with total cholesterol <200 mg/dL.
Costs and Effectiveness
-
The CDC Diabetes Cost-Effectiveness Group. Cost-effectiveness of intensive glycemic control, intensified hypertension control, and serum cholesterol level reduction for Type 2 diabetes. JAMA. 2002; 287(19):2542-2551.
-
Note—this study evaluated an intervention involving the use of Pravastatin to achieve a serum cholesterol level < 200mg/dL compared to “usual care.”
Population
-
Table 1: Annual Estimates of the Resident Population by Sex and Five-Year Age Groups for the United States: April 1, 2000 to July 1, 2008 (NC-EST2008-01). Source: Source: Population Division, U.S. Census Bureau. Release Date: May 14, 2009.
-
Centers for Disease Control and Prevention, National Center for Health Statistics, Division of Health Interview Statistics, data from the National Health Interview Survey. U.S. Bureau of the Census, census of the population and population estimates. Data computed by the Division of Diabetes Translation, National Center for Chronic Disease Prevention and Health Promotion, Centers for Disease Control and Prevention.
Current Implementation Rate
-
NHQR 2008 (Data from 2003-6).
[NHQR_DMFOOT] Adults age 40+ with diagnosed diabetes who had their feet checked for sores or irritation in the calendar year.
Costs and Effectiveness
-
Ortegon MM, Redekop WK, Niessen LW. Cost-effectiveness of prevention and treatment of the diabetic foot: a Markov analysis. Diabetes Care. 2004;27:901-907.
-
Note—this study evaluated an intervention involving a program of “optimal foot care” designed to achieve a 90% reduction in foot lesions compared to “usual care.”
Population
-
Table 1: Annual Estimates of the Resident Population by Sex and Five-Year Age Groups for the United States: April 1, 2000 to July 1, 2008 (NC-EST2008-01). Source: Source: Population Division, U.S. Census Bureau. Release Date: May 14, 2009.
-
Centers for Disease Control and Prevention, National Center for Health Statistics, Division of Health Interview Statistics, data from the National Health Interview Survey. U.S. Bureau of the Census, census of the population and population estimates. Data computed by the Division of Diabetes Translation, National Center for Chronic Disease Prevention and Health Promotion, Centers for Disease Control and Prevention.
Current Implementation Rate
-
NHQR 2008 (Data from 2005).
[NHQR_DMHBA1C] Percent of adults with diagnosed diabetes with HbA1c level <9.5% (poor control); <7.0 (optimal); <9.0 (minimally acceptable).
Costs and Effectiveness
-
The CDC Diabetes Cost-Effectiveness Group. Cost-effectiveness of intensive glycemic control, intensified hypertension control, and serum cholesterol level reduction for Type 2 diabetes. JAMA. 2002; 287(19):2542-2551.
-
Note—this study evaluated an intervention involving the use of insulin/sulfonylurea to achieve a glycemic level < 108mg/dL or 6mmol/L compared to “usual care.”
Population
-
Table 1: Annual Estimates of the Resident Population by Sex and Five-Year Age Groups for the United States: April 1, 2000 to July 1, 2008 (NC-EST2008-01). Source: Source: Population Division, U.S. Census Bureau. Release Date: May 14, 2009.
-
Centers for Disease Control and Prevention, National Center for Health Statistics, Division of Health Interview Statistics, data from the National Health Interview Survey. U.S. Bureau of the Census, census of the population and population estimates. Data computed by the Division of Diabetes Translation, National Center for Chronic Disease Prevention and Health Promotion, Centers for Disease Control and Prevention.
Current Implementation Rate
-
NHQR 2008 (Data from 2003-6).
[NHQR_HIVEVER] People ages 15-44 who ever received an HIV test outside of blood donation.
Costs and Effectiveness
-
Sanders GD, Bayoumi AM, Sundaram V, Bilir SP, Neukermans CP, Rydzak CE, Douglass LR, Lazzeroni LC, Holodniy M, Owens DK. Cost-effectiveness of screening for HIV in the era of highly active antiretroviral therapy. NEJM. 2005;352:570-85.
-
Note—this study evaluated HIV testing at age 43 in a population with a 1% prevalence of HIV. We used estimates of the costs and health benefits accruing to the individual tested, and ignore costs and benefits due to spillover to the individual’s partner.
Population
-
Table 1: Annual Estimates of the Resident Population by Sex and Five-Year Age Groups for the United States: April 1, 2000 to July 1, 2008 (NC-EST2008-01). Source: Source: Population Division, U.S. Census Bureau. Release Date: May 14, 2009.
Current Implementation Rate
-
Kaiser State Health Facts, 2001.
[NHQR_PAP3YR] Percent of women (age 18 and over) who report they had a Pap smear within the past 3 years.
Costs and Effectiveness
-
The CDC Diabetes Cost-Effectiveness Group. Cost-effectiveness of intensive glycemic control, intensified hypertension control, and serum cholesterol level reduction for Type 2 diabetes. JAMA. 2002;287(19):2542-2551.
-
Note—this study evaluated an intervention involving the use of insulin/sulfonylurea to achieve a glycemic level < 108mg/dL or 6mmol/L compared to “usual care.”
Population
-
Table 2: Annual Estimates of the Resident Population by Sex and Selected Age Groups for the United States: April 1, 2000 to July 1, 2008 (NC-EST2008-02). Source: Source: Population Division, U.S. Census Bureau. Release Date: May 14, 2009.
Current Implementation Rate
-
BRFSS 2005
[NHQR_DMEYE] Adults age 40+ with diagnosed diabetes who received a dilated eye examination in the calendar year.
Costs and Effectiveness
-
Vijan S, Hofer TP, Hayward RA. Cost-utility analysis of screening intervals for diabetic retinopathy in patients with Type 2 diabetes mellitus. JAMA. 2000;283(7):889-896.
Population
-
Table 1: Annual Estimates of the Resident Population by Sex and Five-Year Age Groups for the United States: April 1, 2000 to July 1, 2008 (NC-EST2008-01). Source: Source: Population Division, U.S. Census Bureau. Release Date: May 14, 2009.
-
Centers for Disease Control and Prevention, National Center for Health Statistics, Division of Health Interview Statistics, data from the National Health Interview Survey. U.S. Bureau of the Census, census of the population and population estimates. Data computed by the Division of Diabetes Translation, National Center for Chronic Disease Prevention and Health Promotion, Centers for Disease Control and Prevention.
Current Implementation Rate
-
NHQR 2008 (Data from 2005).
[NHQR_CRC50EVERCOLON] Adults age 50 and over who ever received a colonoscopy, sigmoidoscopy, or proctoscopy.
Costs and Effectiveness
-
Frazier AL, Colditz GA, Fuchs CS et al. Cost-effectiveness of screening for colorectal cancer in the general population. JAMA. 2000;284(15):1954-1961.
-
Note—this study evaluated annual FOBT in a population representative of the population of adults age 50+ in the U.S., but the study data come from white males age 50+.
-
Note—this study evaluated one-time colonoscopy at age 55.
Population
-
Table 1: Annual Estimates of the Resident Population by Sex and Five-Year Age Groups for the United States: April 1, 2000 to July 1, 2008 (NC-EST2008-01). Source: Source: Population Division, U.S. Census Bureau. Release Date: May 14, 2009.
Current Implementation Rate
-
BRFSS 2005.
[NHQR_BRCA2YRMAMM] Percent of women (age 40+) who report they had a mammogram within the past 2 years.
Costs and Effectiveness
-
Stout NK, Rosenberg MA, Trentham-Dietz A, Smith MA, Robinson SM, Fryback DG. Retrospective cost-effectiveness analysis of screening mammography. J Natl Cancer Inst. 2006;98(11):774-82.
-
Note—this study evaluated biennial screening beginning at age 40 and ending at age 80.
Population
-
Table 1: Annual Estimates of the Resident Population by Sex and Five-Year Age Groups for the United States: April 1, 2000 to July 1, 2008 (NC-EST2008-01). Source: Source: Population Division, U.S. Census Bureau. Release Date: May 14, 2009.
Current Implementation Rate
-
BRFSS 2005.
[NHQR_CRCBIFOBT] Adults age 50 and over who received a fecal occult blood test (FOBT) in the last 2 years.
Costs and Effectiveness
-
Frazier AL, Colditz GA, Fuchs CS et al. Cost-effectiveness of screening for colorectal cancer in the general population. JAMA. 2000;284(15):1954-1961.
-
Note—this study evaluated annual FOBT in a population representative of the population of adults age 50+ in the U.S., but the study data come from white males age 50+.
-
Note—this study evaluated two types of FOBT—rehydrated FOBT (RFOBT) and unrehydrated FOBT (UFOBT). We used an averaged the NHBs associated with RFOBT and UFOBT in our calculations.
Population
-
Table 1: Annual Estimates of the Resident Population by Sex and Five-Year Age Groups for the United States: April 1, 2000 to July 1, 2008 (NC-EST2008-01). Source: Source: Population Division, U.S. Census Bureau. Release Date: May 14, 2009.
Current Implementation Rate
-
BRFSS 2005.
[NHQR_CAPVACC65EVER] Percent of individuals age 65+ who ever received a pneumococcal vaccination.
Costs and Effectiveness
-
Sisk JE, Moskowitz AJ, Whang W, Lin JD, Fedson DS, McBean AM, Plouffe JF, Cetron MS, Butler JC. Cost-effectiveness of vaccination against pneumococcal bacteremia among elderly people. JAMA. 1997;278:1333-1339.
Population
-
Table 2: Annual Estimates of the Resident Population by Sex and Selected Age Groups for the United States: April 1, 2000 to July 1, 2008 (NC-EST2008-02). Source: Source: Population Division, U.S. Census Bureau. Release Date: May 14, 2009.
Current Implementation Rate
-
NHQR 2008 (2006).
[NHQR_BSICVC] Bloodstream infections (BSIs) per 1,000 central venous catheter (CVC) placements.
Costs and Effectiveness
-
Halton KA, Cook DA, Whitby M, Paterson DL, Graves N. Cost-effectiveness of antimicrobial catheters in the intensive care unit: addressing uncertainty in the decision. Critical Care. 2009;13(2):R35.
-
Note—costs were presented in 2006 Australian Dollars. We converted costs to 2006 U.S. Dollars using a historical currency exchange table, and then adjusted costs to 2009 U.S. Dollars using the Consumer Price Index.
Population
-
Maki DG, Stolz SM, Wheeler S, Mermel LA. Prevention of central venous catheter-related bloodstream infection by use of an antiseptic-impregnated catheter: a randomized, controlled trial. Annals of Internal Medicine. 1997;127(4): 257-66.
Current Implementation Rate
-
NHQR 2008 (2004).
[NHQR_AMIBB] Percent of AMI patients administered beta blockers prescribed at discharge.
Costs and Effectiveness
-
Phillips KA, Shlipak MG, Coxson P, Heidenreich PA, Hunink M, Goldman PA, Williams LW, Weinstein MC, Goldman. Health and economic benefits of increased beta-blocker use following myocardial infarction. JAMA. 2000;284:2748-2754.
Population
-
2005 National Hospital Discharge Survey. Available at: www.cdc.gov.
-
Population-weighted estimates of hospital discharges with 3-digit ICD-9-CM code = 410 as primary diagnosis.
Current Implementation Rate
-
NHQR 2008 (2004).
[NHQR_HFACE] Percent of hospital patients with heart failure and left ventricular systolic dysfunction who were prescribed ACE inhibitor or ARB at discharge.
Costs and Effectiveness
-
Boyko WL Jr, Glick HA, Schulman KA. Economics and cost-effectiveness in evaluating the value of cardiovascular therapies. ACE inhibitors in the management of congestive heart failure: comparative economic data. Am Heart J. 1999;137(5):S115-9.
Population
-
2005 National Hospital Discharge Survey. Available at: www.cdc.gov.
-
Population-weighted estimates of hospital discharges with 3-digit ICD-9-CM code = 428 as primary diagnosis.
-
Prevalence of LVSD among patients with HF: Senior R, Galasko G. Cost-effective strategies to screen for left ventricular systolic dysfunction in the community—a concept. Congestive Heart Failure. 2007;11(4):194-211.
Also see:
-
Kelly R, Staines A, MacWalter R, Stonebridge P, Tunstall-Pedoe H, Struthers AD. The prevalence of treatable left ventricular systolic dysfunction in patients who present with noncardiac vascular episodes: a case-control study. J Am Coll Cardiol. 2002;39(2):219-24.
Current Implementation Rate
-
NHQR 2008 (2004).
[NHQR_AMIACE] Percent of hospital patients with heart failure and left ventricular systolic dysfunction who were prescribed ACE inhibitor or ARB at discharge.
Costs and Effectiveness
-
Tsevat J, Duke D, Goldman L, Pfeffer MA, Lamas GA, Soukup JR, Kuntz KM, Lee TH. Cost-effectiveness of captopril therapy after myocardial infarction. JACC. 1995;26(4):914-919.
Population
-
2005 National Hospital Discharge Survey. Available at: www.cdc.gov.
-
Population-weighted estimates of hospital discharges with 3-digit ICD-9-CM code = 410 as primary diagnosis.
-
Prevalence of LVSD among patients with AMI—we use an estimate of 27.2% in all patients hospitalized patients with AMI. This estimate was taken from the SOLVD Trial, as summarized in: Weir R McMurray JJ, Velazquez EJ. Epidemiology of heart failure and left ventricular systolic dysfunction after acute myocardial infarction: prevalence, clinical characteristics, and prognostic importance. Am J Cardiol. 2006;97[suppl]:13F-25F.
Current Implementation Rate
-
NHQR 2008 (2005-2006, all payers).
CALCULATION 3. Outcomes-Based Quality Measure—Standard of Care Not Specified. Bloodstream Infections (BSIs) per 1,000 Central Venous Catheter (CVC) Placements [NHQR BSICVC]
Standard of Care. This is an outcomes measure that tracks an adverse event during hospitalization, namely, bloodstream infection resulting from a central venous catheter. The standard of care is not defined. There are multiple processes of care that can reduce bloodstream infections associated with central venous catheter placements: for example, hand-washing, skin cleaning, and the use of antimicrobial dressing and antimicrobial-coated catheters. Because cost-effectiveness studies have investigated the use of coated catheters in reducing CVC-related BSIs, we use coated catheters as our standard of care in calculating the value of quality improvement with respect to reducing the number of CVC-related BSIs.
Number of Individuals Receiving Standard of Care and Non-Standard Care. We could not find data on the number of catheter placements in the U.S., so for our calculations, we used an estimate of the number of CVCs
sold in the U.S. each year from Maki et al. (1997). This is likely to be an overestimate of the number of CVC placements in the U.S. Based on infection rates published in the 2008 NHQR, there were approximately 140,000 CVC-related BSIs in the U.S. (3% infection rate applied to a base denominator of 5 million catheters). We make an implicit assumption that an infection rate of zero is possible and desirable. Table A.3.1 shows our estimates of the denominator population and number of infections for the CVCBSI measure.
TABLE A.3.1 Number of Individuals Receiving Non-standard Care: CVCBSI
|
Parameter |
|
Source |
|
Base Population |
5,000,000 |
# of CVCs sold annually in U.S. Maki et al. (1997) |
|
Current Infection Rate |
3% |
NHQR 2008 (2006) Rate of BSI in CVCs |
|
N Infections |
140,000 |
|
|
SOURCE: Maki DG, Stolz SM, Wheeler S, Mermel LA. Prevention of central venous catheter-related bloodstream infection by use of an antiseptic-impregnated catheter: a randomized, controlled trial. Annals of Internal Medicine. 1997;127(4): 257-66. NHQR 2008. |
||
Calculation of Net Health Benefit. We use data from Halton et al. (2009) that compares the costs and effectiveness of various antimicrobial catheters compared to uncoated catheters in preventing infections. Although this study was conducted in Australia (and focused on the cost-effectiveness of antimicrobial catheters in intensive care units), this was the only study with usable, published estimates of costs and effectiveness in QALYs for uncoated catheters (comparator) as well as coated catheters (standard of care). Halton et al. evaluated four different types of coated CVCs relative to uncoated CVCs: chlorhexidine/silver sulfadiazine externally coated catheters; chlorhexidine/silver sulfadiazine internally and externally coated catheters; silver, platinum, and carbon-coated catheters; and minocycline and rifampicin-coated catheters. We calculated the NHB of each type of catheter relative to uncoated catheters. Table A.3.2 presents the components of the NHB calculation for the CVCBSCI measure for each catheter type, as shown in Column 1. This study only published the incremental cost and the incremental effectiveness of each coated catheter relative to uncoated catheters. Columns 2 and 3 present these numbers. We again assume a value of $100,000 for the cost-effectiveness threshold (Column 4). Column 5 presents our calculation of the NHB given incremental costs and effectiveness published in the study. Column 6 presents data from Halton et al. (2009) on the number of infections that use of each catheter type can prevent. We divided the NHB (Column 5) by the number of infections avoided (Column 6) to estimate the net health benefit per infection avoided, as shown in Column 7.
TABLE A.3.2 Calculation of Net Health Benefits: CVCBSI
|
Care Type |
Incr. Cost† |
Effect’ness in QALYs† |
λ ($/QALY) |
Net Health Benefit in QALYs |
N Infect. Avoid’d |
NHB QALYs per Infect. Avoid’d |
|
Chlorhexidine silver sulfadiazine catheters (external coat)* |
–75,856 |
0.91000 |
100,000 |
1.66856 |
8 |
0.19864 |
|
Chlorhexidine silver sulfadiazine catheters (internal+external coat)* |
−41,576 |
0.80000 |
100,000 |
1.21576 |
7 |
0.16429 |
|
Silver, platinum and carbon catheters* |
−97,634 |
1.23000 |
100,000 |
2.20634 |
11 |
0.19354 |
|
Minocycline and rifampicin coated catheters* |
–105,951 |
1.64000 |
100,000 |
2.69951 |
15 |
0.17760 |
|
Uncoated central venous catheter (Baseline) |
|
|
100,000 |
|
|
|
|
† Incremental cost and effectiveness are relative to baseline care type of uncoated central venous catheter utilization. * Care Type compliant with quality measure. SOURCE: Halton KA, Cook DA, Whitby M, Paterson DL, Graves N. Cost-effectiveness of antimicrobial catheters in the intensive care unit: addressing uncertainty in the decision. Critical Care. 2009;13(2):R35. |
||||||
EPV-QIR Calculations. Our EVQI calculations for the NHQR_CVCBSCI measure are shown in Table C.3. Again, each catheter type is displayed in Column 1 of Table A.3.3. We reason that NHBs gained per infection
avoided, can also be viewed as the net health benefit lost for every infection that occurred. Thus, Column 2 presents the NHBs lost per infection under different catheter “regimes.” Column 3 reports the NHB lost per infection under perfect implementation. This column is zero because under perfect implementation, we assume that there would be no bloodstream infections associated with central venous catheters. Column 4 reports the number of infections, which is 140,000 (Table C.1). The value of perfect implementation is zero, because this measure pertains to an adverse outcome that should not occur under perfect implementation. Thus, the only “gains” are losses averted. These losses are shown in Column 5. Compared to a regime where externally coated chlorhexidine silver sulfadiazine catheters are used exclusively, current implementation results in a loss of 27,809 QALYs. Compared to a regime in which minocycline and rifampicin-coated catheters are used exclusively, current implementation results in a loss of 24,864 QALYs. The value of quality improvement—which, in our analysis, implies switching regimes from uncoated catheters to a coated catheter, is equal to the absolute value of the QALYs currently lost. For example, the maximum value of quality improvement resulting from a switch from uncoated catheters to chlorhexidine silver sulfadiazine externally coated catheters is 27,809 QALYs.
TABLE A.3.3 The Value of Perfect and Current Implementation, and Quality Improvement: CVCBSI
|
Care Type |
NHB QALYs (Lost) per Infection |
NHB QALYs (Lost) per Infection Under Perfect Imp. QALYs |
N Infections |
Population Value of Perfect Implement’n (VPI) QALYs |
Population Value of Current Implement’n (VCI) QALYs |
Maximum Population Value of Quality Improvem’t QALYs |
|
Chlorhexidine silver sulfadiazine catheters (external coat)* |
−0.19864 |
0.00000 |
140,000 |
0 |
−27,809 |
27,809 |
|
Chlorhexidine silver sulfadiazine catheters (internal+external coat)* |
−0.16429 |
0.00000 |
140,000 |
0 |
−23,001 |
23,001 |
|
Silver, platinum and carbon catheters* |
−0.19354 |
0.00000 |
140,000 |
0 |
−27,095 |
27,095 |
|
Minocycline and rifampicin coated catheters* |
−0.17760 |
0.00000 |
140,000 |
0 |
−24,864 |
24,864 |
|
Uncoated central venous catheter (Baseline) |
|
|
140,000 |
|
|
|
|
* Care Type compliant with quality measure. |
||||||
CALCULATION 4. Complex Denominator Populations. Percent of hospital patients with heart attack and left ventricular systolic dysfunction who were prescribed angiotensin converting enzyme (ACE) inhibitor or angiotensin receptor blocker (ARB) at discharge [AMIACE]
Standard of Care. The standard of care in this measure is the receipt of a prescription for ACE/ARB at discharge among patients hospitalized for acute myocardial infarction (AMI).
Number of Individuals Eligible for the Standard of Care. We used the 2005 National Hospital Discharge Survey to obtain population-weighted estimates of the number of hospital discharges in the U.S. in 2005 that had a primary diagnosis of acute myocardial infarction (AMI),6 by age group. Age groups were defined on the basis of the cost-effectiveness study from which we obtain our estimates of costs and effectiveness, as we describe in the following section. Because the AMIACE measure applies only to hospital discharges with heart failure and left ventricular systolic dysfunction (LVSD), we assumed an LVSD prevalence of 27% among patients with AMI also based on data from the Valsartan in Acute Myocardial Infarction Trial (VALIANT) (Weir et al. 2006).
According to the 2008 NHQR, the current rate of implementation for ACE/ARB at discharge for patients with AMI and LVSD is 86% in the overall population of patients with AMI and LVSD. Rates stratified by age group are not reported. Thus, we made the assumption that current implementation rates did not differ by age group. Table A.4.1 reports our estimates of the number of patients receiving the standard of care in each age group.
TABLE A.4.1 Number of Individuals Receiving Standard and Non-standard Care: AMIACE
|
Parameter |
|
Source |
|
Base Population—Age < 60 |
51,054 |
NHDS 2005 (AMI Discharges, age < 60), 27% LVSD |
|
Base Population—60 ≤ Age < 70 |
39,171 |
NHDS 2005 (AMI Discharges, 60 age < 70), 27% LVSD |
|
Base Population 70 ≤ Age |
95,470 |
NHDS 2005 (AMI Discharges, age 70) 27% LVSD |
|
Current Implementation Rate |
86% |
NHQR (2008) (2003-2006, All Payers) |
|
N Receiving Standard of Care—Age < 60 |
43,855 |
|
|
N Receiving Standard of Care—60 ≤ Age < 70 |
33,648 |
|
|
N Receiving Standard of Care—Age ≥ 70 |
82,008 |
|
|
N NOT Receiving Standard of Care—Age < 60 |
7,199 |
|
|
N NOT Receiving Standard of Care—60 ≤ Age < 70 |
5,523 |
|
|
N NOT Receiving Standard of Care—Age ≥ 70 |
13,461 |
|
|
SOURCE: 2005 National Hospital Discharge Survey. Weir RAP, McMurray JJV, Velazquez EJ. Epidemiology of heart failure and left ventricular systolic dysfunction after acute myocardial infarction: prevalence, clinical characteristics and prognostic importance. American Journal of Cardiology. 2006;97[suppl]:13F-25F). |
||
Calculation of Net Health Benefit. Data on the costs and effectiveness of ACE/ARB come from a cost-effectiveness study by Tsevat et al. (1995) on the use of Captopril (an ACE inhibitor) among survivors of AMI in three age groups: 50-60, 60-70, 70-80, and 80+ year-olds. We used figures from the “limited-benefit” model estimated by Tsevat et al., which assumes that ACE-I does not confer survival benefits beyond 4 years post-AMI. Table A.4.2 provides the inputs and final NHB calculations for ACE therapy in each age group (Column 1). Columns 2 and 3 report the costs and effectiveness of ACE-I and no ACE-I in each age group, and Columns 4 and 5 report the incremental costs and effectiveness. Note the much larger incremental difference in the effectiveness of ACE-I in the oldest age group compared to the youngest age group.
TABLE A.4.2 Calculation of Net Health Benefits: AMIACE
|
Care Type |
Cost per Person in 2009 $USD |
Outcomes (QALYs per Person) |
Incr. Cost† |
Effect’ness† in QALYs |
λ ($/QALY) |
Net Health Benefit in QALYs |
|
Age 50 |
|
|
|
|
|
|
|
No Captopril |
47,983 |
8.10000 |
|
|
100,000 |
|
|
Captopril* |
50,715 |
8.13000 |
2,732 |
0.03000 |
100,000 |
0.00268 |
|
Age 60 |
|
|
|
|
|
|
|
No Captopril |
38,629 |
6.33000 |
|
|
100,000 |
|
|
Captopril* |
41,282 |
6.51000 |
2,653 |
0.18000 |
100,000 |
0.15347 |
|
Age 70 |
|
|
|
|
|
|
|
No Captopril |
30,176 |
4.72000 |
|
|
100,000 |
|
|
Captopril* |
32,899 |
5.07000 |
2,722 |
0.35000 |
100,000 |
0.32278 |
|
† Incremental cost and effectiveness are relative to baseline care type of no Captopril (no ACE/ARB). * Care Type compliant with quality measure. SOURCE: Tsevat J, Duke D, Goldman L, Pfeffer MA, Lamas GA, Soukup JR, Kuntz KM, Lee TH. Cost-effectiveness of captopril therapy after myocardial infarction. Journal of the American College of Cardiology. 1995;26(4):914-19. |
||||||
Table A.4.3 shows the final EVQI calculations for ACEAMI. For each age group in Column 1, Column 2 of Table A.4.3 shows the NHB of ACE-I after AMI in that age group. Column 4 shows the number of patients in each age group who currently receive ACE-I, and the number who do not currently receive ACE-I after AMI. The value of perfect implementation is reported in Column 5, and represents the maximum NHB that would be obtained if all patients in each age group received ACE-I after AMI. Column 6 shows the value of current implementation, given extant rates of prescribing ACE-I at discharge. Column 7 shows the maximum potential NHB that can be gained from improving ACEAMI to 100% from current levels of implementation.
TABLE A.4.3 The Value of Perfect and Current Implementation, and Quality Improvement: AMIACE
|
Care Type |
Net Health Benefit QALYs |
NHB under Perfect Imp. QALYs |
N Persons |
Population Value of Perfect Implement’n (VPI) QALYs |
Population Value of Current Implement’n (VCI) QALYs |
Maximum Population Value of Quality Improvem’t QALYs |
|
Age 50 |
|
|
|
|
|
|
|
No Captopril |
|
0.00268 |
7,199 |
19 |
0 |
19 |
|
Captopril* |
0.00268 |
0.00268 |
43,855 |
118 |
118 |
0 |
|
Age 60 |
|
|
|
|
|
|
|
No Captopril |
|
0.15347 |
5,523 |
848 |
0 |
848 |
|
Captopril* |
0.15347 |
0.15347 |
33,648 |
5,164 |
5,164 |
0 |
|
Age 70 |
|
|
|
|
|
|
|
No Captopril |
0.32278 |
13,461 |
4,345 |
0 |
4,345 |
|
|
Captopril* |
0.32278 |
0.32278 |
82,008 |
26,470 |
26,470 |
0 |
|
Total |
185,694 |
36,964 |
31,752 |
5,212 |
||
|
* Care Type compliant with quality measure. |
||||||


