Ranking Vaccines: A Prioritization Framework: Phase I: Demonstration of Concept and a Software Blueprint (2012)
Chapter: Appendix A: Mathematical Functions
TABLE A-1
Stationary Population Process Model for Population Age j at Year i
Measure | Formulation |
1. Population Size (N) | For year i = 1: Nij = age – specific population size For year i > 1: Nij = Ni-1,j-1 – DWi-1,j-1 – CPi-1,j-1 |
2. Target Population (T) | No Vaccine: Tij = Nij × Proportion Targetij where Proportion Targetij = 0 Vaccine Steady State for year i = 1: Tij = Nij × Proportion Targetij where Proportion Targetij = 1 Vaccine Introduced: Tij = Nij × Proportion Targetij with Proportion Targetij = Input (% of N)ij |
3. Vaccinated Immune (V) | Vij = Tij × coverage rateij × effectivenessij |
4. Vaccinated Susceptible (VS) | VSij = Tij × coverage rateij × (1 – effectivenessij) |
5. Not Vaccinated Immune (B) | Bij = (Vij / herd immunityij) – Vij |
6. Not Vaccinated Susceptible (BS) | BSij = Nij – Vij – VSij – Bij |
7. Total Cases (C) | Cij = (VSij + BSij) × incidence rate |
8. Deaths by Disease (D) | Dij = Cij × case fatality rate |
Measure | Formulation |
9. Cases: Impairment (CP) | CPij = (Cij – Dij) × proportion cases impaired |
10. Cases: Morbidity (CM) | CMij = Cij – Dij – CPij |
11. Vaccine Complications (A) | Aij = (Vij + VSij) × vaccine complications rate |
12. All Cause Deaths (DA) Including Disease | No Vaccine: DAij = Nij × all cause mortality rate Vaccine Steady State: DAij = (Nij × all cause mortality rate) – Deaths averted by vaccine * Deaths averted by vaccine = Vaccine Steady State Dij – No Vaccine Dij Vaccine Introduced: DAij = (Nij × all cause mortality rate) – Deaths averted by vaccine * Deaths averted by vaccine = Vaccine Introduced Dij – No Vaccine Dij |
13. Cause Deleted Deaths (DE) Excluding Disease | DEij = DAij – Dij |
TABLE A-2
Health and Economic Values for Population Age j at Year i
1. Premature Deaths Averted per Year |  |
2. Incident Cases Prevented per Year |  |
3. Quality-Adjusted Life Years (QALYs) Gained | 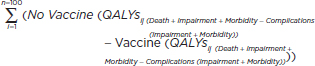 |
4. Disability-Adjusted Life Years (DALYs) Gainedaa | 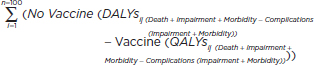 |
5. Net Direct Costs |  |
6. Delivery Costs |  |
7. Health Care Costs (HC) Averted | 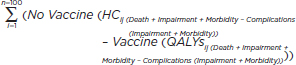 |
8. Workforce Productivity (WP) Gained per Year |  |
9. One-Time Costs | Cost Research + Cost Licensure + Cost Start Up |
aFox-Rushby, J. A., and Hanson, K. 2001. Calculating and presenting disability-adjusted life years (DALYs) in cost-effectiveness analysis. Health Policy and Planning 16(3):326-331.
TABLE A-3
Detailed Expressions (in Reference to Table A-1 and Table A-2)
Measure | Formulation | |
All Cause Mortality Rate (Derived by Life Table Over Interval)a |  | |
QALYsDeath |  | |
QALYsImpairment by disease or complication |  | |
QALYsMorbidity by disease or complication |  | |
Disability-Adjusted Life Years (DALYs) Generalizationb | Years of Life Lost (YLL) + Years of Life Lived with Disability (YLD) | |
YLD or YLL (W = 1) |  | |
DALYs Variables | K = age weight modulation factor (0 = off, 1 = on) F = constant (0.1658) r = discount rate j = age of death (YLL) or age of onset of disability (YLD) G = parameter form the age weighting function (0.04) L = standard expectation of life at age a (YLL) or duration of disability (YLD) W = disability weight (YLD) | |
DALYsDeath |  | |
DALYsImpairment by disease or complication |  | |
DALYsMorbidity by disease or complication |  | |
Health Care Costs (HC)Death |  | |
HCImpairments by disease or complication |  | |
HCMorbidity by disease or complication |  |
Measure | Formulation | |
Workforce Productivity (WP) Gained DeathDeath |  | |
WPImpairment by disease or complication |  | |
WPMorbidity by disease or complication |  |
aPreston, S., P. Heuveline, and M. Guillot. 2000. Demography: Measuring and modeling population processes. Chapter 3: The Life Table and Single Decrement Process. P. 46.
bFox-Rushby, J. A., and K. Hanson. 2001. Calculating and presenting disability adjusted life years (DALYs) in cost-effectiveness analysis. Health Policy and Planning 16(3):326–331.


