An Integrated Framework for Assessing the Value of Community-Based Prevention (2012)
Chapter: Appendix B: Examples of Systems Science Approaches to Valuing Community-Based Prevention
Examples of Systems Science Approaches to Valuing Community-Based Prevention
Under ideal circumstances, there are sufficient data available for all of the domains and elements of value for the development of decision support tools. A systems science model based on these data and on the causal relationships among the variables could simulate or reproduce the impacts of different interventions on the variables in the system as well as the resulting changes to the structure of the system overall.
Yet, as noted in Chapter 2, many of the policy, system, and environmental interventions to reduce chronic and infectious diseases and to promote population health have a limited evidence base with which to work. There are other obstacles as well, including the short-term tenure of policy and decision makers and disagreements about valued outcomes and priorities among local decision makers. For instance, elected officials may have a preference for innovative strategies rather than evidence-based ones because they wish to draw attention to their campaign or platform or highlight their accomplishments while they are still in office. However, such innovations may be difficult to identify and measure in a timely fashion. As another example, representative input from community members may shed light on previous policy successes and failures or other historical trends; however, the voices of many community members are often underrepresented or infrequently assessed and reported.
One way to advance the field is to use qualitative methods to support the generation of systems science maps or diagrams that capture the underlying theories of change and causal structures in the system. See Figure B-1 for a theoretical illustration of a causal loop diagram—i.e., a map—of a
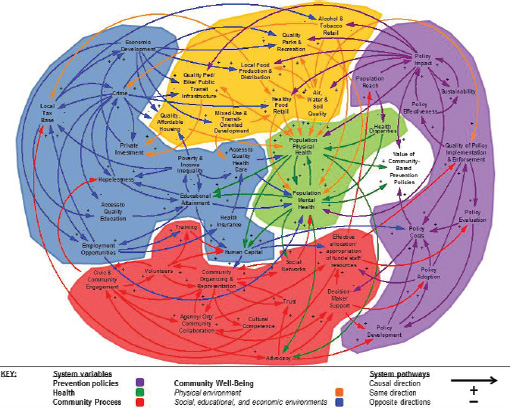
FIGURE B-1 Example causal loop diagram for value of community-based prevention policies.
system that incorporates prevention policies, health, community well-being, and community processes.
Figure B-1 provides an illustration of a comprehensive system for increasing the understanding of the value of community-based prevention policies. While it is difficult to disentangle the multiple moving parts in this comprehensive system, the diagram provides insights about how variables in the system influence or are influenced by multiple other variables in the system (e.g., economic development or population physical health). These variables are cross-cutting variables that appear in multiple pathways emerging from the causal loop diagram, and they highlight important leverage points in the system that can be used to gain momentum for change throughout the system.
Developing these diagrams helps identify variables in the system, causal relationships between the variables in the system, and key leverage points in the system that may impact multiple other variables in the system (e.g., “crime” in Figure B-1). In turn these diagrams can be used to generate common understanding or agreement about the system, to set priorities related to places to intervene in the system, or to identify variables and associated measures that can be assessed in order to test the variables in the system using simulation models, among others. Furthermore, systems science model development efforts benefit from the experiential knowledge that community representatives accumulate about the successes and challenges associated with developing, implementing, and evaluating community-based prevention policies and wellness strategies (Homer and Hirsch, 2006).
A closer examination of the causal loop diagram can also help make more explicit the theories of change—or pathways from prevention policies to health outcomes—as well as the underlying structures serving to reinforce or hinder change processes. See Figure B-2 for an illustration of pathways associated with tobacco use, nutrition, and physical activity.
To understand the feedback loops, it is helpful to take a closer look at some of the pathways in the causal loop diagram in Figure B-2. For example, a feedback loop associated with tobacco use, which is highlighted in yellow, may represent the following causal structure:
- [Start at Alcohol & Tobacco Retail] A community with a large number of tobacco outlets has a greater proportion of the population with access to tobacco products, and, consequentially, greater sales of tobacco products;
- [Move to Population Physical Health] as members of the community purchase and consume more tobacco products, the rates of heart disease, lung cancer, oral cancer, and other co-morbid conditions associated with tobacco use increase;
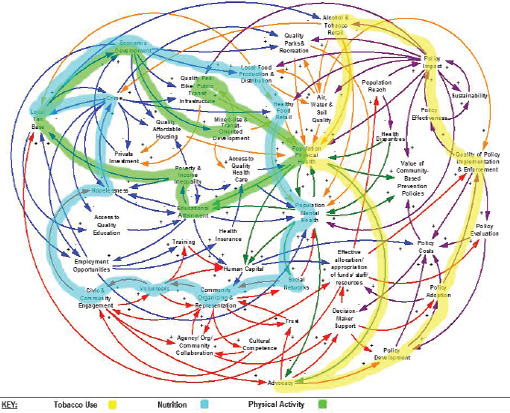
FIGURE B-2 Pathways for prevention policies related to tobacco use, nutrition, and physical activity.
- [Move to Advocacy] with high rates of morbidity and mortality associated with tobacco use, community and health representatives develop advocacy initiatives to draw attention to these serious health concerns;
- [Move to Policy Development] advocates support new policies that place restrictions on the sale and distribution of tobacco products or tobacco use, or both;
- [Move to Policy Adoption] these policies require buy-in and support from elected officials, who may be influenced by tobacco lobbyists or financial support from the tobacco industry, resulting in potential elimination or dilution of policies;
- [Move to Quality Policy Implementation & Enforcement] once a policy is passed, local decision makers also decide on the funding and resources to be allocated to implementation and enforcement of the policy, and, with fewer resources, quality assurance and compliance often suffers;
- [Move to Policy Effectiveness] yet, with a rigorous policy in place and resources to support its enforcement, the policy can be efficacious in minimizing the concentration of tobacco outlets, reducing tobacco sales, and decreasing tobacco use;
- [Move to Policy Impact] thus, with an increase in these evidence-based policies, the policies are typically replicated in other communities; and
- [Go back to Alcohol & Tobacco Retail] the total number of tobacco outlets is reduced along with subsequent declines in tobacco sales and consumption.
In addition, there are a few relevant pathways (not highlighted) for increasing the value of this community-based prevention policy, including greater policy impact, greater population physical health (or mental health as relevant), and fewer policy costs associated with policy development, adoption, implementation, enforcement, and evaluation.
As another example, one of the feedback loops for nutrition is highlighted in blue, and it may represent the following causal structure:
- [Start at Local Food Production & Distribution] An increasing number of school and community gardens as well as urban farms are being developed in a community;
- [Move to Healthy Food Retail] community members are selling produce from these gardens and urban farms through farmer’s markets and mobile vendors to increase access to locally grown fruits and vegetables in the community;
- [Move to Population Mental Health] from the markets and vendors, the entire community has access to healthier foods, reducing stresses associated with food insecurity and increasing mental health benefits associated with consumption of nutritious foods;
- [Move to Social Networks] as community members feel better and learn more about the gardens and farms, community participation in the gardens and farms increases, and these places increase opportunities for social interactions with other community members;
- [Move to Community Organizing & Representation] because of these social interactions, community members become aware of, and more likely to participate in, events, decisions, and changes happening in the community;
- [Move to Volunteers] through community outreach, more in-kind services and resources are generated from the community;
- [Move to Civic & Community Engagement] as these social movements form and mobilize, community members become more involved in democratic practices (e.g., voting, attending city council meetings, running for office);
- [Move to Hopelessness] with participation in community improvements, community members feel a greater sense of pride in their community and optimism about the future of their community;
- [Move to Crime] with this sense of hope and time invested in community improvements, a critical mass of community members becomes less tolerant of crime and other activities that cause people to feel unsafe in their own community;
- [Move to Local Tax Base] as a result of less crime and more community improvements, the community begins to attract more businesses and residents, increasing the local tax base;
- [Move to Economic Development] with more tax dollars, the community can invest more resources into gardens, farms, farmer’s markets, and mobile vendors; and
- [Go back to Local Food Production & Distribution] thereby, increase the quality and quantity of local food production and distribution.
A final example, which includes one of the feedback loops for physical activity, is highlighted in green. It has the potential to represent the following causal structure:
- [Start at Quality Ped/Bike/Public Transit Infrastructure] A sprawling, car-centric community has few options for multi-modal transportation;
- [Move to Population Physical Health] children in the community rely on their parents to drive them in cars to school and other destinations in the community, increasing sedentary time sitting in a car and reducing time in active transportation;
- [Move to Educational Attainment] as children are more sedentary, expend less energy, and have poorer health, their attention, focus, and performance in school suffers, which may, in turn, affect their overall educational attainment;
- [Move to Poverty & Income Inequality] adolescents or young adults with less than a high school education are more likely to have lower-income jobs or to live in poverty;
- [Move to Local Tax Base] with more poverty in the community, residents and businesses tend to leave the community and the local tax base declines;
- [Move to Economic Development] resources for economic development also go away;
- [Move to Mixed-Use & Transit-Oriented Development] leaving no support for new developments that reduce sprawl and car dependence; and
- [Go back to Quality Ped/Bike/Public Transit Infrastructure] stagnation or further decline in the quality of multi-modal transportation options.
Through group model building, innovative community participatory methods of data collection and analysis provide opportunities to develop conceptual models with community representatives that can serve as the basis for the construction of the simulation models (Hovmand et al., 2012; Vennix, 1996, 1999). The use of community-based participatory methods has helped to elucidate complex interactions of social, political, economic, environmental, and health conditions as experienced by community members (Krieger et al., 2002; Lantz et al., 2001; Metzler et al., 2003; Schulz et al., 2002); to establish trusting relationships to increase understanding and insight (Lincoln and Guba, 1985); to foster co-learning and capacity building among all partners (Israel et al., 2005); and to create greater balance between knowledge generation and intervention for the mutual benefit of all partners (Wallerstein, 1999).
Likewise, the resource-based view (RBV) of systems provides a method to examine how differences are ascribed to different kinds of systems or different arrangements of tangible and intangible resources. To examine variation across communities, RBV focuses on the level of key resources in communities and how they are arranged (Morecroft, 2008; Morecroft et al., 2002; Warren, 2002). Therefore, differences in trends between systems
get explained both by differences in tangible or intangible resources and differences in how those resources are organized. For example, two communities can have the same level of resources (e.g., funding to support air, water, and soil quality), yet exhibit very different trends because the communities differ in how those resources are organized and mobilized (e.g., allocation of funds to policy development, industry regulation, or community promotional campaigns) (Brennan et al., no date).
Tangible resources may include new policies (e.g., a smoking ban or Medicaid reimbursement rules), environments (e.g., farmer’s market or mobile health clinics), programs (e.g., the Walking School Bus or after-school programs), promotional efforts (e.g., pink ribbons for breast cancer awareness and condom distribution), and social determinants (e.g., education, housing, and employment), among others. Intangible resources may include engagement (e.g., citizen participation and leadership by local champions), awareness and demand, social norms and influence (e.g., reciprocity and power), and cultural and psychosocial factors (e.g., values and traditions, beliefs). From a practice perspective, tangible resources tend to be easier than intangible resources for decision makers to identify and manage (Morecroft, 2002). In turn, from an evaluation perspective tangible resources are more readily observed and measured, and intangible resources may not get captured in the data or subsequent analyses.
REFERENCES
Braveman, P. 2006. Health disparities and health equity: Concepts and measurement. Annual Review of Public Health 27:167-194.
Brennan, L., R. Brownson, and P. Hovmand. No date. Evaluation of active living by design: Implementation patterns across communities. American Journal of Preventive Medicine [under review].
Homer, J., and G. Hirsch. 2006. System dynamics modeling for public health: Background and opportunities. American Journal of Public Health 96:452-458.
Hovmand, P., D. Andersen, E. Rouwette, G. Richardson, K. Rux, and A. Calhoun. 2012. Group model-building “scripts” as a collaborative planning tool. Systems Research and Behavioral Science 29(2):179-193.
Israel, B., E. Eng, A. Schulz, E. Parker, and D. Satcher (eds.). 2005. Methods in community-based participatory research for health. San Francisco: John Wiley & Sons.
Krieger, J., C. Allen, A. Cheadle, S. Ciske, J. Schier, K. Senturia, and M. Sullivan. 2002. Using community-based participatory research to address social determinants of health: Lessons learned from seattle partners for healthy communities. Health Education and Behavior 29(3):361-382.
Lantz, P., E. Viruell-Fuentes, B. Israel, D. Softley, and R. Guzman. 2001. Can communities and academia work together on public health research? Evaluation results from a community-based participatory research partnership in Detroit. Journal of Urban Health 78(3):495-507.
Lincoln, Y. S., and E. G. Guba. 1985. Establishing trustworthiness. In Naturalistic inquiry. Beverly Hills, CA: Sage.
Metzler, M., D. Higgins, C. Beeker, N. Freudenberg, P. Lantz, K. Senturia, and A. Elsinger, E. Uiruell-Fuentes, B. Gheisar, A. Palermo, and D. Softley. 2003. Addressing urban health in Detroit, New York City and Seattle through community-based participatory research partnerships. American Journal of Public Health 93(5):803-811.
Morecroft, J. 2002. Resource management under dynamic complexity. In Systems perspectives on resources, capabilities, and management processes, edited by J. Morecroft, R. Sanchez, and A. Henne. New York: Pergamon. Pp. 19-40.
Morecroft, J. 2008 (July 20-24). System dynamics, rbv, and behavioural theories of firm performance: Lessons from people express. Paper presented at the International Conference of the System Dynamics Society, Athens, Greece.
Morecroft, J., R. Sanchez, and A. Henne. 2002. Systems perspectives on resources, capabilities, and management processes. New York: Pergamon.
Schulz, A., E. Parker, B. Israel, A. Allen, M. DeCarlo, and M. Lockett. 2002. Addressing social determinants of health through community-based participatory research: The East Side Village Health Worker Partnership. Health Education and Behavior 29(3):326-341.
Vennix, J. 1996. Group model building: Facilitating team learning using system dynamics. New York: John Wiley & Sons.
Vennix, J. 1999. Group model building: Tackling messy problems. System Dynamics Review 15(4):379-401.
Wallerstein, N. 1999. Power between evaluator and community: Research relationships within New Mexico’s healthier communities. Social Science and Medicine 49(1):39-53.
Warren, K. 2002. Competitive strategy dynamics. New York: Wiley.
This page intentionally left blank.


