Previous Chapter: Index
Suggested Citation: "Color Plates." Institute of Medicine. 1991. Mapping the Brain and Its Functions: Integrating Enabling Technologies into Neuroscience Research. Washington, DC: The National Academies Press. doi: 10.17226/1816.

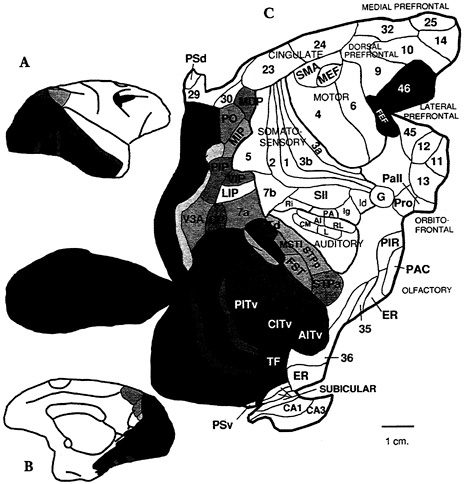
PLATE 2-1 Maps of the monkey cerebral cortex, with the visual processing region shaded. A and B are two-dimensional representations of the cerebral cortex from different perspectives. C is a two-dimensional map of an “unfolded” cortex, in which topological relationships are preserved and areal distortions kept to a minimum. This map was generated manually from the contours through a series of histological sections. Figure courtesy of David Van Essen, Division of Biology, California Institute of Technology.

Suggested Citation: "Color Plates." Institute of Medicine. 1991. Mapping the Brain and Its Functions: Integrating Enabling Technologies into Neuroscience Research. Washington, DC: The National Academies Press. doi: 10.17226/1816.

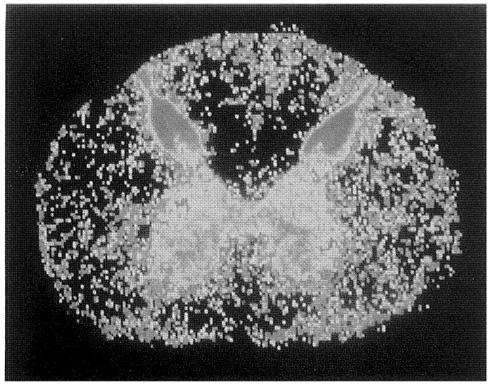
PLATE 2-2 Opiate receptor localization in spinal cord by autoradiography. High densities of opiate receptors (dark orange) are found in the dorsal horn, an area associated with pain perception. Autoradiographic imaging is useful for exploring sites of drug action and for understanding how drugs exert their effects. Image courtesy of Michael J. Kuhar, Neuroscience Branch, National Institute of Drug Abuse Addiction Research Center.

Suggested Citation: "Color Plates." Institute of Medicine. 1991. Mapping the Brain and Its Functions: Integrating Enabling Technologies into Neuroscience Research. Washington, DC: The National Academies Press. doi: 10.17226/1816.

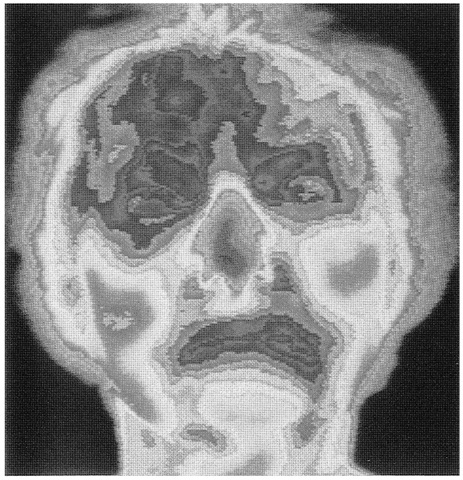
PLATE 2-3 Infrared thermograph of a patient with post-herpetic neuralgia, a condition involving persistent pain in areas affected by a herpes zoster infection at least three months after healing of the skin lesions. Areas of pathological pain are associated with increased skin temperature (red represents highest skin temperature). Figure reprinted from Rowbotham and Fields, 1989, with permission from Elsevier Science Publishers.

Suggested Citation: "Color Plates." Institute of Medicine. 1991. Mapping the Brain and Its Functions: Integrating Enabling Technologies into Neuroscience Research. Washington, DC: The National Academies Press. doi: 10.17226/1816.

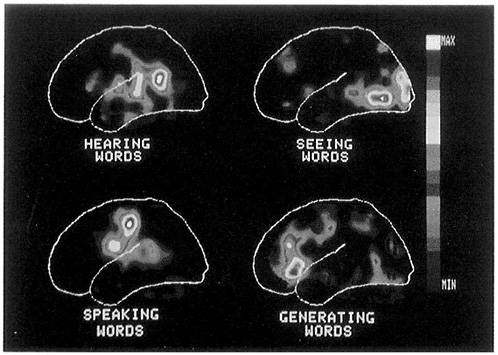
PLATE 3-1 Computerized PET images showing the changes in local blood flow in the brain, associated with local changes in neuronal activity, that occur during different states of information processing. Image courtesy of Marcus Raichle, Department of Neurology, Washington University School of Medicine.

Suggested Citation: "Color Plates." Institute of Medicine. 1991. Mapping the Brain and Its Functions: Integrating Enabling Technologies into Neuroscience Research. Washington, DC: The National Academies Press. doi: 10.17226/1816.

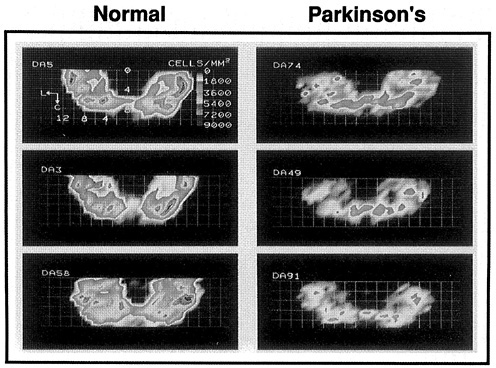
PLATE 3-2 Cell frequency maps illustrating the regional distribution of midbrain dopaminergic neurons in three normal and three parkinsonian brains. The colored areas represent regions that contain different frequencies of cells (e.g, white areas contain 1-1,800 cells per square millimeter (cells/mm2) and red areas contain 7,201-9,000 cells/mm2). The higher frequencies of cells are markedly reduced within the substantia nigra in the three parkinsonian brains. Reprinted from German et al., 1989, with permission from Annals of Neurology.

Suggested Citation: "Color Plates." Institute of Medicine. 1991. Mapping the Brain and Its Functions: Integrating Enabling Technologies into Neuroscience Research. Washington, DC: The National Academies Press. doi: 10.17226/1816.

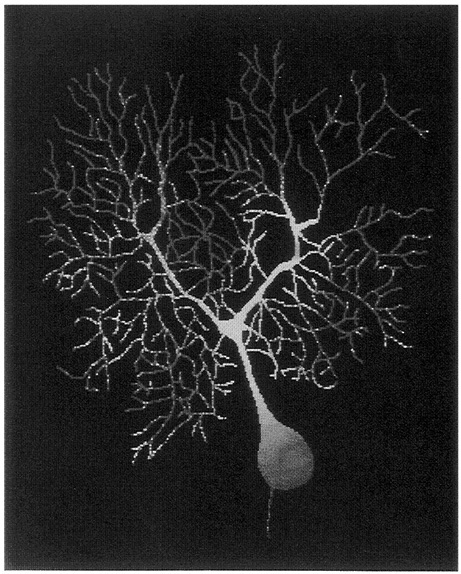
PLATE 3-3 False color map of intracellular calcium concentration in a guinea pig cerebellar Purkinje cell at the onset of a wave of complex spike activity. A high calcium concentration is observed in the outer portions of the dendritic tree. The map was produced from microfluorometric imaging of the fluorescent calcium indicator fura-2. Image courtesy of D.W. Tank and J.A. Connor, Molecular Biophysics Department, AT &T Bell Laboratories, Murray Hill, NJ; M. Sugimori and R. R. Llinas, Department of Physiology and Biophysics, New York University School of Medicine, New York, NY. Reprinted with permission of Science.

Suggested Citation: "Color Plates." Institute of Medicine. 1991. Mapping the Brain and Its Functions: Integrating Enabling Technologies into Neuroscience Research. Washington, DC: The National Academies Press. doi: 10.17226/1816.

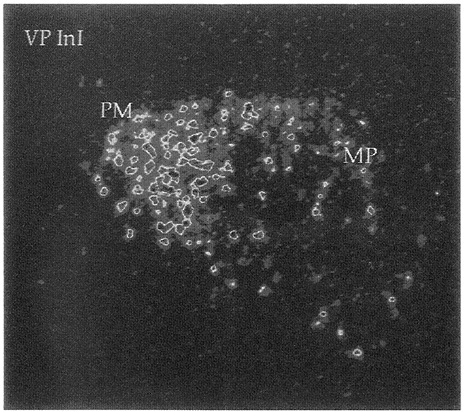
PLATE 3-4 Computer-enhanced image of vasopressin heteronuclear RNA in the hypothalamic paraventricular nucleus (PVN), as revealed by in situ hybridization utilizing a probe directed against vasopressin intronic (VP InI) gene sequences. The image is derived from an autoradiograph and demonstrates expression of the VP gene in functionally distinct divisions of the PVN (posterior magnocellular (PM) and medial parvocellular (MP) regions). Intronic in situ hybridization allows localization of short-lived heteronuclear RNA at the cellular level, and in combination with computer-based image analytic procedures can reveal rapid stimulus-induced changes in gene expression in discrete neuronal populations. Image provided by James P. Herman and Stanley J. Watson, Mental Health Research Institute, The University of Michigan.

Suggested Citation: "Color Plates." Institute of Medicine. 1991. Mapping the Brain and Its Functions: Integrating Enabling Technologies into Neuroscience Research. Washington, DC: The National Academies Press. doi: 10.17226/1816.

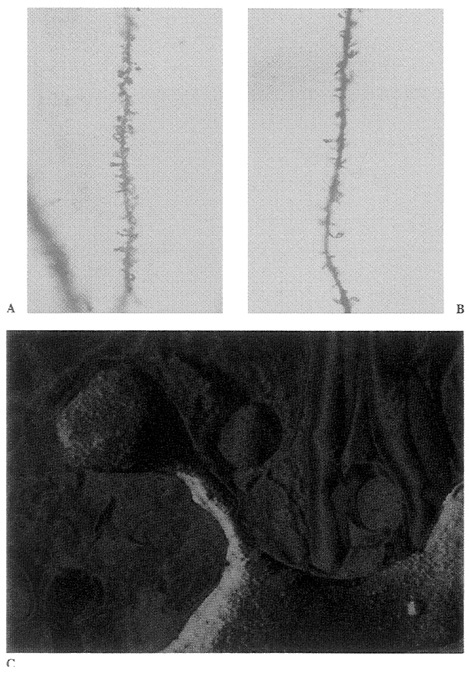
PLATE 3-5 Photomicrographs of dendrites from the brains of a A, a young animal, and B, an aged animal. The extensions from the main dendritic shaft are dendritic “spines.” Note the thinning of dendritic spines in the aged brain. C. Color-enhanced freeze-fracture of a single dendritic spine. Photomicrographs courtesy of Fidia Pharmaceutical Corporation.

Suggested Citation: "Color Plates." Institute of Medicine. 1991. Mapping the Brain and Its Functions: Integrating Enabling Technologies into Neuroscience Research. Washington, DC: The National Academies Press. doi: 10.17226/1816.

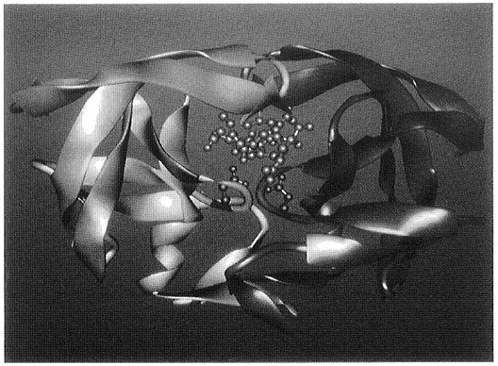
PLATE 4-1 A computer model of an enzyme molecule, the human immunodeficiency virus (HIV-1) protease. The structure was solved by members of the Crystallography Laboratory, National Cancer Institute, Frederick Cancer Research Facility, using synthetic protein supplied by the California Institute of Technology. Molecular graphics by the University of California, San Francisco (UCSF) Computer Graphics Laboratory using UCSF Midas-Plus. Copyright, Regents, University of California. Reprinted with permission.

Suggested Citation: "Color Plates." Institute of Medicine. 1991. Mapping the Brain and Its Functions: Integrating Enabling Technologies into Neuroscience Research. Washington, DC: The National Academies Press. doi: 10.17226/1816.

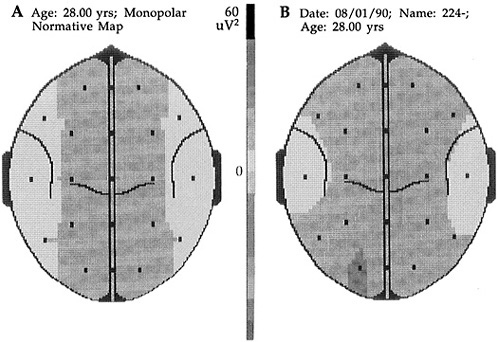
PLATE 4-2 Computer-assisted reconstruction of EEG activity. Computer software is used to transform an analog EEG signal into quantitative form, in this case, to examine the amplitude of activity of a specific frequency band (the Delta band). The EEG distribution is displayed over the entire scalp (nose is up). The delta power distribution of a normal person is seen in A while B shows the result obtained in a patient with an aneurysm of the left posterior communicating artery. Figure provided by M. E. Sumas and P. G. Newlon, Department of Neurosurgery, Eastern Virginia Medical School, Norfolk, Virginia.

Suggested Citation: "Color Plates." Institute of Medicine. 1991. Mapping the Brain and Its Functions: Integrating Enabling Technologies into Neuroscience Research. Washington, DC: The National Academies Press. doi: 10.17226/1816.

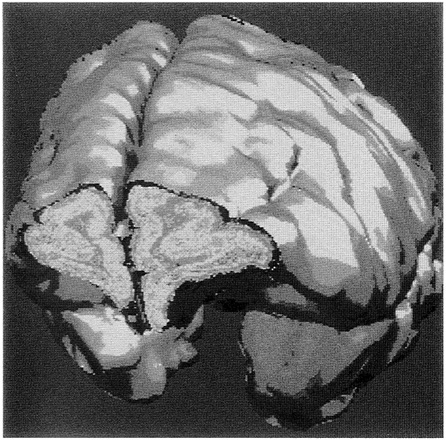
PLATE 4-3 Three-dimensional reconstruction of a monkey brain. The cortex has been rendered from histology, and the coronal section depicts glucose utilization derived from autoradiography. Image courtesy of Arthur W. Toga, Laboratory of Neuro Imaging, University of California, Los Angeles, School of Medicine.

Suggested Citation: "Color Plates." Institute of Medicine. 1991. Mapping the Brain and Its Functions: Integrating Enabling Technologies into Neuroscience Research. Washington, DC: The National Academies Press. doi: 10.17226/1816.

There was a problem loading page 164.

Suggested Citation: "Color Plates." Institute of Medicine. 1991. Mapping the Brain and Its Functions: Integrating Enabling Technologies into Neuroscience Research. Washington, DC: The National Academies Press. doi: 10.17226/1816.
Page 153
Suggested Citation: "Color Plates." Institute of Medicine. 1991. Mapping the Brain and Its Functions: Integrating Enabling Technologies into Neuroscience Research. Washington, DC: The National Academies Press. doi: 10.17226/1816.
Page 154
Suggested Citation: "Color Plates." Institute of Medicine. 1991. Mapping the Brain and Its Functions: Integrating Enabling Technologies into Neuroscience Research. Washington, DC: The National Academies Press. doi: 10.17226/1816.
Page 155
Suggested Citation: "Color Plates." Institute of Medicine. 1991. Mapping the Brain and Its Functions: Integrating Enabling Technologies into Neuroscience Research. Washington, DC: The National Academies Press. doi: 10.17226/1816.
Page 156
Suggested Citation: "Color Plates." Institute of Medicine. 1991. Mapping the Brain and Its Functions: Integrating Enabling Technologies into Neuroscience Research. Washington, DC: The National Academies Press. doi: 10.17226/1816.
Page 157
Suggested Citation: "Color Plates." Institute of Medicine. 1991. Mapping the Brain and Its Functions: Integrating Enabling Technologies into Neuroscience Research. Washington, DC: The National Academies Press. doi: 10.17226/1816.
Page 158
Suggested Citation: "Color Plates." Institute of Medicine. 1991. Mapping the Brain and Its Functions: Integrating Enabling Technologies into Neuroscience Research. Washington, DC: The National Academies Press. doi: 10.17226/1816.
Page 159
Suggested Citation: "Color Plates." Institute of Medicine. 1991. Mapping the Brain and Its Functions: Integrating Enabling Technologies into Neuroscience Research. Washington, DC: The National Academies Press. doi: 10.17226/1816.
Page 160
Suggested Citation: "Color Plates." Institute of Medicine. 1991. Mapping the Brain and Its Functions: Integrating Enabling Technologies into Neuroscience Research. Washington, DC: The National Academies Press. doi: 10.17226/1816.
Page 161
Suggested Citation: "Color Plates." Institute of Medicine. 1991. Mapping the Brain and Its Functions: Integrating Enabling Technologies into Neuroscience Research. Washington, DC: The National Academies Press. doi: 10.17226/1816.
Page 162
Suggested Citation: "Color Plates." Institute of Medicine. 1991. Mapping the Brain and Its Functions: Integrating Enabling Technologies into Neuroscience Research. Washington, DC: The National Academies Press. doi: 10.17226/1816.
Page 163
Suggested Citation: "Color Plates." Institute of Medicine. 1991. Mapping the Brain and Its Functions: Integrating Enabling Technologies into Neuroscience Research. Washington, DC: The National Academies Press. doi: 10.17226/1816.
Page 164
Subscribe to Emails from the National Academies
Stay up to date on activities, publications, and events by subscribing to email updates.