Review of the Research Program of the U.S. DRIVE Partnership: Fourth Report (2013)
Chapter: 5 Adequacy and Balance of the Partnership
5
Adequacy and Balance of the Partnership
Included in the previous chapters is an assessment of the status, progress, and barriers facing the various technologies that are under development by the U.S. DRIVE Partnership, which has evolved from its predecessor, the FreedomCAR and Fuel Partnership. Overall, technical progress has been steady and, in some cases, impressive. This chapter focuses on the adequacy and balance of the Partnership, including a review of and comments on budgetary resources and levels of effort expended toward each of the major budget line items.
In the three previous National Research Council (NRC) reports (NRC, 2005, 2008, 2010), the NRC reviewed the funding for the FreedomCAR and Fuel Partnership and the allocation related to that funding between hydrogen-related and non-hydrogen-related activities. Generally speaking, those earlier reviews concluded that the balance between technologies was largely appropriate. However, in the NRC (2010) Phase 3 report, it was noted that major shifts in emphasis and funding had occurred in the most recent 12 months. Those shifts and their continuation are explored in this chapter.
Since the beginning of the Partnership (U.S. DRIVE and its predecessor) and even earlier during the Partnership for a New Generation of Vehicles (PNGV) program, the NRC reviews have recommended government support emphasizing long-term, high-risk, high-payoff technologies. It was and is the view of the committee that this is an appropriate expenditure of government resources. However, recent economic conditions, including the need for government support to prevent the collapse of two major automobile manufacturers, influence what the committee and the government consider “appropriate.” It is still believed by the committee that support for precompetitive research on long-term technologies
such as the enablers for hydrogen to become a viable transportation fuel and the fuel cell research and development (R&D) leading to affordable hydrogen fuel cell vehicles (HFCVs) is important and should be continued. At the same time, the committee continues to agree that government support for technologies that have impact both in nearer and longer terms, especially those that could transfer some of the required transportation energy from petroleum to biofuels or to the electric grid, is also appropriate.
Historically, hydrogen-related activities represented approximately 70 percent of the DOE funding supporting technology development. This emphasis was consistent with the recommendations of prior NRC reports (e.g., The Hydrogen Economy: Opportunities, Costs, Barriers, and R&D Needs [NRC/NAE, 2004]) and the U.S. Department of Energy’s (DOE’s) Hydrogen Posture Plan: An Integrated Research, Development and Demonstration Plan (DOE, 2004). It was also consistent with continuation of President George W. Bush’s commitment to the funding of the first 5 years of the FreedomCAR and Fuel Partnership. However, as discussed in the NRC (2010) Phase 3 report, early in 2010 all initial funding requests for hydrogen-related activities for vehicles were withdrawn (although subsequently reinstated). The reasons given for this were that four major breakthroughs were required to achieve commercialization of HFCVs, and it was deemed highly unlikely that all four could be simultaneously achieved. The four major hurdles cited were the sustainable production of hydrogen, effective distribution, onboard hydrogen storage, and reliable low-cost fuel cells.
The NRC (2010) Phase 3 report noted that these four challenges are indeed huge, but also stated the belief that the other two possible pathways to achieving the ultimate Partnership goals of significant reduction of petroleum use and of emissions—namely, vehicles using biofueled internal combustion engines (ICEs) and highly electrified vehicles (e.g., plug-in hybrid electric vehicles [PHEVs] and battery electric vehicles [BEVs])—also face major challenges. The NRC Phase 3 review concluded that research on all three pathways deserved continued funding for the immediate future (see NRC, 2010, Appendix B, the Phase 3 interim letter report).
Since that time, the pattern of rebalancing the funding portfolio has continued. The share of DOE funding devoted to hydrogen activities has dropped from an FY 2009 total of $200 million to the FY 2012 total of $104 million, as shown in Table 5-1. Over the same period, battery R&D funding in the Vehicle Technologies Program (VTP) related to U.S. DRIVE Partnership efforts rose from $69 million to $90 million and from $23 million to $31 million for advanced combustion R&D (see Table 5-2). The relevant VTP budget has been steadily increasing, as shown in Table 5-2, growing from $174 million in FY 2009 to $238 million in FY 2012. As noted in the NRC (2010) Phase 3 report, other vehicle technologies receiving significant funding, such as more efficient electrical components
TABLE 5-1 Fuel Cell Technologies Program Funding Distribution, FY 2009 Through FY 2012
| FY 2009 (&) | FY 2010 (&) | FY 2011 (&) | FY 2012 (&) | |
| Fuel Cell R&D | 80,067,500 | 75,608,830 | 41,916,000 | 43,622,000 |
| Rescission | 0 | 0 | 0 | 188,000 |
| SBIR and STTR | 2,232,500 | 1,873,170 | 1,084,000 | 1,190,000 |
| TOTAL FUEL CELL R&D | 82,300,000 | 77,482,000 | 43,000,000 | 45,000,000 |
| Production and Delivery R&D | 10,000,000 | 14,601,000 | 17,521,000 | 16,918,000 |
| Rescission | 0 | 0 | 0 | 94,000 |
| SBIR and STTR | 0 | 399,000 | 479,000 | 488,000 |
| TOTAL PRODUCTION AND DELIVERY | 10,000,000 | 15,000,000 | 18,000,000 | 17,500,000 |
| Hydrogen Storage R&D | 57,823,000 | 31,149,000 | 14,601,000 | 16,918,000 |
| Rescission | 0 | 0 | 94,000 | |
| SBIR and STTR | 1,377,000 | 851,000 | 399,000 | 488,000 |
| TOTAL HYDROGEN STORAGE R&D | 59,200,000 | 32,000,000 | 15,000,000 | 17,500,000 |
| Technology Validation | 14,789,000 | 13,005,000 | 8,988,000 | 8,986,000 |
| SBIR and STTR | 211,000 | 92,000 | 12,000 | 14,000 |
| TOTAL TECHNOLOGY VALIDATION | 15,000,000 | 13,097,000 | 9,000,000 | 9,000,000 |
| Safety, Codes and Standards | 12,237,500 | 8,653,000 | 6,790,000 | 6,938,000 |
| SBIR and STTR | 262,500 | 186,000 | 210,000 | 62,000 |
| TOTAL SAFETY, CODES AND STANDARDS | 12,500,000 | 8,839,000 | 7,000,000 | 7,000,000 |
| Systems Analysis | 7,520,000 | 5,408,000 | 3,000,000 | 3,000,000 |
| SBIR and STTR | 192,825 | 148,000 | 0 | 0 |
| TOTAL SYSTEMS ANALYSIS | 7,712,825 | 5,556,000 | 3,000,000 | 3,000,000 |
| Manufacturing R&D | 4,480,000 | 4,867,000 | 2,920,000 | 1,944,000 |
| SBIR and STTR | 519,675 | 133,000 | 80,000 | 56,000 |
| TOTAL MANUFACTURING R&D | 4,999,675 | 5,000,000 | 3,000,000 | 2,000,000 |
| Market Transformation | 4,747,000 | 15,005,000 | 0 | 3,000,000 |
| SBIR and STTR | 0 | 21,000 | 0 | 0 |
| TOTAL MARKET TRANSFORMATION | 4,747,000 | 15,026,000 | 0 | 3,000,000 |
| Education | 4,200,000 | 2,000,000 | 0 | 0 |
| SBIR and STTR | 0 | 0 | 0 | 0 |
| TOTAL EDUCATION | 4,200,000 | 2,000,000 | 0 | 0 |
| FUEL CELL TECHNOLOGIES TOTAL | 200,659,500 | 174,000,000 | 98,000,000 | 104,000,000 |
NOTE: Acronyms are defined in Appendix E.
SOURCE: U.S. Department of Energy, Office of Energy Efficiency and Renewable Energy.
TABLE 5-2 FY 2009 Through FY 2012 DOE Vehicle Technologies Program Budget Distribution and Estimated Funds for Projects Related to U.S. DRIVE (or FreedomCAR) and 21st Century Truck Partnership (21CTP) Goals (New Structure-Prior Years Comparable) ($ thousands)
| FY 2011 DOE Budget Structure | FY 2009 Comparable Approp. with SBIR | FY 2009 Freedom CAR | FY 2009 21CTP | FY 2009 Other | FY 2010 Comparable Approp. wilh SBIR | FY 2010 Freedom CAR | FY 2010 21-CTP | FY 2010 Other |
| Batteries and elec. drive technol. Tech Val | 0 | 0 | 0 | 0 | ||||
| Energy Storage R&D | 69,425 | 69,425 | 0 | 0 | 76,271 | 76,271 | 0 | 0 |
| APEEM | 17,358 | 17,358 | 0 | 0 | 22,295 | 22,295 | 0 | 0 |
| SBIR/STTR | 2,713 | 2,713 | 2,839 | 0 | 2,839 | |||
| B&EDT Total | 89,496 | 86,783 | 0 | 2,713 | 101,405 | 98,566 | 0 | 2,839 |
| Vehicle sys, simula. & testing (VSST) | 21,126 | 18,210 | 2,916 | 0 | 43,732 | 38,232 | 5,500 | 0 |
| SBIR/STTR | 298 | 298 | 596 | 596 | ||||
| VSST Total Adv. combiis. eng. R&D | 21,424 | 18,210 | 2,916 | 298 | 44,328 | 38,232 | 5,500 | 596 |
| Combus. and Emission Control | 35,089 | 22,647 | 12,442 | 0 | 47,239 | 28,817 | 18,422 | 0 |
| SS Energy Conversion (formerly Waste Heat Recovery) | 4,568 | 2,780 | 1,788 | 0 | 8,748 | 6,221 | 2,527 | 0 |
| SBIR/STTR | 1,143 | 0 | 0 | 1,143 | 1,613 | 0 | 0 | 1,613 |
| Adv. Combus. Eng. R&D Total | ||||||||
| Materials technol. | 40,800 | 25,427 | 14,230 | 1,143 | 57,600 | 35,038 | 20,949 | 1,613 |
| Propulsion Materials Tech. | 10,742 | 5,882 | 4,860 | 0 | 12,989 | 7,344 | 5,645 | 0 |
| Lightweight Materials Technol. | 22,374 | 22,374 | 0 | 0 | 30,652 | 30,652 | 0 | 0 |
| HTML | 5,670 | 0 | 0 | 5,670 | 5,662 | 0 | 0 | 5,662 |
| SBIR/STTR | 1,117 | 0 | 0 | 1,117 | 1,420 | 0 | 0 | 1,420 |
| Materials Technol. Total Fuels technol | 39,903 | 28,256 | 4,860 | 6,787 | 50,723 | 37,996 | 5,645 | 7,082 |
| Adv. Petrol.-Based Fuels | 5,808 | 3,475 | 2,333 | 0 | 6,780 | 3,961 | 2,819 | 0 |
| Non-Petrol.-Based Fuels & Lubes | 13,751 | 9,720 | 4,031 | 0 | 16,641 | 11,463 | 5,178 | 0 |
| SBIR/STTR | 563 | 563 | 674 | 674 | ||||
| Fuels Technol. Total | 20,122 | 13,195 | 6,364 | 563 | 24,095 | 15,424 | 7,997 | 674 |
| Preliminary FY 2012 Plan—Subject to Change | |||||||
| FY 2011 Congress Request with SBIR | FY 2011 U.S. DRIVE | FY 2011 21CTP | FY 2011 Other | FY 2012 Final Approp. with SBIR | FY 2012 Planned U.S. DRIVE | FY 2012 Planned 21CTP | FY 2012 Planned Other |
| 0 | 0 | 0 | 0 | 0 | 0 | 0 | 0 |
| 81,549 | 81,549 | 0 | 0 | 89,934 | 89,934 | 0 | 0 |
| 21,614 | 21,614 | 0 | 0 | 27,806 | 27,806 | 0 | 0 |
| 2,972 | 0 | 2,972 | 3,579 | 0 | 3,579 | ||
| 106,135 | 103,163 | 0 | 2,972 | 121,319 | 117,740 | 0 | 3,579 |
| 42,647 | 30,047 | 12,600 | 0 | 47,198 | 34,598 | 12,600 | 0 |
| 581 | 0 | 0 | 581 | 635 | 635 | ||
| 43,228 | 30,047 | 12,600 | 581 | 47,833 | 34,598 | 12,600 | 635 |
| 47,239 | 29,500 | 17,739 | 0 | 49,320 | 30,799 | 18,521 | 0 |
| 8,748 | 8,000 | 748 | 0 | 8,707 | 8,000 | 707 | 0 |
| 1,613 | 0 | 0 | 1,613 | 1,764 | 1,764 | ||
| 57,600 | 37,500 | 18,487 | 1,613 | 59,791 | 38,799 | 19,228 | 1,764 |
| 12,989 | 6,108 | 6,881 | 0 | 12,576 | 5,914 | 6,662 | $0 |
| 29,097 | 26,977 | 2,120 | 0 | 27,284 | 25,164 | 2,120 | $0 |
| 5,662 | 0 | 0 | 5,662 | 970 | 0 | 0 | 970 |
| 1,375 | 0 | 0 | 1,375 | 1,241 | 0 | 0 | 1,241 |
| 49,123 | 33,085 | 9,001 | 7,037 | 42,071 | 31,078 | 8,782 | 2,211 |
| 0 | 0 | 0 | 0 | 0 | |||
| 10,692 | 5,835 | 4,857 | 0 | 17,904 | 9,771 | 8,133 | 0 |
| 308 | 0 | 0 | 308 | 544 | 544 | ||
| 11,000 | 5,835 | 4,857 | 308 | 18,448 | 9,771 | 8,133 | 544 |
| FY 2011 DOE Budget Structure | FY 2009 Comparable Approp. with SBIR | FY 2009 Freedom CAR | FY 2009 21CTP | FY 2009 Other | FY 2010 Comparable Approp. wilh SBIR | FY 2010 Freedom CAR | FY 2010 21-CTP | FY 2010 Other |
| Outreach, deploy. & analysis (OD&A) | 950 | 950 | 0 | 0 | 1,000 | 1,000 | 0 | 0 |
| Adv. Vehicle Competitions | 1,750 | 1,750 | 0 | 0 | 2,000 | 2,000 | 0 | 0 |
| Education | 0 | 0 | 0 | 0 | ||||
| Safety, Codes and Standards | 0 | 0 | 0 | 0 | ||||
| Legislative and Rulemaking | 1,804 | 0 | 0 | 1,804 | 2,004 | 0 | 0 | 2,004 |
| VT Deployment | 25,000 | 0 | 0 | 25,000 | 25,510 | 0 | 0 | 25,510 |
| Biennial Peer Reviews | 500 | 0 | 500 | 0 | 2,700 | 500 | 0 | 2,200 |
| VMT Reduction & Legacy Fleet Improvement | 0 | 0 | 0 | 0 | 0 | 0 | 0 | 0 |
| SBIR/STTR | 262 | 0 | 0 | 262 | 0 | 0 | 0 | 0 |
| OD&A Total | 30,266 | 2,700 | 500 | 27,066 | 33,214 | 3,500 | 0 | 29,714 |
| Vehicle Technol. Tolal | 242,011 | 174,571 | 28,870 | 38,570 | 311,365 | 228,756 | 40,091 | 42,518 |
NOTE: The following Fuel Cell line items were part of the Vehicle Technology Program (VTP) in FY 2009 but were transferred back to Hydrogen Fuel Cell Technologies (HFCT) in FY 2010: Technology Validation, $14,789; Safety, Codes and Standards, $12,238; Education, $4,200, Shaded areas indicate a name or structure change that began with the 2011 budget request. All budgets are shown in the 2011 structure. Acronyms are defined in Appendix E. Estimated budgets were received by the committee from DOE in early 2012 and may have changed since that time.
and lighter-weight materials, would all potentially benefit all future propulsion systems and are therefore judged worthwhile.
The recipients of DOE’s FY 2012 funds by sector (national laboratories, industry, academia, etc.) are shown in Figure 5-1. The pattern is broadly similar to that in prior years (see NRC, 2010, Figures 5-1 and 5-2).
The trend continues in the FY 2013 Office of Energy Efficiency and Renewable Energy (EERE) budget request illustrated in Table 5-3, with hydrogen activities (Fuel Cell Technologies Program [FCTP]) allocated $80 million (a reduction of 23 percent), while the VTP overall is allocated $420 million (an increase of almost 28 percent over the equivalent FY 2012 total of $329 million), including a 75 percent increase for battery R&D.
Toward the end of the period covered by the NRC Phase 3 report, another major initiative related to U.S. DRIVE Partnership goals emerged. That was the American Recovery and Reinvestment Act (ARRA) of 2009 and its massive funding of advanced technologies under the umbrella of economic stimulus. This
| Preliminary FY 2012 Plan—Subject to Change | |||||||
| FY 2011 Congress Request with SBIR | FY 2011 U.S. DRIVE | FY 2011 21CTP | FY 2011 Other | FY 2012 Final Approp. with SBIR | FY 2012 Planned U.S. DRIVE | FY 2012 Planned 21CTP | FY 2012 Planned Other |
| 1,000 | 1,000 | 0 | 0 | 995 | 995 | 0 | 0 |
| 2,000 | 2,000 | 0 | 0 | 1,991 | 1,991 | 0 | 0 |
| 0 | 0 | 0 | 0 | 0 | 0 | 0 | 0 |
| 0 | 0 | 0 | 0 | 0 | 0 | 0 | 0 |
| 2,004 | 0 | 0 | 2,004 | 1,992 | 0 | 0 | 1,992 |
| 27,410 | 0 | 0 | 27,410 | 27,876 | 0 | 0 | 27,876 |
| 500 | 500 | 0 | 0 | 3,500 | 500 | 0 | 3,000 |
| 0 | 0 | 0 | 0 | 2,912 | 2,912 | ||
| 0 | 0 | 0 | 0 | 79 | 0 | 0 | 79 |
| 32,914 | 3,500 | 0 | 29,414 | 39,345 | 6,398 | 0 | 32,947 |
| 300,000 | 213,130 | 44,945 | 41,925 | 328,807 | 238,384 | 48,743 | 41,680 |
expenditure is entirely separate from the U.S. DRIVE Partnership funding, but many of its initiatives are directly relevant to technology development activities within the Partnership. Of the ARRA funds assigned to DOE, $2.4 billion was allocated to vehicle electrification, including $1.4 billion for lithium-ion battery manufacture (and $100 million for other battery technologies), $500 million for electric drive component manufacturing, and $400 million for transportation electrification. (A modest share [1.5 percent] of the DOE ARRA funds was also allocated to support fuel cell purchases for non-automotive use, and this could have an indirect benefit to the U.S. DRIVE goals.)
As noted above, the ARRA-funded activities are beyond the purview of Partnership leadership or this committee, and DOE biofuel activity is also outside the Partnership, but it is nonetheless clear that taken together, VTP and ARRA funding represent a substantial emphasis on hybrid and battery electric vehicles, without concomitant emphases on the other two potential pathways to achieving Partnership and national transportation energy goals referenced above.
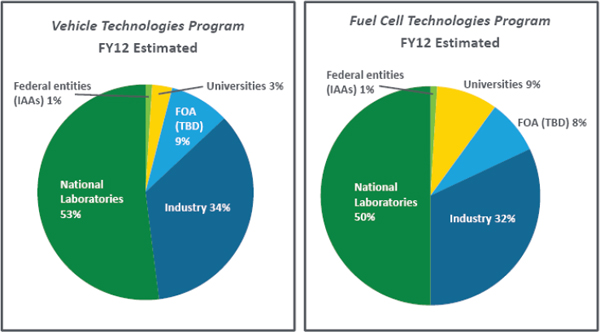
FIGURE 5-1 Department of Energy’s Office of Energy Efficiency and Renewable Energy planned program funding, by organization, FY 2012 (estimated). NOTE: IAA, Interagency Agreement; FOA (TBD), Funding Opportunity Announcement (to be determined). SOURCE: U.S. Department of Energy, Office of Energy Efficiency and Renewable Energy.
Adequacy and balance of the program depend on what the program intends to achieve and when. Reducing dependence on petroleum and reducing emissions are goals that are broad and nonspecific and not readily amenable to the setting of priorities. In that regard, engaging the Partnership’s Executive Steering Group to set clearer targets would be desirable in order to provide a framework for ranking technology readiness and for assessing the seriousness of hurdles and evaluating them against potential societal benefits over time. As an example, the National Academies’ report America’s Energy Future: Technology and Transformation (NAS/NAE/NRC, 2009) laid out a scenario of 2 to 4 percent electrified vehicles (PHEVs and BEVs) and 0 to 1 percent HFCVs by 2020, and 10 to 25 percent and 3 to 6 percent, respectively, by 2035. In order to achieve the projected volumes by 2035, significant improvements in battery performance are needed to make the vehicles attractive to the consumer. Extrapolating from current technologies without successful development of new chemistry, electric drive vehicles are more attractive than fuel cell vehicles for short-range usage, but less so for long-range travel. Thus, a large-scale replacement of petroleum usage by these alternate fuels will potentially rely on both technologies to satisfy consumer needs. It is appropriate to continue investing resources on the most impactful research in order to achieve these targets, and it is important to focus resources within each technology area on the greatest technical challenges (as discussed in Chapter 3), and also not to let the resource dwindle so far as to be unable to sustain a critical mass required to support a robust decision on any technology.
TABLE 5-3 Office of Energy Efficiency and Renewable Energy (EERE) Budget Summary, FY 2011 Through FY 2013 (Request)
| FY 2013 vs FY 2012 | |||||
| Programs | FY 2011 Current ($ thousands) | FY 2012 Enacted ($ thousands) | FY 2013 Request ($ thousands) | ($ Change) | (% Change) |
| Renewable Energy | |||||
| Biomass and Biorefinery R&D | 179,979 | 199,276 | 270,000 | 70,724 | 35.49 |
| Geothermal Technology | 36,992 | 37,862 | 65,000 | 27,138 | 71.68 |
| Hydrogen and Fuel Cell Technologies | 95,847 | 103,624 | 80,000 | (23,624) | -22.80 |
| Solar Energy | 259,556 | 288,951 | 310,000 | 21,049 | 7.28 |
| Water Power | 29,201 | 58,787 | 20,000 | (38,787) | -65.98 |
| Wind Energy | 78,834 | 93,254 | 95,000 | 1,746 | 1.87 |
| Energy Efficiency | |||||
| Advanced Manufacturing | 105,899 | 115,580 | 290,000 | 174,420 | 150.91 |
| Building Technologies | 207,310 | 219,204 | 310,000 | 90,796 | 41.42 |
| Federal Energy Management Program | 30,402 | 29,891 | 32,000 | 2,109 | 7.06 |
| Vehicle Technologies | 293,151 | 328,807 | 420,000 | 91,193 | 27.73 |
| Weatherization and Intergovernmental | 231,300 | 128,000 | 195,000 | 67,000 | 52.34 |
| Corporate | |||||
| Facilities and Infrastructure | 51,000 | 26,311 | 26,400 | 89 | 0.34 |
| Program Direction | 170,000 | 165,000 | 164,700 | (300) | -0.18 |
| Strategic Programs | 32,000 | 25,000 | 58,900 | 33,900 | 135.60 |
| Subtotal, EERE | 1,801,471 | 1,819,547 | 2,337,000 | ||
| Use of Prior-Year Balances | (29,750) | (9,909) | 0 | ||
| Cancellation of Prior-Year Balances | 0 | 0 | (69,667) | ||
| TOTAL. EERE | 1,771,721 | 1,809,638 | 2,267,333 | ||
NOTE: Numbers in parentheses signify the amount by which funding was reduced. SOURCE: U.S. Department of Energy, Office of Energy Efficiency and Renewable Energy.
Recommendation 5-1. The Executive Steering Group should be engaged to set targets for the U.S. DRIVE Partnership that are consistent with the objectives of reduced petroleum consumption and greenhouse gas emissions, and U.S. DRIVE should conduct an overall review of the Partnership portfolio, both for the adequacy of the R&D effort to achieve the targets and for focus on the mission of supporting longer-term, higher-risk precompetitive activities in all three potential primary pathways.
DOE (U.S. Department of Energy). 2004. Hydrogen Posture Plan: An Integrated Research, Development and Demonstration Plan. Washington, D.C.: U.S. Department of Energy. Available at http://www.eere.energy.gov/hydrogenandfuelcells/pdfs/hydrogen_posture_plan.pdf.
NAS/NAE/NRC (National Academy of Sciences/National Academy of Engineering/National Research Council). 2009. America’s Energy Future: Technology and Transformation. Washington, D.C.: The National Academies Press.
NRC. 2005. Review of the Research Program of the FreedomCAR and Fuel Partnership: First Report.
Washington, D.C.: The National Academies Press.
NRC. 2008. Review of the Research Program of the FreedomCAR and Fuel Partnership: Second Report. Washington, D.C.: The National Academies Press.
NRC. 2010. Review of the Research Program of the FreedomCAR and Fuel Partnership: Third Report. Washington, D.C.: The National Academies Press.
NRC/NAE (National Research Council/National Academy of Engineering). 2004. The Hydrogen Economy: Opportunities, Costs, Barriers, and R&D Needs. Washington, D.C.: The National Academies Press.


