Interregional Travel: A New Perspective for Policy Making (2016)
Chapter: APPENDIX: Federal Highway Administration Trip Table Estimation Method
APPENDIX
Federal Highway Administration
Trip Table Estimation Method
In view of the unlikelihood of a new American Travel Survey (ATS) being undertaken soon, the U.S. Department of Transportation’s Federal Highway Administration (FHWA) partnered with other modal agencies to estimate the number of long-distance (≥100-mile) person trips made in 2008. The FHWA trip tables are based on data for actual (ticketed) trips made by airline and train and on estimates for trips made by automobile and bus (scheduled, tour, and charter). Counts of trips by airline and train are accurate because they are derived from records of ticket purchases; ground access surveys are used to assign the air and train trips to specific county origins and destinations. Long-distance trips made principally by automobile and bus are more difficult to estimate in the absence of actual or survey-derived trip data for these modes. To compensate for the lack of data, FHWA used the 1995 ATS data to estimate the number of automobile and bus trips made in 2008. Linear regression equations were developed that explained the 1995 ATS results on the basis of 1995 Census Bureau employment and demographic data. Estimates for 2008 were then made by using 2008 Census Bureau data as input for the explanatory variables in the equations.
According to the FHWA tables, about 2 billion long-distance person trips were made in 2008. As in 1995, more than three-quarters of long-distance trips were estimated to have been made by automobile, nearly 20 percent by air, and 3 to 4 percent by rail and bus. The 2 billion total trips in 2008 are a 100 percent increase since 1995 and a 50 percent increase since the 2001–2002 National Household Travel Survey. The amount of long-distance trip making by rail grew the most on a percentage basis, up nearly 250 percent from 1995 to 2008.
The updated FHWA trip tables are the only comprehensive data set from which estimates of intercity trips by mode can be made that take into account economic and demographic trends since 1995. The FHWA trip calculations for 2008 are examined in more detail below. The focus is on trip making in the most heavily traveled intercity markets in the 100- to 500-mile distance range.
AIR AND RAIL TRIPS
Airline and rail trips are estimated by using 2008 Amtrak station-to-station ticketing data and the U.S. Department of Transportation airline ticket sample (known as Databank 1B), which contains itinerary data for one in 10 tickets purchased.
AUTOMOBILE TRIPS
The following trip generation and distribution equations were developed by using 1995 Census Bureau population, household, and industry employment [Quarterly Census of Employment and Wages (QCEW)] data to explain the 1995 ATS results. To obtain results for 2008, 2008 Census Bureau data were used as inputs for the explanatory variables in the equations. Special generation models were developed to account for tourist and cross-border trip making in relevant locations.
Trip Generation Model
Linear regression models were estimated by using employment and population variables to predict 1995 ATS trips at the state level. The production and attraction equations by trip purpose are shown in Equations 1 to 4.
Business trip productions = 0.47692 × Census population

Nonbusiness trip productions = 2.19893 × Census population

Business trip attractions = 1.09773 × QCEW employment

Nonbusiness trip attractions = 6.573 × QCEW leisure and hospitality and service providing industry employment

Trip Distribution Model
The balanced productions were distributed by using a destination choice model. The multinomial logit formulation for each trip purpose is shown in Equations 5 and 6. The trips are distributed from zone i to zone j on the basis of the share of zone i among all possible zones in the choice set.


Special Generators
To estimate trips to national parks, at cross-border points, and to places such as Las Vegas and Orlando that attract a large portion of visitors not necessarily captured by the ATS, the models use data from the National Park Service; the Bureau of Transportation Statistics (for cross-border inbound trips); and visitors bureau data from Las Vegas, Niagara Falls, and Orlando. The generated values are allocated to their production and attraction zones on the basis of the nonbusiness trip distribution (Equation 6).
BUS TRIPS
To derive bus trips for 2008, the following trip generation and estimation equations were developed, and 2008 Census Bureau data on population, households, and industry employment were used as inputs for the explanatory variables. Special generation models were developed to account for tourist and cross-border trip making in relevant locations.
Trip Generation
Trip generation rates were estimated by using the 1995 ATS:
| Age (years) | Income | Vehicles | |
| 0 | 1+ | ||
| Under 18 | <35,000 | 0.062 | 0.097 |
| 35,000–75,000 | 0.872 | 0.155 | |
| >75,000 | 0.868 | 0.156 | |
| 18–64 | <35,000 | 0.342 | 0.474 |
| 35,000–75,000 | 0.619 | 0.263 | |
| >75,000 | 0.411 | 0.151 | |
| 65 and older | <35,000 | 0.679 | 0.212 |
| 35,000–75,000 | 1.045 | 0.190 | |
| >75,000 | 1.051 | 0.097 | |
Trip Distribution
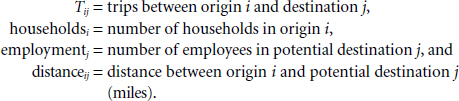
The bus passenger destination choice model is formulated as follows and was estimated by using the 1995 ATS data:

where
Special Generators
Trips from the following two sources were added:
- Cross-border entry points between the United States and Canada and between the United States and Mexico. The actual number of border
crossings by persons traveling by bus in 2008 is reported in the Bureau of Transportation Statistics–Transportation Security Administration database. On the basis of information from Statistics Canada about the destination state of Canadians entering the United States, the model developer used a factor of 0.75 to convert border crossings into long-distance trips.
- Trips destined for popular recreation locations outside of large metropolitan areas not likely to be addressed adequately by the ATS. The ATS indicates the state and metropolitan statistical area (MSA) of a trip end but does not indicate the location of trips outside of MSAs. Trips were added to account for travel to National Park Service locations and for a limited number of other destinations such as Niagara Falls, Orlando, and Las Vegas. On the basis of information from National Park Service visitor surveys, the model developer used a factor of 0.05 to estimate the total number of visitors arriving by bus and a factor of 0.88 to convert total visitations to long-distance trips.


