Undergraduate Research Experiences for STEM Students: Successes, Challenges, and Opportunities (2017)
Chapter: Appendix A: STEM Participation Rates
Appendix A
STEM Participation Rates
Table A-1 is reproduced from Eagan and colleagues (2014), which was commissioned for Barriers and Opportunities for 2-Year and 4-Year STEM Degrees: Systemic Change to Support Students’ Diverse Pathways (National Academies of Sciences, Engineering, and Medicine, 2016). It analyzes data collected from the Cooperative Institutional Research Program’s annual Freshman Survey, which surveys hundreds of thousands of students at four-year colleges and universities nationwide. The data presented are from the incoming students in Fall 2012.
Figure A-1 is from Estrada and colleagues (2016) and reflects the current percentages of science, technology, engineering, and mathematics (STEM) degrees for the following populations: underrepresented minority (including African American, Hispanic or Latino/Latina, American Indian, and Alaskan Native), white, and Asian/Pacific Islander. The data were derived from the data tables prepared by the National Center for Science and Engineering Statistics and based on data from the U.S. Department of Education’s IPEDS 2010 Completions Survey.
TABLE A-1 Student Characteristics and Precollege Preparation Across STEM Disciplines and Social Sciences, as Percentages of Total Students by Discipline Category
| Student Characteristics | Biological Sciences (15,338) | Engineering (15,727) | Math/Computer Science (3,850) | Physical Science (4,140) | Social Science (20,763) | |
|---|---|---|---|---|---|---|
| Gender | ||||||
| Men | 40 | 79 | 75 | 57 | 30 | |
| Women | 61 | 21 | 25 | 43 | 70 | |
| Race | ||||||
| American Indian | <1 | <1 | <1 | <1 | <1 | |
| Asian | 14 | 13 | 16 | 10 | 7 | |
| Black | 8 | 6 | 8 | 5 | 10 | |
| Latino | 9 | 9 | 8 | 6 | 14 | |
| White | 54 | 59 | 53 | 65 | 53 | |
| Other | 15 | 13 | 15 | 14 | 15 | |
| Income | ||||||
| Below $50K | 30 | 25 | 32 | 26 | 38 | |
| $50K-$100K | 30 | 32 | 31 | 34 | 29 | |
| Above $100K | 40 | 43 | 37 | 40 | 33 | |
| Mother’s education | ||||||
| No college | 26 | 23 | 27 | 22 | 31 | |
| Some college | 16 | 15 | 16 | 16 | 17 | |
| College degree or higher | 59 | 62 | 58 | 62 | 52 | |
| Precollege preparation | ||||||
| HS GPA: A- or higher | 62 | 62 | 55 | 64 | 45 | |
| Years of HS math: 4 or more | 92 | 94 | 92 | 92 | 84 | |
| Years of HS physical science: 3 or more | 29 | 39 | 33 | 50 | 28 | |
| Years of HS biological science: 3 or more | 29 | 12 | 13 | 16 | 18 | |
| Completed calculus | 39 | 51 | 45 | 45 | 24 | |
| Completed AP calculus | 42 | 60 | 51 | 50 | 22 | |
NOTES: Total student enrollment is shown under each discipline category. Numeric values are the percentage of this total. AP = advanced placement; GPA = grade point average; HS = high school.
SOURCE: Eagan et al. (2014, Table 2).
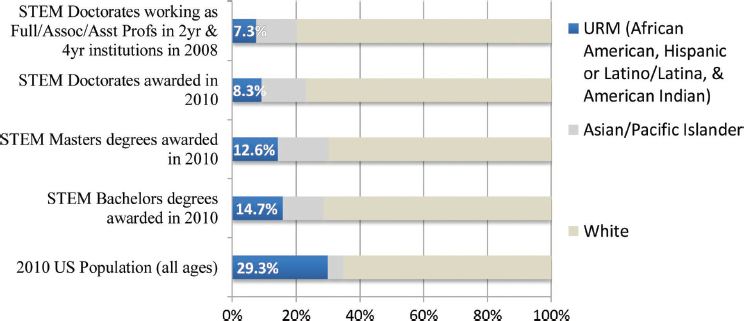
NOTE: URM (underrepresented minorities) includes African American, Hispanic or Latino/Latina, American Indian, and Alaskan Native. In this analysis, “STEM degrees” includes degrees categorized by the National Science Foundation as “Science & Engineering” (but excludes degrees in psychology and social sciences) in data tables prepared by the National Center for Science and Engineering Statistics and based on data from the U.S. Department of Education’s Integrated Postsecondary Education Data System (IPEDS) 2010 Completions Survey.
SOURCE: Reproduced from Estrada et al., 2016, Figure 1, p. 2. Permission was granted by the authors.
REFERENCES
Eagan, K., Hurtado, S, Figueroa, T., and Hughes, B. (2014). Examining STEM Pathways among Students Who Begin College at Four-Year Institutions. Paper commissioned for the Committee on Barriers and Opportunities in Completing 2- and 4-Year STEM Degrees. Washington, DC. Available: http://sites.nationalacademies.org/cs/groups/dbassesite/documents/webpage/dbasse_088834.pdf [December 2016].
Estrada, M., Burnett, M., Campbell, A.G., Campbell, P.B., Denetclaw, W.F., Gutiérrez, C.G., Hurtado, S., John, G.H., Matsui, J., McGee, R., Okpodu, C.M., Robinson, T.J., Summers, M.F., Werner-Washrune, M., and Zavala, M. (2016). Improving underrepresented minority student persistence in STEM. CBE–Life Sciences Education, 15(es5), 1-10.
National Academies of Sciences, Engineering, and Medicine. (2016). Barriers and Opportunities for 2-Year and 4-Year STEM Degrees: Systemic Change to Support Students’ Diverse Pathways. S. Malcom and M. Feder (Eds.). Committee on Barriers and Opportunities in Two- and Four- Year STEM Degrees. Board on Science Education. Division of Behavioral and Social Sciences and Education. Board on Higher Education and the Workforce. Policy and Global Affairs. Washington, DC: The National Academies Press.


