Provision of Alternative Services by Transit Agencies: The Intersection of Regulation and Program (2023)
Chapter: Chapter 5 - Monitoring and Evaluation

CHAPTER 5
Monitoring and Evaluation
Chapter 5 focuses on monitoring the use and cost of the alternative service and evaluating whether it’s meeting the defined objectives.
Monitor Data Trends
Data Analysis
Examining and assessing data from your providers on a routine basis allow you to understand how the service is performing and its costs to the transit agency. Particularly in the early months of the alternative service, watching the trends month by month, or even better week by week if that is how you required the data to be submitted, allows you to monitor growth in ridership and accompanying costs. It also allows you to spot any anomalies or the beginning of a new trend that merits specific attention.
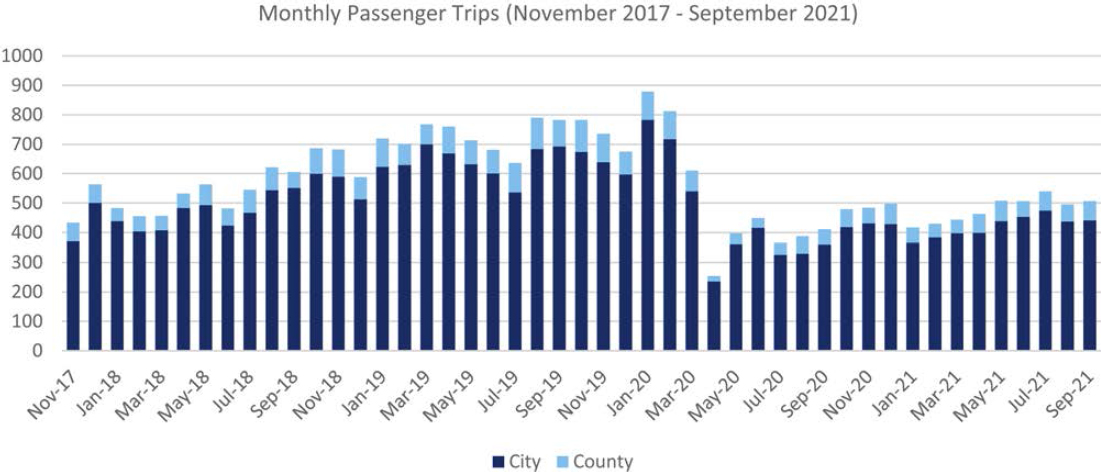
Flagstaff’s transit agency, Mountain Line, monitors and reports monthly ridership on its taxi subsidy program, the alternative service in the City of Flagstaff and Coconino County; see Figure 5-1. The decrease that starts in March 2020 results from the COVID pandemic.
Rider Feedback
It’s also important to understand your riders’ experience. Discuss the alternative service with your disability advisory group and key stakeholders in the disability community. What are the experiences of riders? What have stakeholders heard? Are there issues with a particular provider? What about riders who need a WAV? Listen for any complaints from riders and follow up with providers as needed.
A survey of riders can be helpful to understand riders’ experiences and perspectives. Particularly if you started the service with a subset of riders, be sure to get their input as that may be useful when considering changes as you move from pilot status.
A survey or even better a travel log may be used to help gauge response times, an important performance measure to monitor given ADA requirements for service equivalency. What do the riders report on how long it takes for the vehicle to arrive? This is particularly important for riders who need a WAV; the response times for WAV riders should be equivalent to those who can use a sedan (see Chapter 8 for more on service equivalency, particularly the agreement between the U.S. Department of Justice and the MBTA in Boston that resolved complaints about response time for riders needing a WAV).
However, when reviewing rider feedback on response time, it’s useful to know that riders typically overstate how long they wait for transit service. Research on the difference between
perceived wait time and actual wait time has focused more on fixed-route service, but experience with demand-response service shows riders tend to overestimate how long they wait. Despite this, listening to riders’ reports on response time may shed light on performance issues that need more attention and can be compared to actual data from your providers.
Beyond a survey, another option is a travel log that prompts the rider to record data on trip requests, including the date and time the trip request was made and the date and arrival time of the vehicle. A travel log tends to be more accurate than a survey. Some basic information accompanying the log, such as the requested pickup time for advance reservations and whether a WAV was requested, will help you distinguish between WAV and non-WAV response times for on-demand trips and on-time performance for advance-request trips.
Evaluate
Once the alternative service is beyond its early start-up phase and you have 6–12 months of ridership and cost data, an evaluation will show progress in achieving the objectives defined for the service.
Broward County Transit (BCT) tracks various data and reports performance measures for its alternative service, including total cost, total trips, and average cost per trip (Table 5-1). BCT compares the latter metric with the average cost for ADA paratransit trips to assess achievement
Table 5-1. BCT’s on-demand service, Rider’s Choice.
| 12 Months ending 1/2019 | 12 Months ending 1/20 | 12 Months ending 1/21 | 12 Months ending 1/22 | |
|---|---|---|---|---|
| Total Cost | $74,323 | $290,788 | $431,018 | $499,088 |
| Trips Taken | 6,463 | 22,279 | 29,975 | 32,521 |
| Avg. Cost/Trip | $11.50 | $13.50 | $14.38 | $15.35 |
of one of its objectives for the alternative service, “provide additional trips at a lower cost to the County.” Data for 2019–2021 show the objective has been achieved: cost per alternative service trip was less than cost per ADA paratransit trip by 59–65%.
Does the Alternative Service Achieve the Primary Objectives?
Through the survey, the research identified two primary objectives that transit agencies reported for implementing an alternative service:
- Provide an on-demand/same-day mobility option for paratransit customers
- Reduce overall cost and/or unit cost per trip for transporting paratransit customers
Methods for evaluating the alternative services were explored through the case study research. The research team examined how the five case study agencies evaluated their alternative service in relation to the defined objectives (summaries of those methods are in Chapter 7; more detailed descriptions are in Appendix A).
By nature of an alternative service, all case study agencies achieved the first objective of providing an on-demand or same-day transportation option for their ADA paratransit riders.
Evaluating whether the second objective, cost reduction, has been achieved requires an analysis of the ridership and cost data with comparisons to the cost for ADA paratransit.
Four of the five case study transit agencies use relatively straightforward methods for evaluation: comparing costs for on-demand trips to costs for ADA paratransit and calculating the difference.
- The Greater Richmond Transit Company (GRTC; see Table 5-2) and BCT calculate the savings to the transit agency had the trips on the alternative service been provided by their ADA paratransit service. While this method demonstrates the cost-effectiveness of the alternative service, it does not account for induced demand. Design features of the alternative service can help “protect” the transit agency from new costs for an on-demand service. GRTC, for example, designed its alternative service with a fare that is twice that for ADA paratransit and with a relatively modest subsidy, which at $15 is about half the cost of an ADA paratransit trip. These features help moderate any new demand induced by the alternative service.
- For San Antonio’s transit agency, VIA, available data show costs for its alternative service can be assessed by examining the average cost per trip on the transit agency’s taxi subsidy program compared to the average cost per ADA paratransit trip. Data for 2020 shows that comparison as $8.40 to $48.36. VIA uses federal Section 5310 funds for the taxi subsidy program which reduces the transit agency’s average cost per taxi subsidy trip; for 2020, that cost is $4.23, about 90% less than the average cost for an ADA paratransit trip.
Table 5-2. Savings to GRTC from the alternative service, CARE On-Demand.
| 2018 | 2019 | 2020 | 2021 (10 mos.) | |
|---|---|---|---|---|
| Total Cost to GRTC for CARE On-Demand Trips | $319,270 | $433,241 | $331,482 | $347,946* |
| Cost per ADA Paratransit Trip | $28.21 | $28.19 | $32.71 | $36.39* |
| Total Cost if CARE On-Demand Trips Were Provided by ADA Paratransit | $617,911 | $819,791 | $720,457 | $844,503* |
| Savings to GRTC | $298,641 | $386,550 | $388,974 | $496,557* |
* Preliminary cost figures.
- The Flagstaff transit agency’s on-demand service is a user-side subsidy, with less data available for evaluation compared to a provider-side subsidy program. The transit agency can use data from the taxi payment card riders use to pay for trips to assess achievement of one of its program objectives: to lower the cost per trip of transporting ADA paratransit customers. With available data for 2019, the cost per trip for the alternative service was $10.50, compared to the ADA paratransit cost per trip for FY2019 of $46.05. As detailed in the full case study write-up, this would produce a “savings” of $35.55 for each trip that would otherwise have been taken on ADA paratransit. However, there is no hard data to evidence which of the on-demand taxi program trips would have otherwise been taken on ADA paratransit and which of the taxi trips would not have been taken on ADA paratransit.
Boston’s MBTA was the one case study agency that uses a more complex evaluation method with a calculation of the degree and cost of induced demand. The MBTA compared the cost per trip for its on-demand program with its ADA paratransit service: $15.92 versus $56.62. With an estimated mode shift from ADA paratransit to the alternative service and calculation of the number of induced trips, the MBTA found a $1.01M (3.3%) reduction in total operational costs for ADA paratransit while total annual ridership increased by over 50%, from 710,000 to 1.07 M trips. With the alternative service supplementing ADA paratransit, the MBTA was able to provide more trips and improve mobility of many of its customers while slightly reducing overall costs. See the full case study write-up in Appendix A for a more detailed explanation, including the method for calculating the number of new induced trips.
Report to the Board
Once the data are analyzed and the alternative service evaluated, those findings can be reported to your transit agency’s board and other policymakers.
Should There Be Adjustments or Revisions?
Depending on data trends, the evaluation of the service, and rider feedback, the alternative service may benefit from adjustments or revisions. Be willing to consider and make changes as merited by experience. This may be facilitated if you implemented the alternative service as a pilot.
Be sure to communicate to your riders when changes are being considered and implemented. Again, it’s useful to have started the service as a pilot and advertised that fact to riders and the community. In any event, be sure to prepare new informational materials that explain the changes and reach out directly to riders and stakeholders to clearly explain what has changed and, as appropriate, the reasons why.
Modify Contracts as Needed
With revisions and changes to the alternative service program, contracts with providers may need to be modified. The need for program revisions should not be unexpected with a new service, particularly if using TNCs or other new transportation companies that have emerged in the last 10 or so years.
Use the Data Tool to Estimate Cost Reduction
If one of the objectives of your alternative service is to reduce overall costs for ADA paratransit, the research project developed a data tool to estimate whether that is achieved.
The tool serves two primary purposes.
- In the planning phases, it will help you estimate the costs and potential savings of the ADA paratransit service and the alternative service based on expected ridership and different what-if subsidy scenarios.
- It will calculate actual net savings resulting from the alternative service by estimating the savings from the alternative service trips that otherwise would have been taken on ADA paratransit and comparing that to the subsidies paid out for the induced trips the alternative service generates.
For planning, you can input data about your transit agency’s current paratransit services along with assumptions of the desired alternative service subsidy to determine estimated future costs and ridership. These data inputs include annual data for paratransit operational costs, trips, and active users. The service design parameter inputs include the alternative service subsidy level and payment design for the subsidy. The tool then calculates estimated future ridership and costs for both the ADA paratransit and alternative service programs, helping you determine estimated overall net changes in costs and trips provided.
For actual net savings, the tool first estimates what the ADA paratransit ridership would have been if the alternative service had not been implemented. This is used to determine the number of induced trips from the alternative service design and resulting estimated mode-shift trips from paratransit to the alternative service. The tool then uses these ridership figures to calculate the estimated net cost savings (or increase) based on the calculated cost per trip for each service type and additional subsidy costs that would occur with the alternative service.
In summary, you can use this tool to help determine how an alternative service program would or did provide a level of benefit in net cost savings and/or increased trips served for paratransit customers. Chapter 6 presents the tool and explains its use.
Checklist
□ Implement a routine performance assessment process for your alternative service, including defined measurable metrics, procedures and responsibilities for measurement processes, and evaluation frequencies.
□ Consider monitoring service performance more frequently during the initial weeks/months of the alternative service.
□ Gather feedback from riders and nonriders about the alternative service through surveys, call centers, or dynamic feedback options in smartphone apps.
□ Monitor rider feedback to help determine whether service adjustments need to be made.
□ Evaluate the alternative service at specified intervals against set performance metrics and objectives for the service.
□ Report monitoring and evaluation findings to the policy board.
□ Determine whether adjustments or larger revisions to the alternative service should be made based on data trends.
□ Modify contract agreements with transportation providers as needed based on findings in the monitoring and evaluation processes.


