Performance-Based Track Geometry, Phase 3 (2023)
Chapter: Chapter 4 Machine-Learning Simulations and Findings
CHAPTER 4
Machine-Learning Simulations and Findings
4.1 Neural Network Development
A complex dynamic relationship exists between vehicle response, track geometry, and operating speeds. PBTG technology emphasizes the fact that the car dynamic response results directly from a combination of many track geometry variables acting together with vehicle operating conditions. Adverse vehicle responses do not always result from individual track geometry defects but from the dynamic interaction of the vehicle with all the track geometry parameters in the track segment where the unwanted response occurs. Use of NNs in the PBTG system allows all track geometry parameters and vehicle operating conditions to relate to vehicle performance.
The NN models developed for the carbody accelerations and single wheel forces are networks of artificial neurons or nodes and are structured into the following layers:
- Input Layer: One single layer; consists of the values of the track geometry statistics, average speed, and synthetic channels that pass on the information they carry to the nodes in the hidden layers and perform no computations.
- Hidden Layer: Two hidden layers; perform needed computations and pass on the information obtained from the input layer to the nodes in the output layer.
- Output Layer: One single layer; consists of either the carbody accelerations, such as lateral or vertical accelerations, or single wheel forces, such as maximum lateral/vertical force ratio (L/V ratio) or minimum vertical force (V).
The output node values in one layer serve as input values for the nodes in the next layer. Connections between nodes have weight associated with them. The node computes a weighted sum of values derived from incoming information. The sum is referred to as the activation value which, in turn, is passed to the node’s non-linear transfer function to generate the node output. The combination of nodes, layer connections, weights, and transfer functions make up the architecture of a NN. Figure 13 shows a schematic of the simplified architecture of a NN.

4.1.1 Carbody Accelerations Models
In Phase 3, the NN model training and validation data sets were selected randomly from the on-track test data segments that stretched from Newark to the World Trade Center and from Exchange Place to Newark. These two lines presented more RQ issues and were considered the optimum choice for allowing the models to best learn how to recognize track geometry degradation patterns and the operating conditions associated with the recorded RQ issues.
The data was processed to build a synchronized database of RQ and track geometry to develop the NN models. The data was gathered from the dynamic responses of the PATH PA5 car to selected track and operating conditions. Additionally, to expand the training data, a few dynamic events from the PA5 NUCARS model car simulations at 10 mph below track speed were included.
MxV Rail used the PA5 NUCARS model developed and validated during Phase 2 of the project. Prior to using the model for the simulation efforts, MxV Rail confirmed with PATH that the PA5 car had no design changes since being tested in 2013, particularly the vehicle suspension that could likely affect the vehicle dynamic behavior. In conclusion, no adjustments were needed for the PA5 NUCARS model.
To derive track speeds for the NUCARS simulation, PATH track charts were obtained and analyzed, and track allowable speeds were derived for various track sections of the Newark to Exchange Place tracks (both directions). Based on the track speed, a speed matrix was set up for running the PA5 NUCARS model at track allowable speeds as well as at 5 mph and 10 mph below track speed.
The PA5 NUCARS model was updated so that the track geometry parameters used for the simulation, including raw mid-chord offset track geometry data, were integrated and synchronized with all outputs after the simulations were completed (NUCARS simulations can only be run with space curve geometry). The input variables to the NN model included:
- Track geometry
- Alignment
- Surface
- Gage
- Superelevation/Cross level
- Curve
- Track speed
- Synthetic channels related to vehicle/track interaction
For the track geometry variables, statistic values, such as maximums, minimums, standard deviations, averages, 5th and 95th percentiles were used. The track geometry statistics were computed over 0.1-mile track segments with a 50-foot moving window. The NN model was trained to predict the following output variables:
- Driver cab maximum lateral and vertical accelerations
- Carbody maximum trailing lateral and vertical accelerations
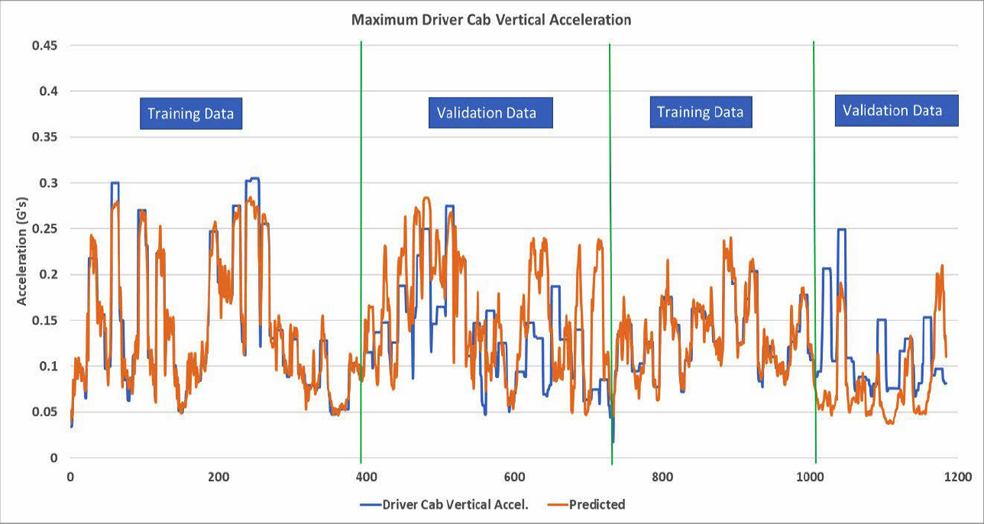
The training data subsets delineated in the graphs of this Section and Section 4.1.2 were used to teach the models to recognize vehicle response patterns and trends. The validation subsets were held out to evaluate how the model performed with new, previously unseen data during the model training. The training and validation data sets were randomly selected. The random data selection tends to decrease the risk of overfitting the model and enabling it to be more accurate once deployed on a fresh set of data.
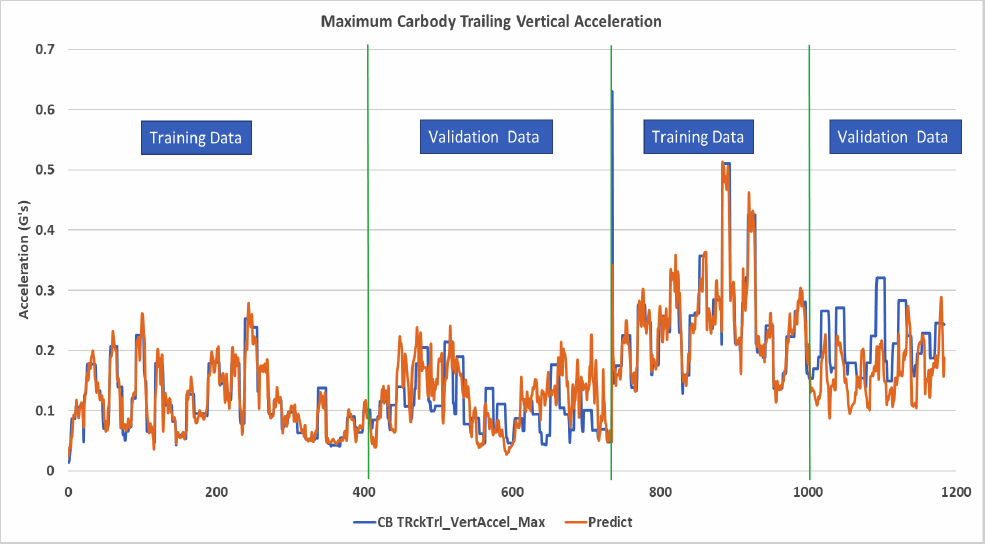
Figure 14 and Figure 15 show the model predictions of the PA5 car maximum driver cab lateral and vertical accelerations (in orange), respectively, contrasted with the test data (in blue). On the validation data, the model predicted the driver cab lateral and vertical accelerations with 70 and 60 percent confidence, respectively. Figure 16 and Figure 17 show the model predictions of the maximum carbody trailing lateral and vertical accelerations (in orange), respectively, contrasted with test data (in blue). The trailing lateral and vertical accelerations were predicted with 64 and 60 percent confidence, respectively. The flat peaks in the data are due to a 50-foot moving window as data is partitioned into 0.1-mile segments and variable statistics are used.
Based on MxV Rail’s extensive experience in developing and field-testing machine-learning models for several freight cars, 80 percent confidence or higher is needed to deploy the models in a revenue service environment to assess track health and generate remedial action reports for RQ issues. The machine-learning technique still shows merit. Although the models did not always accurately predict the acceleration amplitude, they predicted similar lateral and vertical acceleration general trends on the validation data sets. The predictive performance, however, did not reach or exceed the 80 percent confidence limit. The model performance observed was due to insufficient presence of degraded geometry in PATH track segments and the corresponding adverse vehicle responses to it. More degraded geometry data carrying predictive information is needed for the model to better learn how to recognize the specific track and operating condition patterns that are likely to generate unwanted vehicle responses that lead to RQ issues.


4.1.2 Wheel-Rail Forces Model
The current PBTG system for freight vehicles simulates the maximum L/V ratio and the wheel minimum vertical force at the wheel-rail interface for track segments. If prescribed performance limits are exceeded, the PBTG outputs a track geometry maintenance report that recommends remedial action concerning track geometry deviations and slow order speed. The L/V and vertical
forces are used for freight vehicles to assess the potential of wheel climb and wheel unloading derailments, respectively.
To evaluate the merit of developing NN models for a passenger car wheel-rail forces, PA5 car NUCARS model developed during Phase 2 was used at the allowable track speed to generate the car wheel forces. The developed NN models were as follows:
- Maximum L/V ratio – left and right lead axle wheels of lead truck
- Minimum vertical force – left and right lead axle wheels of lead truck
During on-track testing at PATH in 2013, the PA5 passenger car was instrumented only with accelerometers mounted on the carbody and axle boxes. Instrumented wheelsets that measure wheel-rail forces were not deployed. It should also be noted that during Phase 2 of the project, the PA5 NUCARS model was validated only for the accelerations using on-track test results collected during Phase 2.
Figure 18 and Figure Figure 19 show the model predictions (in orange) of the PA5 car maximum L/V ratio for the lead axle wheels of the lead truck, right and left side respectively. On the validation data, the model predicted the right and left L/V with 73 and 60 percent confidence, respectively. The models accurately predicted the same general trends on the validation data sets.
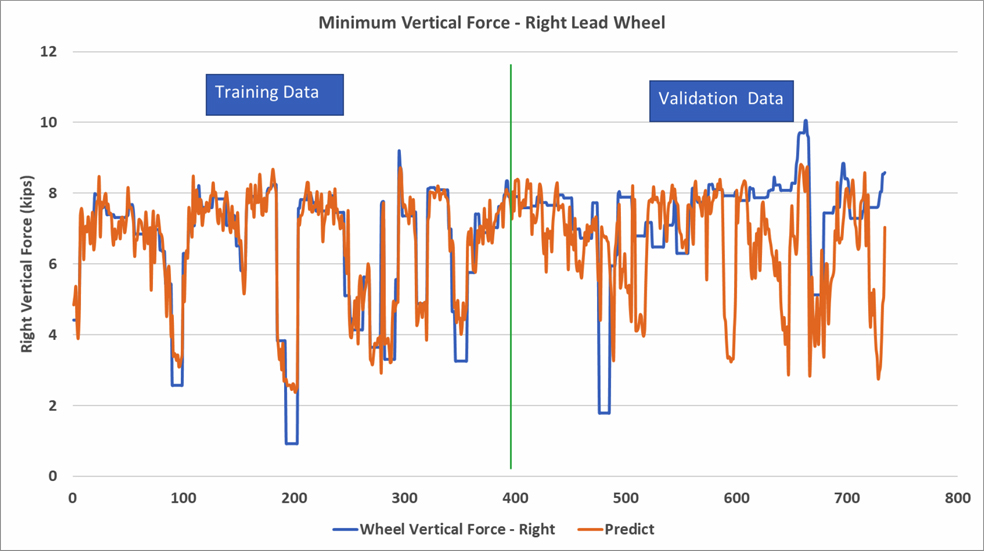
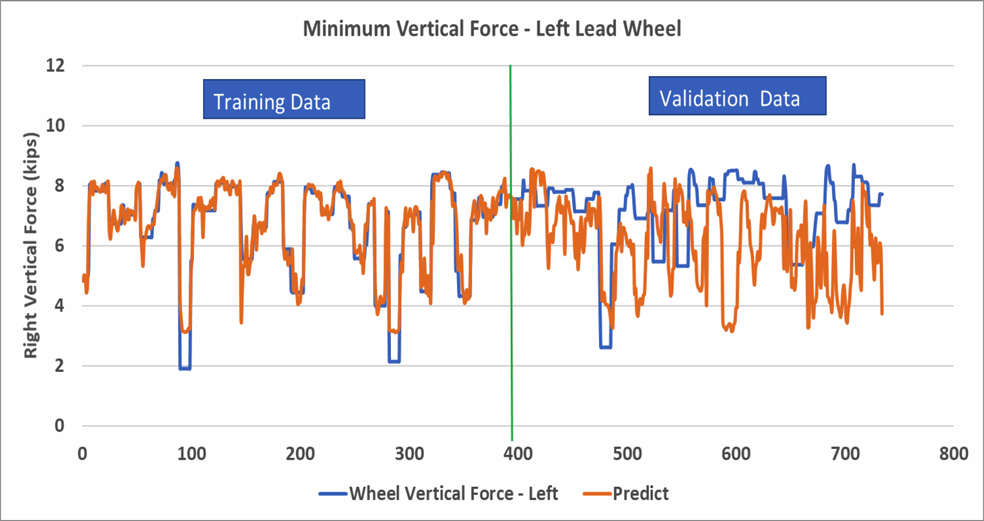
Figure 20 and Figure 21 show the model performance of the minimum vertical forces for the lead axle wheels of the lead truck. The model predictions were poor at 18 and 16 percent confidence for the right and left sides, respectively. The poor performance is likely due to the lack of sufficient track geometry degradation and operating conditions that would excite the car into an adverse vibration mode that leads to a wheel unloading condition. Such patterns may not be present in the NUCARS data used to develop the model. It is also possible that the PA5 NUCARS model needs fine tuning to better predict the wheel-rail forces. The PA5 NUCARS model was developed in Phase 2 and was validated using test results only for the carbody acceleration.


4.2 PBTG Technology and Ride Quality Assessment
Although ISO 2631-1997 is a well-recognized and widely used standard for RQ assessment, MxV Rail also researched RQ and safety standards that are commonplace in railroading and evaluated their applicability with the current PBTG technology for transit systems and RQ assessment. Each specification has different criteria that can be used to dictate comfort or safety limits. The following specifications were studied:
- ISO 2631-1997
- EN 14363:2016
- 49 CFR Section 213.333
4.2.1 ISO 2631-1997
The ISO 2631-1997 RQ specification provides comfort levels that can be calculated from frequency-weighted accelerations. Table 1 details the ranges for each comfort level.
| Less than 0.315 m/s2 | Not uncomfortable |
| 0.315 m/s2 to 0.63 m/s2 | A little uncomfortable |
| 0.5 m/s2 to 1 m/s2 | Fairly uncomfortable |
| 0.8 m/s2 to 1.6 m/s2 | Uncomfortable |
| 1.25 m/s2 to 2.5 m/s2 | Very uncomfortable |
| Greater than 2 m/s2 | Extremely uncomfortable |
These values are determined using frequency-weighted root-mean-square (rms) accelerations. The current PBTG system utilizes maximum and minimum values over track segments to provide performance limits over track segments and identify exceptions on a real-time basis or in an office environment using historic geometry data. Therefore, a post-processing simulation needs to be performed outside of the PBTG system to create limits utilizing the frequency-weighted r.m.s. accelerations. Additionally, the current PBTG system is incapable of incorporating ISO 2631-1997 criteria because using statistical values in simulation does not account for the data frequency information. Also, current PBTG is not designed to operate with overlapping ranges of acceleration limits to determine the comfort level and generate corresponding RQ-related remedial actions.
4.2.2 EN 14363:2016
The EN 14363:2016 specification is a European standard that provides typical maximum estimated values of ride characteristics for vehicles. Table 2 displays these values.
Table 2. Typical Maximum Estimated Accelerations for Vehicles (Annex L)
| Assessment, Vehicle, Test Conditions | Typical maximum estimated values for accelerations in vehicle body [m/s2] | |
|---|---|---|
| Ride characteristics | Max. Lateral Acceleration | Max. Vertical Acceleration |
| Locomotives, power cars (without shunting locomotives) | 2,5 | 2,5 |
| Shunting locomotives | To be defined | To be defined |
| Multiple units, passenger coaches | 1,5 | 2,0 |
| Freight wagons with bogies, empty | < 3 (preliminary) | < 5 (preliminary) |
| Freight wagons with bogies, loaded | 3,5 | 5,0 |
| Freight wagons without bogies, empty | To be defined | To be defined |
| Freight wagons without bogies, loaded | To be defined | To be defined |
The standard identifies general maximum limits but may not be applicable to vehicles in the United States of America. Also, depending on the characteristics of the vehicle, exceedances of these limits do not necessarily have a drastic effect on RQ. Statistical values cannot be effectively compared with frequency-based calculations. The PBTG system could implement the typical maximum accelerations from this standard, but they would not be necessarily tied to a safety or RQ limit.
4.2.3 49 CFR Section 213.333
Table 3 shows the FRA 49 CFR 213.333 criteria for car body accelerations only. The criteria provide a means for identifying and comparing vehicle dynamic performance issues in the presence of various track deviations and operating speeds. The criteria for peak-to-peak acceleration or rms values computed over a time window cannot be incorporated with a current PBTG designed to simulate extreme vehicle responses in terms of maximum and minimum wheel-rail forces over a defined track segment.
Table 3. 49 CFR 213.333 Criteria
| Car Body Accelerations2 | |||
|---|---|---|---|
| Parameter | Passenger Cars | Other Vehicles | Requirements |
| Car body Lateral (Transient) | ≤ 0.65 g peak-to-peak 1 sec window Excludes peaks < 50 msec |
≤ 0.75 g peak-to-peak 1 sec window Excludes peaks < 50 msec |
The peak-to-peak accelerations, measured as the algebraic difference between the two extreme values of measured acceleration in any 1-second time period, excluding any peak lasting less than 50 milliseconds, shall not exceed 0.65g and 0.75g for passenger cars and other vehicles, respectively. |
| Car body Lateral (Sustained Oscillatory) | ≤ 0.10g RMS14 4 sec window3 4 sec sustained |
≤ 0.12g RMS4 4 sec window3 4 sec sustained |
Sustained oscillatory lateral acceleration of the car body shall not exceed the prescribed (root mean squared) safety limits of 0.10g and 0.12g for passenger cars and other vehicles, respectively. Root mean squared values shall be determined over a sliding 4-second window with linear trend removed and shall be sustained for more than 4 seconds. |
| Car body Vertical (Transient) | ≤ 1.0 g peak-to-peak 1 sec window3 Excludes peaks < 50 msec |
≤ 1.25 g peak-to-peak 1 sec window3 Excludes peaks < 50 msec |
The peak-to-peak accelerations, measured as the algebraic difference between the two extreme values of measured acceleration in any 1-second time period, excluding any peak lasting less than 50 milliseconds, shall not exceed 1.0g or 1.25g as specified. |
| Car body Vertical (Sustained Oscillatory) | ≤ 0.25g RMS14 4 sec window3 4 sec sustained |
≤ 0.25g RMS4 4 sec window3 4 sec sustained |
Sustained oscillatory vertical acceleration of the car body shall not exceed the prescribed (root mean squared) safety limit of 0.25g. Root mean squared values shall be determined over a sliding 4-second window with linear trend removed and shall be sustained for more than 4 seconds. |
2 Car body accelerations in the vertical and lateral directions shall be measured by accelerometers oriented and located in accordance with § 213.333(k).
3 Acceleration measurements shall be processed through a LPF with a minimum cut-off frequency of 10 Hz. The sample rate for acceleration data shall be at least 100 samples per second.
4 RMS1 = RMS with linear trend removed.
4.2.4 PBTG Viability for Transit Systems
After evaluating RQ and safety standards commonly used in railroads, it was determined that, without further development, the current PBTG system could not be directly adapted to predict frequency-weighted r.m.s. accelerations based on prescribed criteria and generate maintenance reports, if warranted, recommending RQ-related remedial actions. The current PBTG system uses a segment-based approach and the variable statistics, such as maximums, minimums, standard deviations, averages, 5th and 95th percentiles from a 0.1-mile-long segment of track geometry. Significant additional research is needed to examine adaptation feasibility for transit systems and develop required changes to the core PBTG system technology, so that it would be able to accomplish these critical tasks.


