Performance-Based Track Geometry, Phase 3 (2023)
Chapter: Chapter 3 Track Geometry Comparison Analysis
CHAPTER 3
Track Geometry Comparison Analysis
3.1 Background
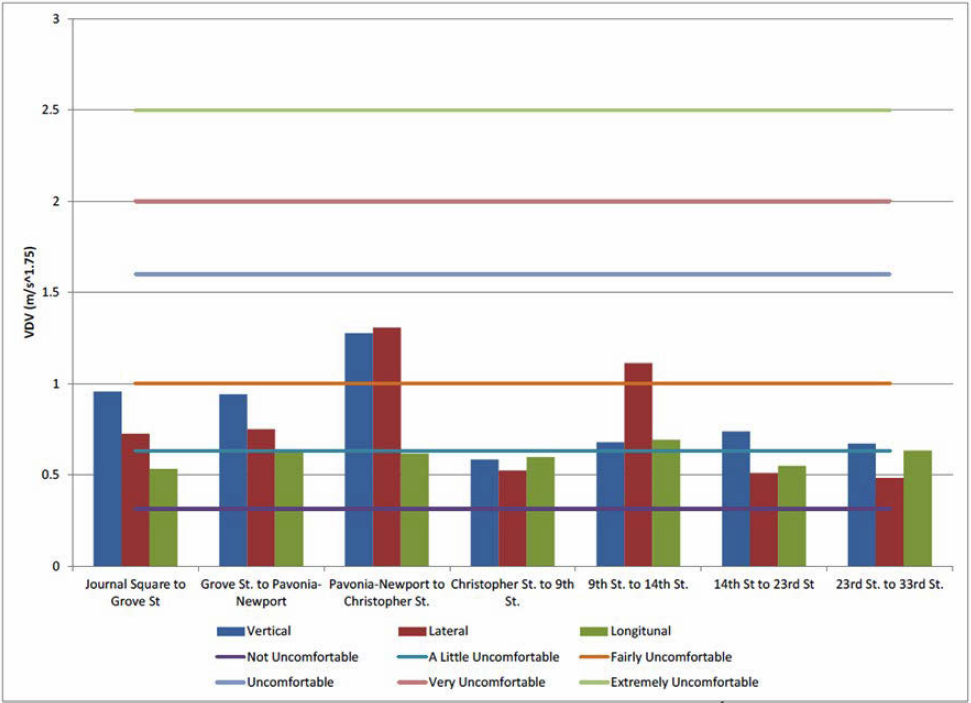
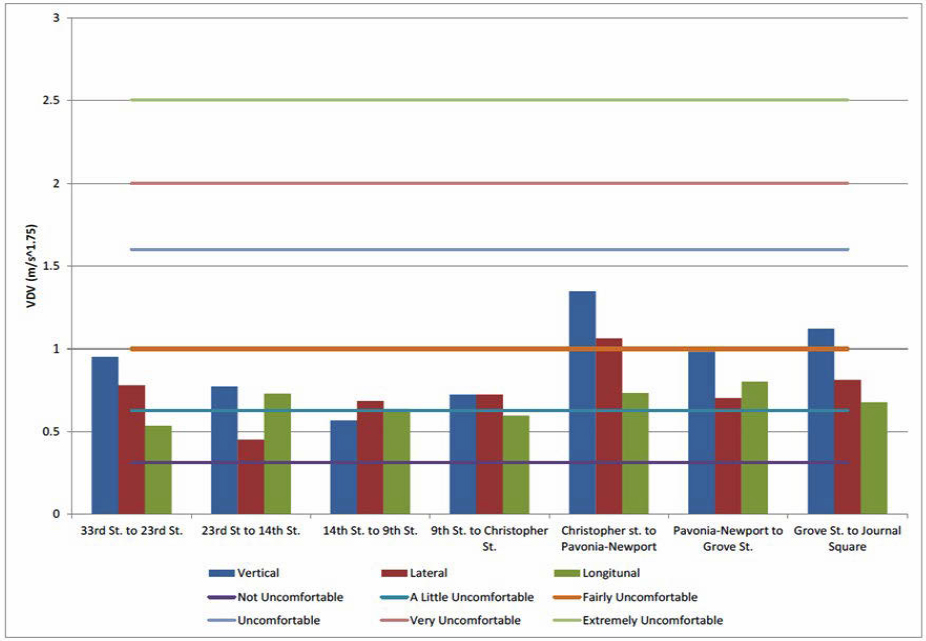
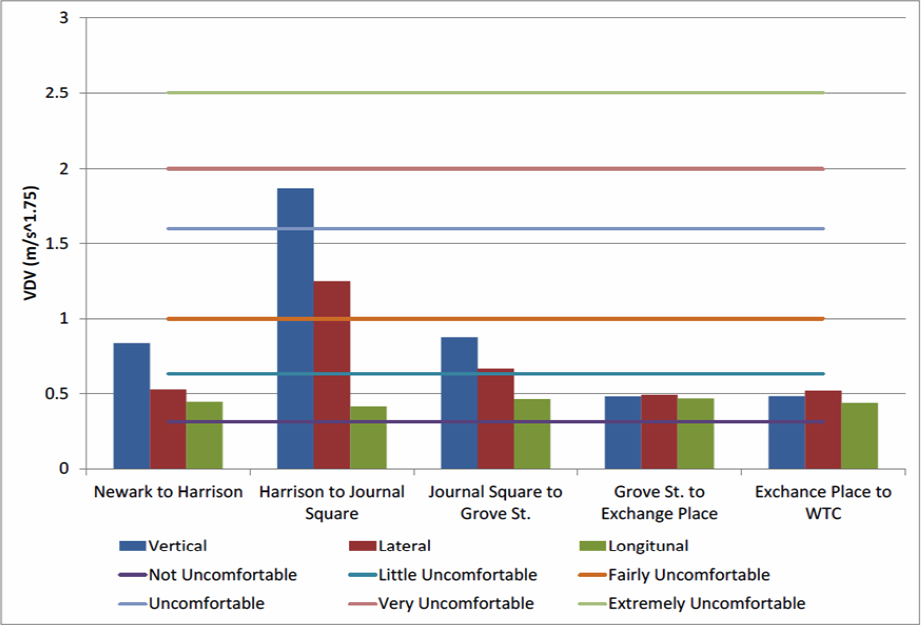
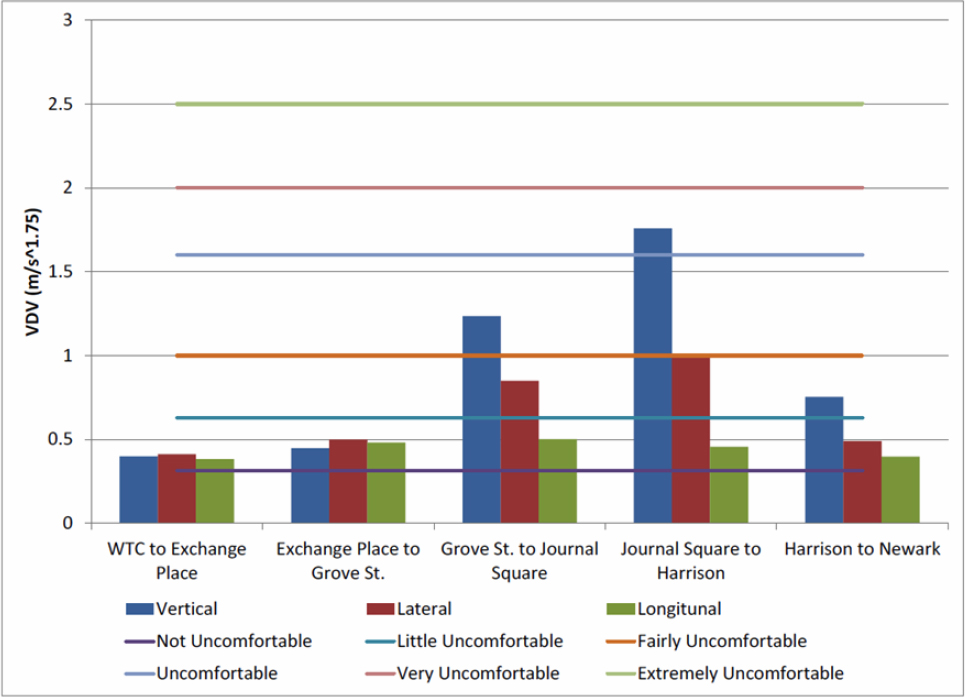
During Phase 2 of the project, two track segments that had elevated RQ results when compared to the rest of the track tested at the PATH network were identified. These segments included the track between Journal Square and 33rd Street Station (both directions) and the track between the World Trade Center and Newark stations (both directions). Figure 2 through Figure 5 display the RQ results from the 2013 on-track testing for these sections as evaluated by the fourth power dose (VDV) method.
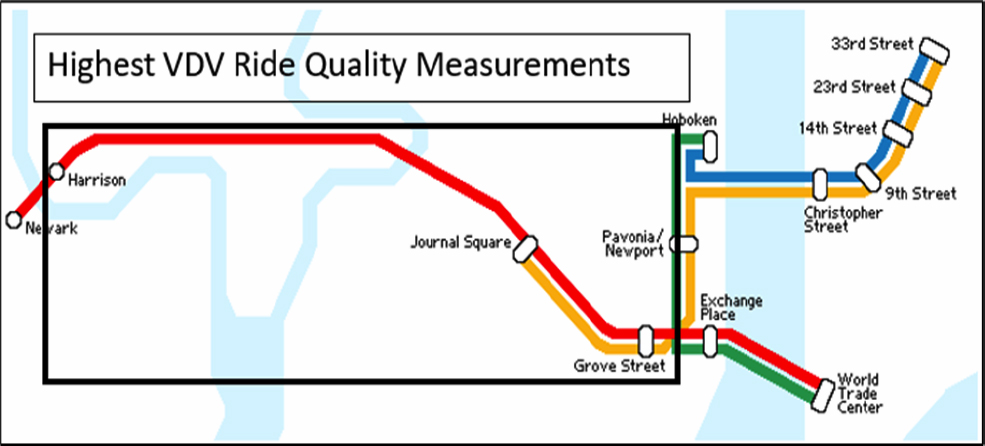
The stations that exhibited the highest RQ values were located on the Newark to World Trade Center line or the red line for the network. This line was the focal point of the track geometry comparisons, the NUCARS simulation runs, and the NN model development. Figure 6 displays the area of interest (delimited by black rectangle) compared to the other lines of the PATH network.
3.2 Track Geometry Comparison Between 2013 and 2018
Phase 2 of the project was completed in 2013. A data comparison analysis was conducted using 2018 track geometry data provided by PATH to compare the track geometry characteristics of the track over time (2013–2018). This comparison was made to ensure areas of track that exhibited notable RQ results in 2013 shared characteristics and track deviation patterns with the data from 2018.
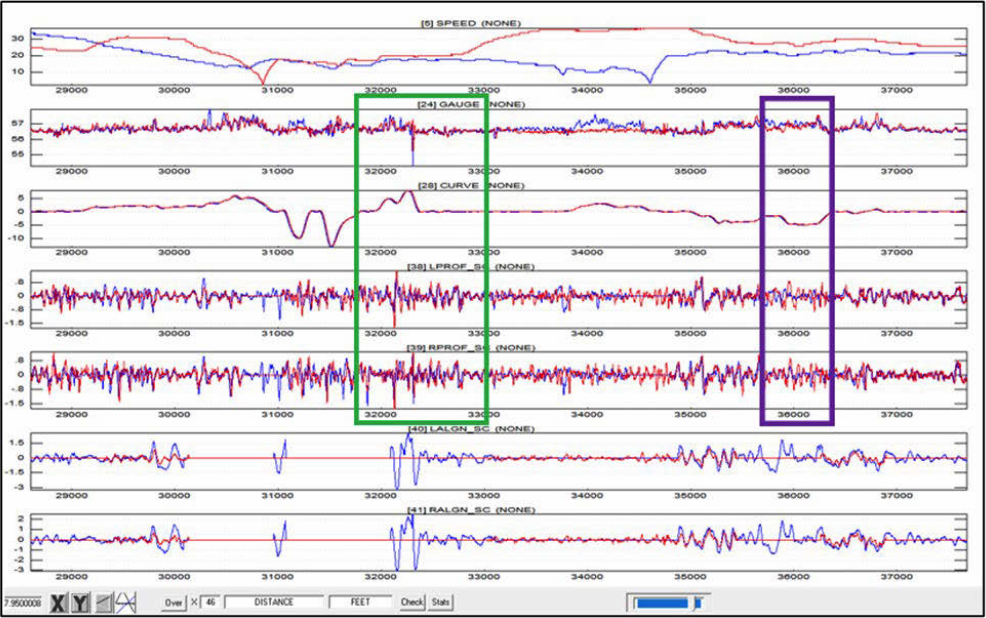
During the data review, MxV Rail identified several areas that demonstrated a good match and other areas that showed deviating track geometry measurements. Data dropouts were discovered in different channels of both sets of data, and it appeared that some of the dropouts may have been speed related, while others occurred without evidence of a cause. An example of data comparison between 2013 and 2018 track geometry runs is shown in Figure 7. The green box illustrates good track geometry matching (similar deviation trends and amplitudes). The purple box shows poor track geometry matching (different deviation trends and amplitudes).
MxV Rail concluded that several areas of interest (characterized by larger track geometry deviations) were different between the 2013 and the 2018 data. Differences observed could potentially generate different dynamic responses from the PA5 passenger car to the track deviations during each respective year and, therefore, could change the RQ output. The flatlines in the data represent the areas of data dropouts.
3.3 Track Geometry Comparison Between 2013 and 2020
During the analysis of the 2013 and 2018 track geometry data, PATH was in the process of commissioning a newly acquired track geometry measurement system. Once PATH completed the commissioning, MxV Rail requested and received recent track geometry data collected in late 2020 from the new track geometry system. MxV Rail then compared the 2020 data and the 2013 data in the critical areas. This comparison was done 1) to identify whether track geometry was similar
between the two data sets and 2) to investigate if any discrepancies occurred between the old track geometry system and the newly acquired track geometry system.
The distance-sampled track geometry data was overlaid, optimally synchronized, and brought to the same point in the track for a detailed one-to-one comparison. Figure 8 and Figure 9 display comparisons between the track geometry measurements of the 2013 and 2020 data sets for an example segment of track.


Statistics were also calculated and compared for both sets of data. The data had similar median and IQR values, but significant differences were found in the extreme values (maximums and minimums). Figure 10 shows an example of geometry parameter statistics comparison between 2013 (blue) and 2020 (red).

Figure 11 and Figure Figure 12 show examples of box graph illustrations of the rail profile variations in a critical area between 2013 and 2020.
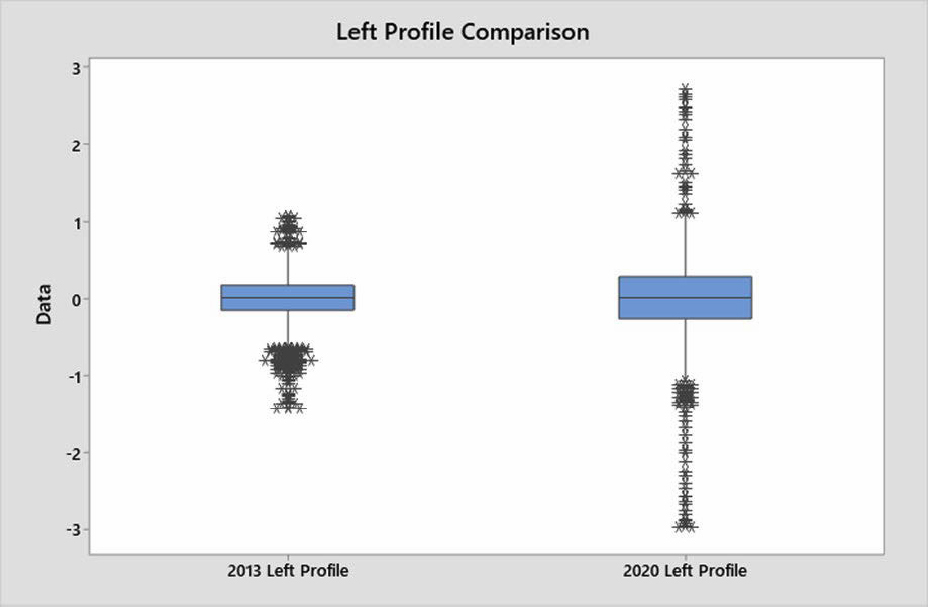

Adverse RQ is expected in locations where adverse track measurements occur. Therefore, the corresponding RQ results are expected to be different in magnitude. The study found that multiple areas with assumed adverse RQ had a poor match between track geometry data from 2013 and data from 2020.
In addition, areas where the data matches well provided confidence that there were no large discrepancies between the newly acquired track geometry vehicle measurement system and the one utilized to survey the track geometry in 2013. The same vendor that surveyed the track geometry in 2013 provided the new rail-bound track geometry vehicle acquired by PATH in 2020. Therefore, the multiple track geometry locations displayed significant changes over the seven-year period that were caused by repair or degradation of the track geometry. These changes resulted in unknown changes to RQ and vehicle performance.
The geometry comparison analysis findings pertaining to 2013 and 2020 were presented to TCRP and geometry changes over a seven-year period were discussed. The track geometry variations between 2013 and 2020 were deemed acceptable by TCRP, and MxV Rail engineers were greenlit to proceed with the use of the 2013 PA5 car RQ and geometry data to conduct the simulation work and evaluate the viability of the PBTG technology for transit systems.


