Tackling the Road Safety Crisis: Saving Lives Through Research and Action (2024)
Chapter: 3 Research to Practice in Road Safety
3
Research to Practice in Road Safety
INTRODUCTION
Moving from a novel or enduring road safety problem to the generation of solutions and their eventual implementation requires a process that transitions research into practice. This chapter explains the road safety research-to-practice process, in general and as it occurs in the United States today. It uses a logic model that outlines the supply chain connecting road safety problems to research activities and products developed to address those problems. The logic model’s three phases of this process are (1) selection, conduct, and dissemination of the research; (2) countermeasure choice and implementation; and (3) evaluation of outcomes and feedback for future research.
The chapter identifies the actors in road safety research, including the three major publicly supported research programs sponsored by the American Association of State Highway and Transportation Officials (AASHTO), the Federal Highway Administration (FHWA), and the National Highway Traffic Safety Administration (NHTSA). The chapter examines the research-to-practice process as conducted by each of these three independent sponsors, as well as their funding levels, priorities, and dissemination tools. The chapter then moves to the process used by road safety practitioners, acting at the state or local level, to implement safety interventions or crash countermeasures. The chapter illustrates some of the weaknesses of the current process through a sidebar on the 85th percentile rule for setting speed limits. Finally, the chapter addresses the relative lack of post-implementation evaluation.
The logic model and accompanying analysis of the current road safety research-to-practice process helped guide the committee’s search for gaps in and obstacles to using research to improve road safety outcomes in the United States. The identified obstacles are discussed in more detail in Chapter 4.
THE PROCESS OF TRANSITIONING SAFETY RESEARCH INTO PRACTICE
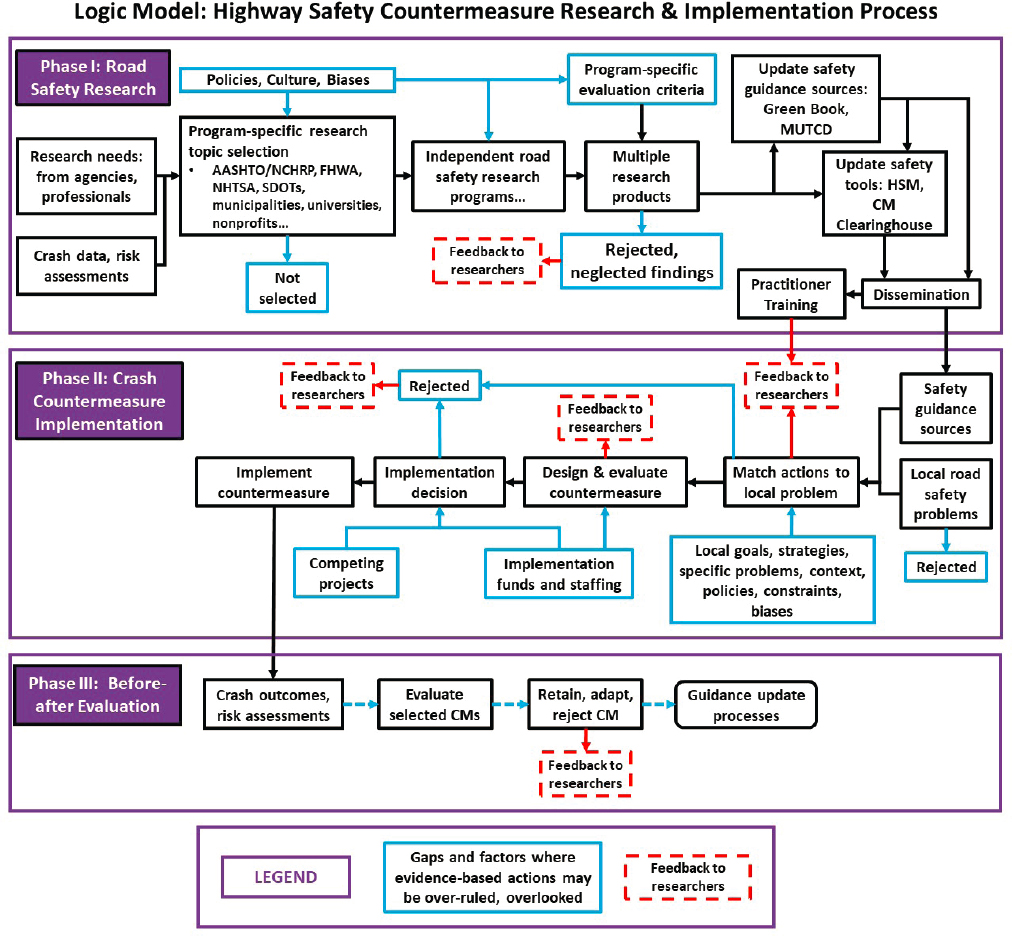
To understand and evaluate the process for transitioning evidence-based road safety research into practice, and to identify points in the process where the flow of information may be impeded or stopped, the committee mapped the key steps and components in the form of a logic model, shown in Figure 3-1. This model can be viewed as a supply chain connecting road safety problems and those who observe them (i.e., the customers) to research activities and products intended to address those problems. Ultimately, this process brings evidence-based solutions—crash countermeasures—back to the practitioners who implement them and to the traveling public, who are the ultimate beneficiaries. The logic model is broken down into three phases. Phase I, the top box, shows the research phase, which begins with information about safety problems that may warrant research and ends with research dissemination and practitioner training. Phase II, the middle box, describes the countermeasure implementation phase, which begins with the identification of local safety problems and includes the evaluation and selection of countermeasures. These two parts of the logic model provide a conceptualization of the complex, cycling, and multi-path connection between safety problems, research, and deployment of interventions. Phase III, the bottom box, describes the evaluation phase, which documents the outcomes of the implemented safety interventions and guides future actions and research. In short, Phase I produces new (or refined) countermeasures; Phase II uses them to solve real-world problems; and Phase III evaluates their actual impact on safety and provides feedback to future research efforts.
The committee prepared this model to understand and document the complexity of what is a largely unmanaged process, in which there are multiple points where actions to select research investments, to prepare guidance for safety practitioners, and to implement evidence-based crash countermeasures may not advance for a variety of reasons, and thus the flow of needed research results may not reach the road user community. The following sections discuss each of the phases in further detail.
PHASE I: ROAD SAFETY RESEARCH
Phase I of the research process begins with identifying potential research topics, typically called research needs. The several research sponsors gather research needs through multiple channels, including routine crash reporting and the perspectives of highway safety practitioners and policymakers that may come through professional committees, particularly the standing committees within the Transportation Research Board.1 Ideas for research needs may also come from universities, state Departments of Transportation
___________________
1For current examples of research needs identified by TRB Standing Committees, see https://www.mytrb.org/RNS/Search.
(DOTs), and government research labs.2 Research sponsors select which research needs, within their purview and according to their separate priorities, are to be advanced to research projects and allocated funding for the research to be conducted. A second winnowing occurs after the research is completed. Some research products advance toward practice, but other research findings will be rejected or neglected. Transitioning a research product into practice requires that guidance and decision-making tools be updated, decisions which are made by the owners of the guidance sources. Guidance updates do not occur at regular intervals. These updated guidance sources and tools then must be disseminated, and practitioners trained to apply them. Legacy guidance can remain in practice long after new research outcomes are disseminated.
The remainder of this section discusses the major organizations active in parallel road safety research and their processes.
Research Organizations and Funding
Although there are many different actors in U.S. road safety research, the three main entities responsible for sponsoring and programming research are the member states of AASHTO through the National Cooperative Highway Research Program (NCHRP), FHWA, and NHTSA. Their research programs operate in parallel: they each have their own independent processes for gathering research needs, selecting and conducting research projects, and disseminating the results.3 Research needs come largely from within these programs and their stakeholders—that is, the state DOTs, FHWA, and NHTSA. There are multiple participants in their processes, which are long-established and informal. Within each program, research projects are selected or rejected for funding based on the focus of the program, available funds, and their policies and perspectives on which problems are most immediate and which solutions are likely to be acceptable to their constituents and the public. These three and other principal research channels are described below, along with recent annual expenditures.
National Cooperative Highway Research Program
NCHRP is managed by TRB and funded by participating member states of AASHTO, FHWA, and directed by AASHTO using money that comes from a small percentage of their federal funds for state planning and research
___________________
2RSPC. “Road Safety Fundamentals.” Accessed May 2, 2024. https://rspcb.safety.fhwa.dot.gov/RSF.
3RSPCB. “Road Safety Fundamentals.”
(SPR).4 NCHRP is large and covers a broad range of topics: it had an overall research portfolio in fiscal year (FY) 2023 of about $40.5 million (which does not include costs of administration), of which safety projects were valued at $5.66 million (~14%).5
Research submissions to NCHRP start with problem statements. Anyone can write such a problem statement, including TRB standing technical committees, but only AASHTO state DOTs and FHWA can submit problem statements to NCHRP. AASHTO’s Special Committee on Research and Innovation (R&I), all voting members of which are from state DOTs, selects research projects annually. Criteria for selecting projects are not specified, nor is a strategic plan used for project selection. The programming committee has broad leeway to make choices. The research is performed through contracts managed by TRB, which publishes those results deemed suitable (i.e., of good quality and relevance).
Federal Highway Administration
FHWA conducts internal road safety research through the Turner-Fairbank Highway Research Center and the Office of Research and also contracts work to others, including U.S. DOT’s Volpe National Transportation Systems Center.6 Selection of projects is made by FHWA within the framework of the high-level, DOT-mandated Annual Modal Research Plans (AMRPs), which are informed by research roadmaps created by FHWA staff.7 Project formulation and selection occurs within FHWA, and neither the roadmap nor selection criteria are made public.
FHWA’s Research Development and Technology Program was funded at approximately $367 million in FY 2023; safety-specific research comprised $12.3 million, or 6%, as shown in Table 3-1.8 A substantial part of the safety design and operations research plan addresses automated
___________________
4NCHRP. “The National Cooperative Highway Research Program (NCHRP) Overview.” Accessed May 2, 2024. https://www.trb.org/NCHRP/NCHRPOverview.aspx.
5National Cooperative Highway Research Program. “Annual Report.” 2023. https://onlinepubs.trb.org/onlinepubs/nchrp/nchrpannual2023.pdf.
6NCHRP. “Program Overview.” Accessed May 2, 2024. https://highways.dot.gov/research/about/program-overview.
7For the 2023 AMRP, see https://www.transportation.gov/research-and-technology/federal-highway-administration-2023-annual-modal-research-plan.
8FHWA. “Budget.” Accessed April 11, 2024. https://highways.dot.gov/research/about/legislation-budget/budget.
TABLE 3-1 FHWA Safety Research Budget, FY 2022
| Program | Budget |
|---|---|
| Safety Program Delivery | $2,500,000 |
| Safety Design and Operations | $4,290,000 |
| Safety Data and Analysis | $3,920,000 |
| Human Factor Analytics | $1,570,000 |
| Total | $12,280,000 |
SOURCE: FHWA. “Budget.” Accessed April 11, 2024. https://highways.dot.gov/research/about/legislation-budget/budget.
and connected driving, yield failures at intersections, and rural roadway departures.9
National Highway Traffic Safety Administration
NHTSA supports research focused primarily on human behavior, traffic law enforcement, and vehicle design for safety.10,11 The agency’s FY 2023 research expenditures by program categories are shown in Table 3-2. Project selection occurs within the agency, also driven by the high-level AMRP.12
TABLE 3-2 NHTSA Research Development and Technology Expenditures 2023
| Budget Account | 2023 Actuals |
|---|---|
| Vehicle Safety Research | $34,111,000 |
| Highway Safety Research | $15,200,000 |
| Vehicle Safety Supplemental | $43,412,000 |
| Highway Safety Supplemental | $18,200,000 |
| Total | $110,923,000 |
SOURCE: U.S. DOT. “National Highway Traffic Safety Administration 2025 Budget Request with 2023 Actuals.” Accessed May 15, 2024. https://www.transportation.gov/sites/dot.gov/files/2024-03/NHTSA_FY_2025_Budget_Request-Congressional_Submission508.pdf.
___________________
9FHWA. “R&T Portfolio: Safety Design and Operations.” Accessed April 11, 2024. https://highways.dot.gov/research/rtportfolio/safety-design-operations.
10NHTSA. “Research” Accessed May 2, 2024. https://www.nhtsa.gov/research.
11This text was added after release of the prepublication version of the report to clarify that Table 3-2 also includes expenditures for vehicle design and safety.
12For the 2023 AMRP, see U.S. DOT. “National Highway Traffic Safety Administration 2023 Annual Modal Research Plan.” https://www.transportation.gov/research-and-technology/national-highway-traffic-safety-administration-2023-annual-modal-research.
Factors and criteria considered in project definition and selection are not made public.
Pooled Fund Safety Research
Groups of states routinely pool their resources, largely from SP&R funds, to conduct additional research of particular interest to them, some of which is focused on safety. These projects are managed by FHWA. Table 3-3 depicts active pooled fund studies on safety.13
Behavioral Transportation Safety Cooperative Research Program
The Behavioral Transportation Safety Cooperative Research Program (BTSCRP) is a partnership between NHTSA and the Governors Highway Safety Association (GHSA), administered by the TRB much like NCHRP. BTSCRP sponsors research projects focused on behaviors that lead to traffic crashes. GHSA selects the projects through a process facilitated by the
TABLE 3-3 FHWA Pooled Fund Study Projects April 2024
| Pooled Fund Description | Amount |
|---|---|
| Roadside Safety Pooled Fund | $5,200,000 |
| Roadside Safety Systems for Motorcyclists | $780,000 |
| In Service Evaluation of Roadway Safety Features | $720,000 |
| Traffic Safety Culture | $1,400,000 |
| Midwest Roadside Safety Pooled Fund Study | $5,200,000 |
| Box Beam Approach and Transition to Guardrail | $250,000 |
| Drivers Failing to Yield at Multi-Lane Roundabouts | $310,000 |
| Roadside Safety Research for MASH Implementation | $7,200,000 |
| Evaluation of Low-Cost Safety Improvements | $1,000,000 |
| Highway Safety Manual Implementation | $1,600,000 |
| Motorcycle Crash Causation Study | $700,000 |
| Midwest States Pooled Fund Crash Test Program | $600,000 |
| Total | $24,960,000 |
SOURCE: TPF. Accessed April 12, 2024. https://www.pooledfund.org.
___________________
13Transportation Pooled Fund (TPF). Accessed April 12, 2024. https://www.pooledfund.org.
GHSA Research Committee, state representatives appointed by the chair of the GHSA executive board. The program is funded by NHTSA at $3.5 million per year.14 Similar to NCHRP, criteria for selecting projects are not specified, nor is a strategic plan followed.
State and Regional Agencies and Local Governments
State agencies such as state DOTs, highway safety offices, and divisions of motor vehicles, and sometimes regions or municipalities, undertake their own research to meet localized needs. Research may occur within the state DOTs, at university research centers, or by outside contractors. Investment levels vary across the states.15
Non-Profit Organizations
There are several nonprofit entities with road safety as all or part of their mission. Examples include the AAA Foundation for Traffic Safety16 and the Insurance Institute for Highway Safety (IIHS),17 which both invest in research. These entities have their own specialized program areas, and they select research investments internally. IIHS invested $7.2 million in safety research in 2022, about 85% of which went to its Vehicle Research Center, a testing facility.18 The AAA Foundation funded approximately $3.6 million of research projects in 2022.19
Universities
Some university research centers, particularly those with federal funding, have road safety as a part of their mission and conduct research into these practices. Project selection is typically done within the institutions, often with stakeholder advice. Some universities receive federal funding through
___________________
14GHSA. “Research Program.” Accessed May 2, 2024. https://www.ghsa.org/resources/BTSCRP.
15RSPCB. “Road Safety Fundamentals.” Accessed May 2, 2024. https://rspcb.safety.fhwa.dot.gov/RSF.
16AAA Foundation for Traffic Safety. “Research.” September 29, 2017. https://aaafoundation.org/research.
17IIHS-HLDI crash testing and highway safety. “Who We Are.” Accessed May 2, 2024. https://www.iihs.org/about.
18ProPublica. “Insurance Institute for Highway Safety, Full Filing – Nonprofit Explorer.” May 9, 2013. https://projects.propublica.org/nonprofits/organizations/530246204/202323189349302282/full.
19ProPublica. “Insurance Institute for Highway Safety, Full Filing – Nonprofit Explorer.”
the University Transportation Center (UTC) program managed by U.S. DOT’s Office of the Assistant Secretary for Research and Technology to promote safety. Those universities receiving federal funding for safety research through the UTC program should be included as part of a nationally coordinated research program. For example, the Highway Safety Research Center at the University of North Carolina at Chapel Hill conducts research on highway safety and manages programs for FHWA, including the Crash Modification Clearing House and the Highway Safety Information System.20
Public Health
The Centers for Disease Control and Prevention’s National Center for Injury Prevention and Control funds numerous injury control research centers focusing on putting research into action to prevent injuries and violence. Many of these centers conduct traffic-related injury prevention and control research. The National Institutes of Health also funds various road safety-related research related human health through different Institutes (e.g., the National Institute on Alcohol Abuse and Alcoholism, the National Institute of Child Health and Human Development, and others). While the field of public health addresses road injuries and fatalities, the focus is primarily on epidemiological and population studies. Such studies analyze injury distributions (who, when, and where), patterns, incidence, and risk factors or determinants in a defined population.21,22,23 The public health approach sometimes develops evidence-based intervention strategies to improve road safety by preventing and reducing road injuries and fatalities among specific
___________________
20University of North Carolina at Chapel Hill Highway Safety Research Center. https://www.hsrc.unc.edu/about.
21Wilson, F.A., and J.P. Stimpson. 2010. “Trends in Fatalities from Distracted Driving in the United States, 1999 to 2008.” American Journal of Public Health 100(11):2213–2219. https://doi.org/10.2105/AJPH.2009.187179.
22Chong, S.L., L.W. Chiang, J.C. Allen, Jr., E.W. Fleegler, and L.K. Lee. 2018. “Epidemiology of Pedestrian-Motor Vehicle Fatalities and Injuries, 2006–2015.” American Journal of Preventive Medicine 55(1):98–105. https://doi.org/10.1016/j.amepre.2018.04.005.
23Thompson, J.P., M.R. Baldock, J.L. Mathias, and L.N. Wundersitz. 2013. “An Examination of the Environmental, Driver and Vehicle Factors Associated with the Serious and Fatal Crashes of Older Rural Drivers.” Accident Analysis & Prevention 50:768–775. https://doi.org/10.1016/j.aap.2012.06.028.
population(s).24,25,26,27,28 Public health safety research is not represented in the logic model of Figure 3-1 because it has not been widely applied and integrated into road safety research. While public health research does consider the safety of road users and post-crash care, it does not usually address infrastructure design or operations management, and therefore does not provide guidance to road safety practitioners or routinely lead to crash or crash outcome countermeasures.29,30 This limited role of public health research represents a cultural gap in road safety processes.
Medicine and public health do play a crucial role in informing both practitioners and policy makers about the risks and consequences of crashes. They are instrumental in identifying behavioral and health-related risk factors and guiding the allocation of safety resources. Incorporating public health expertise more directly into the road safety research process could introduce a broader range of ideas and perspectives. This could inform research agendas and help set priorities for resource allocation toward safety interventions. Ultimately, this inclusion will aid in achieving the cultural change advocated for in the SSA.
Research Project Selection to Product Dissemination
As the logic model (see Figure 3-1) shows, not all research ideas are implemented, and not all findings are accepted for dissemination in guidance or in the form of tools. Project selection criteria, as revealed by which projects are funded, are influenced by the mission, policies, and cultures
___________________
24Akbari, M., K.B. Lankarani, R. Tabrizi, S.T. Heydari, M. Vali, S.A. Motevalian, and M.J.M. Sullman. 2021. “The Effectiveness of Mass Media Campaigns in Increasing the Use of Seat Belts: A Systematic Review.” Traffic Injury Prevention 22(7):495–500. https://doi.org/10.1080/15389588.2021.1921168.
25Ehiri, J.E., H.O. Ejere, L. Magnussen, D. Emusu, W. King, and J.S. Osberg. 2006. “Interventions for Promoting Booster Seat Use in Four- to Eight-Year-Olds Traveling in Motor Vehicles.” Cochrane Database of Systematic Reviews 2006(1):CD004334. https://doi.org/10.1002/14651858.CD004334.pub2.
26Sartin, E.B., L.R. Lombardi, and J.H. Mirman. 2021. “Systematic Review of Child Passenger Safety Laws and Their Associations with Child Restraint System Use, Injuries and Deaths.” Injury Prevention 27(6):577–581. https://doi.org/10.1136/injuryprev-2021-044196.
27Fu, J., C.L. Anderson, J.D. Dziura, M.J. Crowley, and F.E. Vaca. 2013. “The Impact of State Level Graduated Driver Licensing Programs on Rates of Passenger Restraint Uses and Unlicensed Driving in Fatal Crashes.” Annals of Advances in Automotive Medicine 57:89–98.
28Masten, S.V., R.D. Foss, and S.W. Marshall. 2011. “Graduated Driver Licensing and Fatal Crashes Involving 16- to 19-Year-Old Drivers.” JAMA 306(10):1098–1103. https://doi.org/10.1001/jama.2011.1277.
29Gopalakrishnan, S. 2012. “A Public Health Perspective of Road Traffic Accidents.” Journal of Family Medicine and Primary Care 1(2):144–150. https://doi.org/10.4103/2249-4863.104987.
30Gostin, L. 2018. “Traffic Injuries and Deaths: A Public Health Problem We Can Solve.” JAMA Forum Archive. https://doi.org/10.1001/jamahealthforum.2018.0009.
of the program funders. The overall road safety research enterprise lacks systematic processes for incorporating feedback to researchers on passed-over ideas and findings, feedback that might guide future research directions, methods, or delivery formats. The sponsoring agencies may seek out information about the usefulness of research and the outcomes of research deployment, but there is no explicit follow-up in the form of a cyclical research translation process as described in Chapter 5.
Importantly, the U.S. road safety research enterprise lacks formal processes for coordination among the various research sponsors. While leaders of the road safety research community communicate and work together through professional organizations, most notably TRB and its standing committees on safety, there is no strategic plan that coordinates these several research efforts to focus on national road safety priorities.
For example, because NCHRP does not have a strategic plan for safety research, there is no explicit procedure to ensure that all—or the most critical, or the most cost-effective—research projects are supported. Although AASHTO itself has a Strategic Highway Safety Plan, it is not connected to the NCHRP safety project selection process, and the R&I Committee chooses projects from those submitted by state DOTs based on annual priorities. None of these programs selects research to achieve specific, quantitative safety performance outcomes (e.g., zero deaths, or specific percent reductions in fatalities). In addition, it appears that the federal adoption of the SSA is only now becoming reflected in research investments across the major programs.31
Research results are typically first available in agency reports and technical journals, which practitioners must seek out on their own. Some research results are eventually translated or integrated into official guidance (recommendations or requirements) for use by road safety practitioners. The principal guidance sources are A Policy on Geometric Design of Highways and Streets (the AASHTO “Green Book”32) and the Manual on Uniform Traffic Control Devices (MUTCD, FHWA publication33). Some products are tools to support application of guidance, which can be websites or computer software (e.g., Highway Safety Manual [HSM],
___________________
31There is now a stream of research coming through NCHRP that is developing SSA implementation guidance. For example: National Academies of Sciences, Engineering, and Medicine. 2023. Right-Turn-on-Red Site Considerations and Capacity Analysis: Practitioner’s Guide. Washington, DC: The National Academies Press. https://doi.org/10.17226/27131; National Academies of Sciences, Engineering, and Medicine. 2024. Background and Development of a Guide for Intersection Control Evaluation. Washington, DC: The National Academies Press. https://doi.org/10.17226/27508.
32AASHTO. 2018. A Policy on Geometric Design of Highways and Streets. 7th ed.
33FHWA. 2023. Manual on Uniform Traffic Control Devices for Streets and Highways. 11th ed.
AASHTO publication34), the Crash Modification Factors Clearinghouse (CMF Clearinghouse, FHWA online35) and lists of proven countermeasures issued by FHWA36 and countermeasures that work, issued by NHTSA37). The guidance sometimes gets to practitioners directly, through training provided by FHWA; the Institute of Transportation Engineers (ITE), which offers Road Safety Professional certification; the National Highway Institute (NHI), targeted training for new countermeasures and tools; university classes and other in-service training courses; and simplified, locally adapted versions of guidance produced by state DOTs.38
The time lag between delivery of research products and updating guidance is measured in years, sometime decades. This means guidance and tools may not only be outdated, but more recent research results may have proven them to be incorrect. Some research results may never be integrated into updated guidance. On the other hand, some actions become legacy components of accepted practice even with little or no research support. The use of the 85th percentile speed as a basis for setting speed limits is an example of such a legacy practice, as described in the sidebar below.
PHASE II: COUNTERMEASURE IMPLEMENTATION
The second phase of the process shown in the logic model of Figure 3-1 describes moving research-based countermeasures into practice. State and local road safety problems are selected for treatment in a screening process (described in Chapter 4) based on a mix of quantitative factors (e.g., statistical analysis of crash experience, risk predictions, equity analysis), qualitative criteria (e.g., safety goals and priorities, risk perception, local preferences, and political pressure), and state and local safety plans.39 Not all road safety problems are addressed because of resource limitations and local priorities.
___________________
34AASHTO. 2010. Highway Safety Manual. 1st ed. with 2014 Supplement.
35University of North Carolina Highway Safety Research Center: Federal Highway Administration. “CMF Clearinghouse.” https://www.cmfclearinghouse.org.
36FHWA. “Proven Safety Countermeasures.” Accessed April 9, 2024. https://highways.dot.gov/safety/proven-safety-countermeasures.
37Kirley, B.B., K.L. Robison, A.H. Goodwin, K.J. Harmon, N.P. O’Brien, A. West, S.S. Harrell, L. Thomas, and K. Brookshire. 2023. Countermeasures That Work: A Highway Safety Countermeasure Guide for State Highway Safety Offices, 11th ed. DOT HS 813 490. National Highway Traffic Safety Administration.
38For example, California has their own guidance for installing rumble strips: https://dot.ca.gov/-/media/dot-media/programs/safety-programs/documents/policy/20-07-rumble-strips-guidelines-and-memo-011421-a11y.pdf.
39RSPCB. “Road Safety Fundamentals.” Accessed May 2, 2024. https://rspcb.safety.fhwa.dot.gov/RSF.
SIDEBAR
The 85th Percentile Speed Limit: Legacy Guidance Lives on But Where Is the Evidence?
The National Highway Traffic Safety Administration (NHTSA) has attributed 29% of all U.S. roadway fatalities in 2021 to excessive speed.a Although the relationship between speed and crash frequency has been difficult to establish,b the effect of speed during the crash itself is clear, because the kinetic forces are linked to injury severity.c,d,e Therefore, setting speed limits and managing motor vehicle speeds are critical activities for improving safety outcomes. However, transportation engineers in the United States are still highly dependent on the 85th percentile speed limit “rule”—a method dependent on driver behavior, not analyses of safety—to set speed limits. Transitioning to an approach more consistent with the Safe System Approach (SSA) to road safety has been slow.
For many decades the standard criterion for setting a speed limit in the United States has been the 85th percentile speed: set the limit at (about) the point below which 85% of the drivers are driving. The 85th percentile is recommended as a basis for setting speed limits because it reveals which speed feels safe and is acceptable to most road users, and thus, it is relatively enforceable, indeed, to some degree self-enforcing.f This criterion dates back at least to the late 1930s and was originally intended to be applied to rural roads and highways; it was to be only a starting place for setting speed limits in more urban settings.g Instead, it developed into a widely accepted rule of thumb.h,i
__________________
a NHTSA. “Almost One-Third of Traffic Fatalities Are Speed-Related Crashes.” July 10, 2023. https://www.nhtsa.gov/press-releases/speed-campaign-speeding-fatalities-14-year-high.
b National Research Council. 1998. Managing Speed: Review of Current Practice for Setting and Enforcing Speed Limits: Special Report 254. Washington, DC: National Academy Press.
c Hauer, E. 2009. “Speed and Safety.” Transportation Research Record 10–17.
d Elvik, R. 2009. “The Power Model of the Relationship Between Speed and Road Safety: Update and New Analyses.” Oslo: Institute of Transport Economics.
e NTSB. 2017. “Reducing Speeding-Related Crashes Involving Passenger Cars.” NTSB/SS-17/01, PB2017-102341.
f Forbes, G.J., T. Gardner, H. McGee, and R. Srinivasan. 2012. “Methods and Practices for Setting Speed Limits: An Informational Report.” Federal Highway Administration FHWA-SA-12-004.
g Taylor, B.D., and Y.H. Hwang. 2020. “Eighty-Five Percent Solution: Historical Look at Crowdsourcing Speed Limits and the Question of Safety.” Transportation Research Record. https://doi.org/10.1177/0361198120928995.
h Johnson, J.E. 1956, April. “Slow Traffic Laws Waste Fast Roads,” Nation’s Business Magazine.
i Petty, D. 1961. “An Analysis of Traffic Accidents on County Roads: Informational Report,” Purdue University Joint Highway Research Project, File No. 8-5.
The 85th percentile rule is still in widespread use among traffic engineers.j The most recent edition of the Manual on Uniform Traffic Control Devices still recommends setting the speed limit within 5 mph of the 85th percentile speed on urban, suburban, and rural arterials, but now also considers contextual factors, such as land use, pedestrian activity, and frequency of crashes in addition to considering roadway design, environmental crash experience, and past speed studies.k The Institute of Transportation Engineers also recognizes it as one method for setting speed limits.l Some states have even codified the use of the 85th percentile speed method into law, restricting the ability of municipalities to adjust limits based other safety criteria.m
Even in more advanced speed limit decisions methods, the 85th percentile rule is still present. USLIMITS2, an expert system tool developed through the National Cooperative Highway Research Program, is based on the following:
An expert panel, comprised of experienced traffic engineers and other subject matter experts, provided input to the development of the decision rules and logic flow employed within the tool. USLIMITS2 considers all major factors used by practitioners to make engineering judgments to determine an appropriate speed limit. This includes operating speed (50th and 85th percentile), annual average daily traffic, roadway characteristics and geometric conditions, level of development in the area around the road, crash and injury rates, presence of on-street parking, and extent of ped/bike activity, as well as several others depending on the road type.n
This expert system takes speed limits as set by expert professionals and organizes them in terms of the hypothesized causal factors, as listed above, and delivers them in a look-up table that allows a user to match their local conditions to what an aggregate, hypothetical expert would do in a similar situation. The relationship to the road safety outcome is at best implicit, based on the presumption that the hypothetical expert is well-motivated and informed to produce a safe outcome and understands the relationship between speed and crashes. The legacy 85th percentile measure is built into USLIMITS2.
The United States’ continued dependence on the “crowd-sourced” 85th percentile rule is in stark contrast with how speed limits are set under the SSA. Sweden and the
__________________
j Kim, W., T. Kelley-Baker, and K.T. Chen. 2019. “Review of Current Practices for Setting Posted Speed Limits.” Washington, DC: AAA Foundation for Traffic Safety.
k Manual on Uniform Traffic Control Devices for Streets and Highways, 11th ed. Federal Highway Administration. December 2023.
l Institute of Transportation Engineers. “Setting Speed Limits.” Accessed February 6, 2024. https://www.ite.org/technical-resources/topics/speed-management-for-safety/setting-speed-limits.
m Toda, R. 2018. “Fast, Furious & Fatal: An Assessment of Speed-Setting Methodology in California.” Institute of Transportation Studies. University of California, Los Angeles.
n FHWA. “USLIMITS2.” Last updated May 30, 2023. https://safety.fhwa.dot.gov/uslimits. See also NCHRP. 2006. “Expert System for Recommending Speed Limits in Speed Zones.” https://safety.fhwa.dot.gov/uslimits/documents/finalreport.pdf.
Netherlands both adopted Vision Zero, the objective of driving traffic fatalities down to zero, in 1997 and shifted to setting speed limits using the “Safe System/Harm Minimization” approach. This approach sets limits with the objective of minimizing injuries for the kinds of crashes that are most likely to occur in specific roadway types and contexts.o,p Table 3-4 below provides an example of these limits as described by Tingvall and Haworth. q Although some of the resulting speed limits in Table 3-4 are so low that they may generate public resistance, the improvements in road safety have been substantial.r,s
Instead of following safety-based speed limit guidance, American road traffic engineers are charged with making adjustments to the 85th percentile speed. Guidance provided for making these adjustments is limited and not strongly tied to evidenced-based research. Much reliance is placed on engineering judgment, a lightly defined concept built on knowledge and experience, which may not be common among practitioners (see discussion in Chapter 4).t Application of different, evidence-based approaches lacks the same specificity of guidance behind the 85th percentile method, and thus is more challenging for practitioners. They must work against precedent and legacy policies. In some places the 85th percentile rule is frozen into official guidance and is seen as a protection against litigation.
Thus, at present there is no practical replacement for the 85th percentile rule that is compatible with Vision Zero and the SSA and that accounts for all road users.
TABLE 3-4 Setting Speed Limits Under the SSA
| Type of Infrastructure and Traffic | Possible Travel Speed |
|---|---|
| Locations with possible conflicts between pedestrians and cars | 30 km/h (~20 mph) |
| Intersections with possible side impacts between cars | 50 km/h (~30 mph) |
| Roads with possible frontal impact between cars | 70 km/h (~45 mph) |
| Roads with no possibility of side or frontal impacts – only impacts with infrastructure | 100+ km/h (~60+ mph) |
SOURCE: Tingvall, C., and N. Haworth. 1999. “Vision Zero—An Ethical Approach to Safety and Mobility.” Monash University Accident Research Center. Presented at the 6th ITE international Conference on Road Safety & Traffic Enforcement: Beyond 2000, Melbourne, September 6–7.
__________________
o Minnesota Department of Transportation. 2012, August. “Methods for Setting Posted Speed Limits.” Transportation Research Synthesis. TRS 1204.
p Anderson, R.W.G., A.J. McLean, M.J. Farmer, B.H. Lee, and C.G. Brooks. 1997. “Vehicle Travel Speeds and the Incidence of Fatal Pedestrian Crashes.” Accident Analysis and Prevention 29(5):667–674.
q Tingvall, C., and N. Haworth. “Vision Zero – An Ethical Approach to Safety and Mobility.”
r “Methods for Setting Posted Speed Limits.”
s Vadeby, A., and A. Forsman. 2018. “Traffic Safety Effects of New Speed Limits in Sweden.” Accident Analysis and Prevention 114:34–39.
t Hauer, E. 2019. “Engineering Judgment and Road Safety.” Accident Analysis and Prevention 129:180–189.
Road safety practitioners match problems and their contexts with possible interventions that come from the various guidance sources, including the proven countermeasures identified by FHWA and NHTSA. Their choice of countermeasures is supported by tools, the CMF Clearinghouse and the HSM, and guided by local policies, preferences, and practitioner experience (see the discussion of nominal and substantive safety in Chapter 4). However, the decision to deploy a countermeasure is usually tentative and subject to revision in the design process, where obstacles can be revealed as design and deployment details are developed, particularly for infrastructure countermeasures. The cost-effectiveness of a countermeasure and the availability of funds will also be factors in countermeasure choice.
Selected countermeasures then advance to a design–evaluation–decision cycle that involves designing the countermeasure to fit the site (for infrastructure actions) or the context (for behavioral interventions).40 This cycle varies in complexity and duration (see Chapter 4 for more detail) depending on the scale and scope of the intervention and other factors associated with the physical and functional characteristics of the site.
In most cases, different agencies at the state or local levels are responsible for making decisions to implement engineering versus behavioral interventions. This bifurcation is complicated by the fact that funds for implementing countermeasures come from multiple sources, each with its own restrictions on its use. Deploying behavioral countermeasures in conjunction with safety-driven infrastructure changes requires interagency collaboration—for example, between transportation and law enforcement agencies, backed up by community political leadership. Coordinating such cooperative efforts can be challenging and may discourage the use of integrated interventions.41
The logic model shows these implementation processes as cyclical: initial actions may turn out to be infeasible or unacceptable, leading to design modifications or the selection of different countermeasures, or no action at all. A variety of factors can delay or stop the countermeasure deployment process, including community opposition to interventions, competing projects, and funding limitations.42 Delays in the process of preparing a deployment can result in project deferral and the risk of funds being diverted to other, nonsafety investments.
___________________
40RSPCB. “Road Safety Fundamentals.”
41RSPCB. “Road Safety Fundamentals.”
42RSPCB. “Road Safety Fundamentals.”
Highway Safety Deployment Funding
Phase II depends on funding to deploy safety interventions and crash countermeasures. Because all federal aid programs can be used for road safety,43 funding for deploying infrastructure-based crash countermeasures can come from many places. The 5-year Bipartisan Infrastructure Law (BIL) of 2021 provided these funds for road safety:
- Highway Safety Improvement Program (HSIP): $15.6 billion
- Railway-Highway Crossings Program: $1.2 billion
- Safe Streets and Roads for All (SS4A): $5 billion (money for Metropolitan Planning Organizations, cities, counties, tribal governments)
- Wildlife Crossings Pilot: $350 million
- Highway Safety Traffic Grants: $836 million44
FHWA’s HSIP is and has been the primary dedicated source of general-purpose road safety investment funds. This program requires a 10% state match, and in FY 2023 it was funded at $3.3 billion.45 However, FHWA encourages state and local jurisdictions to use other federal funds to address roadway safety.46 HSIP is primarily an infrastructure-focused program, but up to 10% of allocated funds can be diverted toward behavioral intervention efforts, such as safety awareness campaigns.47
Still, FHWA estimated that in FY 2021, less than 2% of expenditures on state-administered highways were dedicated to highway safety and driver education (~$2.56 billion).48 Furthermore, HSIP funds can be “flexed” up to 50% to nonsafety investments, which is not an uncommon action, as shown in Figure 3-2, which shows the proportion of HSIP funds
___________________
43This text was added after release of the prepublication version of the report to clarify that all federal aid programs can be used for road safety.
44This bullet point was added after release of the prepublication version of the report because these grants are part of the Bipartisan Infrastructure Law.
45FHWA Associate Administrator, Office of Safety. “Highway Safety Improvement Program (HSIP) Eligibility Guidance.” February 2, 2022. https://safety.fhwa.dot.gov/hsip/rulemaking/docs/BIL_HSIP_Eligibility_Guidance.pdf.
46FHWA. Highway Safety Improvement Program (HSIP) Eligibility Guidance (Effective date: October 1, 2021). Memorandum. https://safety.fhwa.dot.gov/hsip/rulemaking/docs/BIL_HSIP_Eligibility_Guidance.pdf.
47FHWA. Highway Safety Improvement Program (HSIP) Eligibility Guidance (Effective date: October 1, 2021).
48“Table SF-4C – Highway Statistics 2022 - Policy | Federal Highway Administration.” Accessed May 2, 2024. https://www.fhwa.dot.gov/policyinformation/statistics/2022/sf4c.cfm.
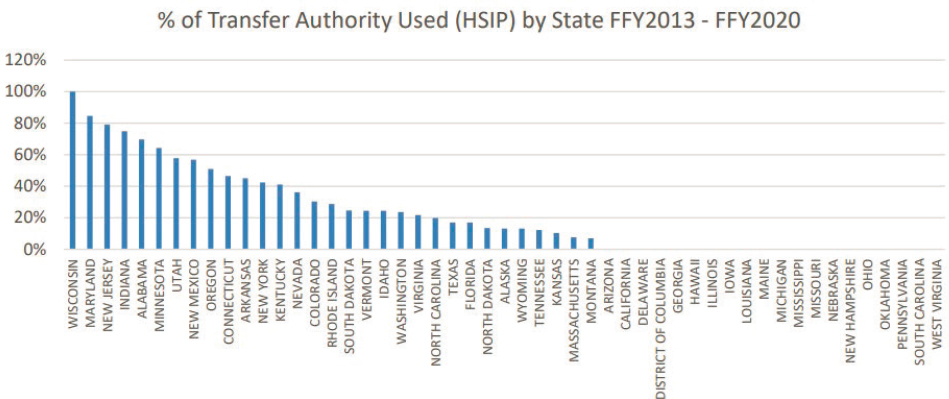
SOURCE: National Academies of Sciences, Engineering, and Medicine. 2022. Federal Funding Flexibility: Use of Federal Aid Highway Fund Transfers by State DOTs. Washington, DC: The National Academies Press. https://doi.org/10.17226/26696.
diverted by each state between FY 2013 and 2020.49 In some cases these transfers were made because HSIP funds were expiring, and selected safety projects could not be deployed before deadlines.
Behavioral interventions to advance road safety are supported by NHTSA, which spent at least $836 million in FY 2022 through Highway Safety Traffic Grants. These grants enable local roadway authorities to implement data-driven countermeasures against unsafe behaviors, such as impaired driving and speeding. The funds support expanded high visibility traffic law enforcement campaigns, other safe driving campaigns, educational programs about state seat belt laws and risky driving, and improvements in traffic records systems. NHTSA investments tend to be independent of FHWA site-specific safety improvements.
While having dedicated funds for safety improvements would seem to ensure some investments in safety projects, the effect of siloing safety money may have the effect of limiting expenditures because it seems to free the use of all other federal funds for purposes other than road safety.
PHASE III: POST IMPLEMENTATION EVALUATION
Important but not always activated, the third phase of the process shown in Figure 3-1 is evaluating the deployed countermeasure and delivering feedback to those responsible for the research and guidance development steps, as well as to those entities making decisions on research investments. In this phase, practitioners and/or researchers compare crash experience before and after implementation of countermeasures to assess their efficacy and cost-effectiveness, to discover anticipated and unexpected outcomes, to identify ways in which countermeasures can be improved and where they might best be deployed, and to determine how the research process itself might be improved.50 As shown earlier in Figure 3-1, there are opportunities for feedback and learning in both the first and second phases of the safety information delivery process, as well. That these evaluation and learning opportunities are not a systematic part of the process connecting crash problems and solutions is a lost opportunity for learning how to do better.51 The more structured research translation processes seen in some other fields and discussed in Chapter 5 address this gap.
___________________
49FHWA Associate Administrator, Office of Safety. “Highway Safety Improvement Program (HSIP) Eligibility Guidance.” February 2, 2022. https://safety.fhwa.dot.gov/hsip/rulemaking/docs/BIL_HSIP_Eligibility_Guidance.pdf.
50RSPCB. “Road Safety Fundamentals.” Accessed May 2, 2024. https://rspcb.safety.fhwa.dot.gov/RSF.
51Texas Transportation Institute. “Evaluation of Low-cost Safety Improvements.” Pooled Fund Study. 2019. https://www.pooledfund.org/details/study/332.
SUMMARY
This chapter used a committee-generated logic model to describe, understand, and communicate the steps involved in the current enterprise for transitioning road safety research to practice. This model illustrates the complexity of the overall process and identifies numerous points where the flow of research into practice can be interrupted.
Of particular concern is the fact that research needs are filtered to several different, parallel research programs, principally NCHRP and the research programs managed by FHWA and NHTSA. These programs operate independently, each setting its own priorities and selecting its own projects. While leaders of the road safety research community communicate and work together informally and through professional organizations, most notably TRB and its standing committees on safety, there is no strategic plan that coordinates these several research efforts to focus on national road safety priorities. Important portions of the process (e.g., research roadmaps and project selection criteria) are not visible to all stakeholders, isolating the broader stakeholder community from research investment decisions. Furthermore, feedback to researchers from field experience with research findings and guidance is limited, nor is there an established channel through which practitioners can seek answers to questions about countermeasure selection and deployment.
From the research to the deployment phases of this process of transitioning evidence-based research into practice, there are multiple opportunities for the flow of ideas and information to be disrupted, interrupted, and stopped. These include decisions not to fund a particular research effort, not to intervene in risk situations, rejection of research findings or guidance, decisions not to use a particular countermeasure or class of countermeasures for local reasons, and the failure to identify a suitable countermeasure. For example, state or local agencies know of research that could be applied, but for a variety of reasons choose not to do so. Practitioners may not use the research or a resource because they are not required to.
While having dedicated funds for safety improvements would seem to ensure some investments in safety projects, the effect of siloing safety money may have the effect of limiting expenditures by giving the impression that it frees all other federal funds to be used for purposes other than road safety. Finally, systematic feedback from the deployment phase could be particularly valuable in guiding future research based on field experiences of practitioners, thereby taking advantage of learning opportunities to guide more responsive research investment decisions, more effective research and research product design, and better countermeasure selection decisions.


