AI Applications for Automatic Pavement Condition Evaluation (2024)
Chapter: 3 State of the Practice
CHAPTER 3
State of the Practice
A questionnaire was developed to determine DOT practices regarding the use and application of AI technologies with an APCS. The questionnaire was provided to the 50 state DOTs, the District DOT, and the Puerto Rico Highway and Transportation Authority. Agencies were questioned about the use, benefits, and challenges of AI technology; APCS data collection; and the use of pavement condition survey results.
The intended recipients of the survey questionnaire were the pavement management (or comparable position) staff or persons responsible for the DOT pavement condition data collection and analysis. The detailed questionnaire is provided in Appendix A, and the DOTs’ responses are summarized in Appendix B.
Forty-three (43) of the 52 surveyed DOTs (83%) responded to the questionnaire. The number of responses received to specific questions can be less than 43. In the text and table and figure captions, the term n denotes the response sample size; the term n = x in the figure captions refers to the total number (x) of responses to a specific survey question.
APCS
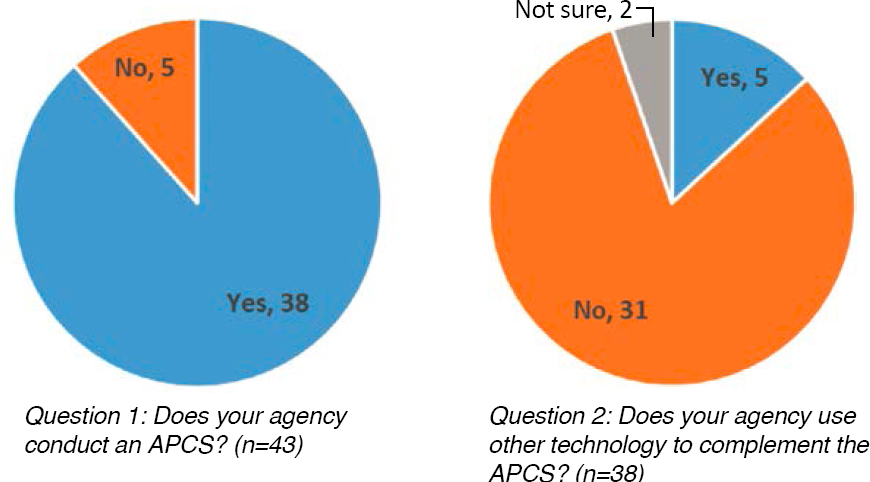
Agencies were asked whether they currently conduct an APCS to quantify pavement surface distress (excluding inertial profile measurements). Thirty-eight (38) of 43 DOTs (88%) responded in the affirmative (Figure 23a). DOTs that indicated not using an APCS (5 of 43 DOTs, 12%) were excluded from responding to the remainder of the questionnaire.
The 38 DOTs that conducted an APCS were asked whether other technologies (e.g., smartphones, more frequent assessment of safety-related distress) were used to complement the APCS. Thirty-one (31) of 38 DOTs (82%) indicated “no,” 2 of 38 DOTs (5%) indicated “not sure,” and 5 of 38 DOTs (13%) indicated “yes” (Figure 23b). The additional technologies noted by the DOTs included:
- Falling weight deflectometer and friction testing (Iowa);
- Laser Crack Measurement System (LCMS), LiDAR, Sideway-force Coefficient Routine Investigation Machine (SCRIM), and a visual survey (Kentucky);
- Roadway and right-of-way imagery and mobile LiDAR (Montana);
- A pavement condition rating (PCR) method to support pavement management system processes (Ohio); and
- Visual rating on approximately 6% of the network for audit sections (Texas).
Agencies were asked to indicate who collected and analyzed the APCS (survey question #6). Twenty-two (22) of 38 respondents (58%) indicated using a vendor for data collection and analysis, 12 of 38 respondents (32%) indicated using DOT personnel and DOT-owned and operated
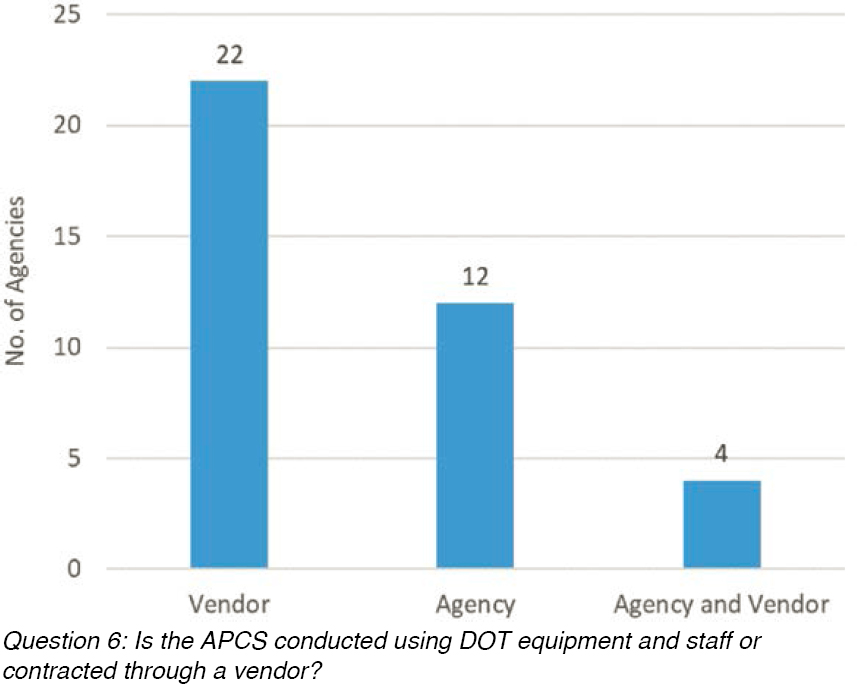
equipment, and 4 of 38 DOTs (11%) indicated using a combination of DOT and vendor equipment and personnel to complete the APCS (Figure 24). In addition, all 38 DOTs indicated using one of the same five vendors (survey question #7). Of these vendors, two are used by 29 of the 38 DOTs (76%).
AI Technology
As noted in Chapter 2, the use of AI technology with the APCS has gained popularity over recent years. Agencies were asked a series of questions related to the current and future use of AI along with the use of new and upcoming technologies. Eight (8) of 38 DOTs (21%) indicated currently using AI technology to process the APCS, 12 of 38 DOTs (32%) indicated being unsure whether AI was used (i.e., either the analysis is conducted using vendor software or the vendor conducts an APCS), and 18 of 38 DOTs (47%) indicated AI was not used to process the APCS (Figure 25b) (survey question #4). When asked whether they would consider using AI technology in the future, 18 of 30 DOTs (60%) that already use AI indicated “yes,” and 12 of 30 DOTs (40%)

indicated being unsure (Figure 25c) (survey question #5). Regarding the use of new technologies (e.g., autonomous vehicles, crowdsource), 15 of 38 DOTs (39%) indicated they may be used for future AI-based APCS, 18 of 38 DOTs (47%) indicated being unsure, and 5 of 38 DOTs (13%) indicated “no” (Figure 25a) (survey question #3).
As described in Chapter 2, a variety of models and tools are available with AI technology. Twenty-four (24) of 38 DOTs (63%) responding to the overall survey answered survey question #16. Sixteen (16) of 24 DOTs (67%) indicated they were unsure which models were used (Figure 26). Two (2) of 24 DOTs (8%) indicated using RF and ML, 1 of 24 DOTs (4%) indicated using neural network, and 1 of 24 DOTs (4%) indicated using pattern recognition. No DOT indicated using deep learning. Two (2) of 24 DOTs (8%) answered “other.” Texas noted that
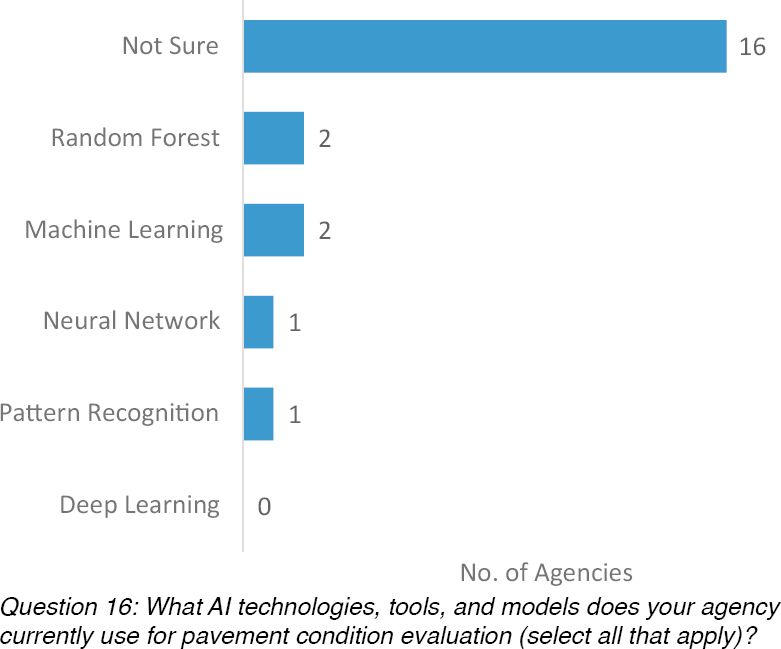

research is being conducted to evaluate AI models, and Utah is evaluating ML and DL models to use with the APCS.
When asked how agencies conducted AI technique development, training, and evaluation (Figure 27) (survey question #17),
- 15 of 27 DOTs (56%) indicated being unsure;
- 6 of 27 DOTs (22%) indicated requiring the evaluation of accuracy, precision, and repeatability;
- 5 of 27 DOTs (19%) compared the AI results to a manual survey;
- 3 of 27 DOTs (11%) compared the AI results to random or predefined reference sections;
- 2 of 27 DOTs (7%) compared the AI results to the results from the traditional APCS; and
- No DOT used Google Earth images for AI training.
Florida indicated using manual image classification, and Tennessee indicated providing the vendor with the distress library to train the AI models. (Note: The values of n do not add up to 27 because agencies were allowed to select multiple responses for this question.)
As described in Chapter 2, protocols and methods exist for crack detection using an APCS. Respondents were asked to indicate whether their DOT required the AI process to be in accordance with AASHTO R 85 (AASHTO 2018) (survey question #18). Twenty-one (21) of 27 DOTs (78%) indicated they were unsure, 2 of 27 DOTs (7%) indicated the AI process was in accordance with AASHTO R 85 (AASHTO 2018), and 2 of 27 DOTs (7%) indicated the AI process was not in accordance with AASHTO R 85 (AASHTO 2018) (Figure 28). Alabama and Michigan (2 of 27 DOTs, 7%) indicated the AI process was mostly in accordance with AASHTO R 85 (AASHTO 2018) (e.g., DOT requires the use of a 3 ft wheel path width).
Agencies were asked whether the AI process can be used on historical records (survey question #19). Seventeen (17) of 25 DOTs (68%) indicated being unsure, 4 of 25 DOTs (16%) indicated “no,” and 3 of 25 DOTs (12%) indicated “yes” (Figure 29). One (1) of 25 DOTs (4%) indicated the AI process was applicable for historical records if the data were collected using an LCMS.


Data and Image Requirements
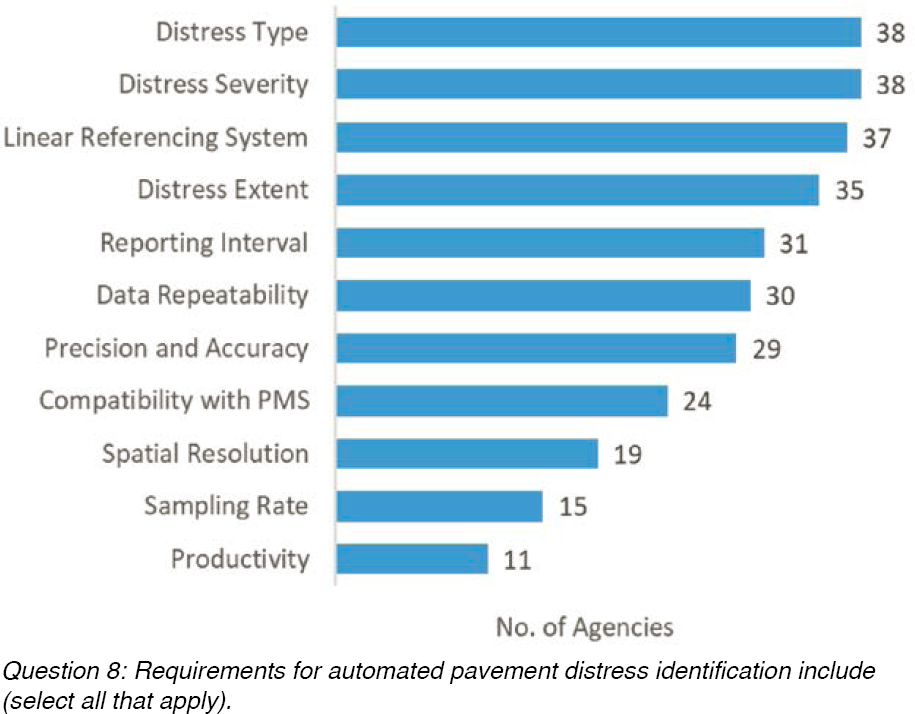
Agencies were asked to respond to multiple choice questions related to the APCS data and image requirements (survey question #8). Figure 30 provides a summary of responses to APCS requirements. DOTs indicated requiring the APCS to include:
- an assessment of distress type (38 of 38 DOTs, 100%), severity (38 of 38 DOTs, 100%), and extent (35 of 38 DOTs, 92%);
- utilization of a linear referencing system (37 of 38 DOTs, 97%); and
- requirements for a specific reporting interval (31 of 38 DOTs, 82%), data repeatability (30 of 38 DOTs, 79%), precision and accuracy (29 of 38 DOTs, 76%), and several other requirements (shown in Figure 30).
Delaware and Oregon also indicated the APCS is conducted in accordance with the data dictionary provided to the vendor and with DOT distress protocols, respectively. (Note: The values of n in Figure 30 do not add up to 38 because agencies were allowed to select multiple responses for this question.)
Agencies were asked to indicate whether any additional data and image requirements were needed for AI training and post processing (Figure 31) (survey questions #9 and #10). A majority of agencies (29 of 36 DOTs, 81%) were unsure whether any additional data format requirements were needed. Six (6) of 36 DOTs (17%) indicated no additional data format requirements were needed for the AI data analysis. Similarly, 28 of 37 DOTs (76%) were unsure whether any additional image quality requirements were needed, while 5 of 37 DOTs (14%) indicated no additional requirements were needed for the AI images analysis.
Florida noted the data collection and analysis were conducted in accordance with the DOT’s data libraries and required images (i.e., in .jpg format) to quantify raveling. Regarding image quality, Alaska indicated at least a 2mm resolution based on FAA research, although it was not entirely sure, and Colorado noted it needed images with similar resolution images. For example, the images collected from previous years may not have as high a resolution as the images collected

with current technology. Florida noted an image resolution of 4mm × 4mm pixels, and Maryland indicated the image size and resolution as important characteristics (e.g., free of artifacts and shadows).
Quantifying Distress
Pavement condition is quantified through the collection of pavement distress type, extent, and severity according to each DOT’s condition definitions. Figures 32 and 33 provide a summary of responses related to the use of AI technologies to identify distress on asphalt- and concrete-surfaced pavements, respectively (survey questions #13 and #14). Eight (8) of 38 DOTs (21%) indicated using AI to assess asphalt pavement condition. Quantified distress types include:
- transverse and longitudinal cracking (7 of 8 DOTs, 88%),
- alligator cracking (5 of 8 DOTs, 63%),
- block cracking and delaminations/potholes (4 of 8 DOTs, 50%),
- edge cracking (2 of 8 DOTs, 25%), and
- raveling (1 of 8 DOTs, 13%).
No DOT indicated using AI technology to quantify bleeding or weathering.
Eleven (11) of 27 DOTs (41%) indicated being unsure whether AI technologies were used to identify (a) transverse and longitudinal cracking (5 of 11 DOTs, 45%), (b) alligator and block cracking (4 of 11 DOTs, 36%), (c) patching and edge cracking (3 of 11 DOTs, 27%), (d) raveling (2 of 11 DOTs, 18%), and (e) delaminations/potholes and bleeding (1 of 11 DOTs, 9%). No DOT indicated identifying weathering. (Note: The values of n in Figure 32 do not add up to 27 because agencies were allowed to select multiple responses for this question.)

In addition, state DOTs provided the following comments:
- Alaska quantifies cracking as wheel path and non-wheel path cracking rather than alligator cracking;
- South Carolina classifies all wheel path cracking as fatigue cracking;
- Utah has conducted research using AI technology to quantify cracking, patching, and potholing; and
- Washington State uses the vendor crack rating system to conduct quality control of the manual “visual” rating.

For concrete pavement distress, seven DOTs indicated using AI technology to quantify:
- transverse cracking (6 of 7 DOTs, 86%),
- longitudinal cracking (5 of 7 DOTs, 71%),
- spalling (4 of 7 DOTs, 57%),
- multi-cracked slabs and corner cracking (3 of 7 DOTs, 43%),
- patching and punchouts (2 of 7 DOTs, 29%), and
- map cracking (1 of 7 DOTs, 14%).
No DOT indicated using AI technology to identify blowups, joint seal damage, polished aggregate, pumping, or scaling.
Nine (9) agencies indicated that concrete pavements were not used. The seven DOTs that indicated being unsure whether AI technologies were used reported quantifying:
- transverse and longitudinal cracking (4 of 7 DOTs, 57%),
- patching and joint seal damage (2 of 7 DOTs, 29%), and
- spalling (1 of 7 DOTs, 14%).
In addition, DOTs that indicated being unsure whether AI technology was used also indicated blowups, corner cracking, map cracking, multi-cracked slabs, polished aggregate, pumping, and scaling were not included in the APCS.
The APCS provides a number of additional capabilities for roadside asset data collection and analysis. Specifically, agencies were asked to indicate whether additional roadway features (e.g., slope embankment, excess vegetation growth, markings, signs) were assessed as part of the APCS (survey question #15). Six (6) of 8 agencies (75%) reported that roadside assets (e.g., markings, signs) were collected. Georgia noted it was in the process of evaluating AI technology to assess roadside assets and excess vegetation growth; Utah indicated it was in the process of assessing roadside assets. (Note: The values of n in Figure 33 do not add up to 23 because agencies were allowed to select multiple responses for this question.)
Use of APCS Results
Specific to the pavement management activities, agencies were asked to indicate how the APCS results were used (survey question #11) (Figure 34). Thirty-eight (38) of 38 DOTs indicated the APCS results were used for the HPMS reporting requirements. In addition, 36 of 38 (95%) DOTs indicated using the APCS results to determine a pavement condition rating or index and for pavement performance modeling. Other usage of the APCS results included reporting for the Moving Ahead for Progress in the 21st Century Act (MAP-21) (33 of 38 DOTs, 87%), detecting individual and prevalent distress types (29 and 22 of 38 DOTs, 76% and 58%, respectively), and road safety assessment (11 of 38 DOTs, 29%). Alabama indicated that the APCS results are used to screen potential preservation treatment types (e.g., microsurfacing may require two passes when rutting is greater than 0.25 in.). Oregon uses the results to determine state pavement condition performance measures (i.e., percent of miles rated “fair” or better). Texas utilizes the results in support of developing pavement management plans. (Note: The values of n in Figure 34 do not add up to 38 because agencies were allowed to select multiple responses for this question.)
Pavement condition data are routinely used to support agency decisions related to budgeting, multi-year planning, and establishing performance targets. Agencies were asked to identify decision-making activities based, in part, on the results of the APCS (survey question #12)

(Figure 35). (Note: The values of n in Figure 35 do not add up to 38 because agencies were allowed to select multiple responses for this question.) Agencies indicated APCS results were used to:
- verify performance models (32 of 38 DOTs, 84%),
- establish performance targets and goals (31 of 38 DOTs, 82%),
- determine treatment selection (31 of 38 DOTs, 82%),
- conduct multi-year planning (31 of 38 DOTs, 82%),
- conduct budgeting (27 of 38 DOTs, 71%),

- establish performance specifications and measures (14 of 38 DOTs, 37%),
- trigger safety-related repairs (10 of 38 DOTs, 26%), and
- approximate bid quantities (9 of 38 DOTs, 24%).
Additional DOT uses included the following:
- Alabama: in support of transportation asset management;
- Maryland: in support of transportation asset management and system preservation;
- Ohio: Federal reporting; and
- South Carolina: contract performance (monitored by another division within the DOT).
AI Challenges and Benefits
As with any technology, the evaluation and implementation of AI involve challenges. Agencies were asked to provide challenges (Figure 36) (survey question #20) and benefits (Figure 37) (survey question #21) of using AI. Noted challenges included:
- limited DOT knowledge (14 of 25 DOTs, 56%),
- ground truth testing (10 of 25 DOTs, 40%),
- trusting the AI results (9 of 25 DOTs, 36%),
- computer computation capabilities (5 of 25 DOTs, 20%), and
- unsure (2 of 25 DOTs, 8%).
In addition, Delaware indicated relying on the expertise of the vendor. Washington State noted challenges with distinguishing multiple crack types within a given area and mistakenly quantifying paving joints and chipped paint or shoulder rumble strips as cracking.
Noted benefits included:
- objectivity with the AI process (14 of 25 DOTs, 56%),
- improved accuracy and increased productivity (13 of 25 DOTs, 52%), and
- cost savings (7 of 25 DOTs, 28%).


However, one responding DOT was unsure about the benefits of the AI process. (Note: The values of n in Figure 37 do not add up to 25 because agencies were allowed to select multiple responses for this question.)
Summary
An online questionnaire was prepared and distributed to 52 agencies (i.e., the 50 state DOTs, the District DOT, and the Puerto Rico Highway and Transportation Authority). In total, 43 agencies (83%) responded to the survey. Agencies were asked to respond to questions related to the APCS, AI technology, data and image requirements, distress types evaluated, use of APCS results, and the challenges and benefits of using AI. Key findings from the DOT questionnaire included:
- Thirty-eight (38) of 43 DOTs (88%) reported using an APCS to quantify pavement conditions. Of these,
- 5 of 43 DOTs (12%) indicated using other condition assessment activities in support of the APCS, including falling weight deflectometer (FWD) testing, friction testing, LCMS, LiDAR, SCRIM, PCR, and visually rating a portion of the network for auditing the APCS;
- 22 of 38 DOTs (58%) indicated a vendor conducted the APCS;
- 12 of 38 DOTs (32%) indicated conducting the APCS using DOT-purchased equipment and staff; and
- 4 of 38 DOTs (11%) indicated using a combination of DOT and vendor equipment and staff.
- Eight (8) of 38 DOTs (21%) reported AI technology was used to analyze the APCS, 18 of 38 DOTs indicated it was not used, and 12 of 38 DOTs (32%) were unsure about its use. Of the 30 agencies that indicated AI technology was not used or were unsure whether it was used:
- 18 of 30 DOTs (60%) noted they would consider its use in the future, and
- 12 of 30 DOTs (40%) indicated they were unsure about its future use.
- New technologies (e.g., smartphone applications) are emerging for pavement condition data assessment. Agencies were asked whether these technologies are used to complement the APCS:
- 15 of 38 DOTs (39%) indicated “yes,”
- 5 of 38 DOTs (13%) indicated “no,” and
- 18 of 38 DOTs (47%) indicated they were unsure.
- APCS analysis using AI technology requires a model to change from an image to distress detection. Agencies were asked to identify which models were used for the APCS analysis:
- 16 of 24 DOTs (67%) indicated they were unsure,
- 2 of 24 DOTs (8%) indicated using RF or ML, and
- 1 of 24 DOTs (4%) indicated using neural networks or pattern recognition.
- The development, training, and evaluation of AI technology requires several activities. Agencies were asked to indicate the activities used to evaluate the AI results:
- 15 of 27 DOTs (56%) indicated being unsure how the AI results were developed, trained, or evaluated;
- 6 of 27 DOTs (22%) indicated using accuracy, precision, and repeatability criteria;
- 5 of 27 DOTs (19%) indicated comparing the AI results to manual survey results;
- 3 of 27 DOTs (11%) indicated using random or predefined reference sections for comparisons; and
- 2 of 27 DOTs (7%) indicated comparing the AI results to traditional APCS results.
- Regarding distress protocols:
- 2 of 27 DOTs (7%) indicated the AI process complied with AASHTO R 85 (AASHTO 2018),
- 2 of 27 DOTs (7%) indicated the process was very similar to AASHTO R 85 (AASHTO 2018),
- 2 of 27 DOTs (7%) indicated the AI process did not comply with AASHTO R 85 (AASHTO 2018), and
- 21 of 27 DOTs (78%) indicated being unsure.
- Agencies have been conducting APCSs for decades, but AI technology is a more recent development. Three (3) of 25 DOTs (12%) indicated the AI process could be used on historical records, 3 of 25 DOTs (12%) indicated it could not be used, and 16 of 25 DOTs (64%) were unsure.
- To obtain quality results, several requirements for APCS data and images must be met. Thirty-eight (38) of 38 DOTs (100%) required distress type and severity as part of the APCS. Additional requirements included:
- a linear referencing system (37 of 38 DOTs, 97%),
- distress extent (35 of 38 DOTs, 92%),
- reporting interval (31 of 38 DOTs, 82%),
- data repeatability (30 of 38 DOTs, 79%),
- precision and accuracy (29 of 38 DOTs, 76%),
- compatibility with the existing pavement management system (24 of 38 DOTs, 63%),
- spatial resolution (19 of 38 DOTs, 50%),
- sampling rate (15 of 38 DOTs, 39%), and
- productivity (11 of 38 DOTs, 29%).
- Eight (8) of 38 DOTs (21%) indicated AI technology was used to identify asphalt surface distresses, and 7 of 38 DOTs (18%) indicated using it to identify concrete surface distresses. For asphalt pavements, the predominant distress types identified included transverse and longitudinal cracking (7 of 8 DOTs, 88%) and alligator cracking (5 of 8 DOTs, 63%). For concrete pavements, predominant distress types included transverse (6 of 7 DOTs, 86%) and longitudinal cracking (5 of 7 DOTs, 71%).
- The results of the APCS are predominantly used for HPMS (38 of 38 DOTs, 100%) and MAP-21 reporting (33 of 38 DOTs, 87%), pavement condition assessment and performance modeling (36 of 38 DOTs, 95%, each) and detecting prevalent distress type (22 of 38 DOTs, 58%).
- APCS results are also used to support DOT decisions. Most agencies indicated using the APCS results to:
- verify performance models (32 of 38 DOTs, 84%),
- establish performance targets (31 of 38 DOTs, 82%),
- target performance goals (31 of 38 DOTs, 82%),
- select treatment types (31 of 38 DOTs, 82%), and
- plan multiyear budgets (31 of 38 DOTs, 82%).
- AI technology for APCS analysis has been used for years and has generated several benefits. Benefits noted by the DOTs included:
- objectivity (14 of 25 DOTs, 56%),
- accuracy and increased productivity (13 of 25 DOTs, 52%, each), and
- cost savings (7 of 25 DOTs, 28%).
- Challenges noted by the DOTs regarding the use of AI technology for APCS analysis included:
- accuracy, precision, and repeatability (6 of 24 DOTs, 25%);
- comparison to manual surveys (3 of 24 DOTs, 13%);
- use of random and predefined reference sections (3 of 24 DOTs, 13%, each); and
- comparison to traditional APCS (2 of 24 DOTs, 8%).


