AI Applications for Automatic Pavement Condition Evaluation (2024)
Chapter: 4 Case Examples
CHAPTER 4
Case Examples
The development of case examples describing individual DOT practices is an integral part of the synthesis effort. However, the relatively recent development and implementation of 3D technology and the use of AI for APCS analysis resulted in difficulties identifying any DOT able to provide details and specifics for case example development. Therefore, this chapter provides a general summary of efforts made for AI model development and training.
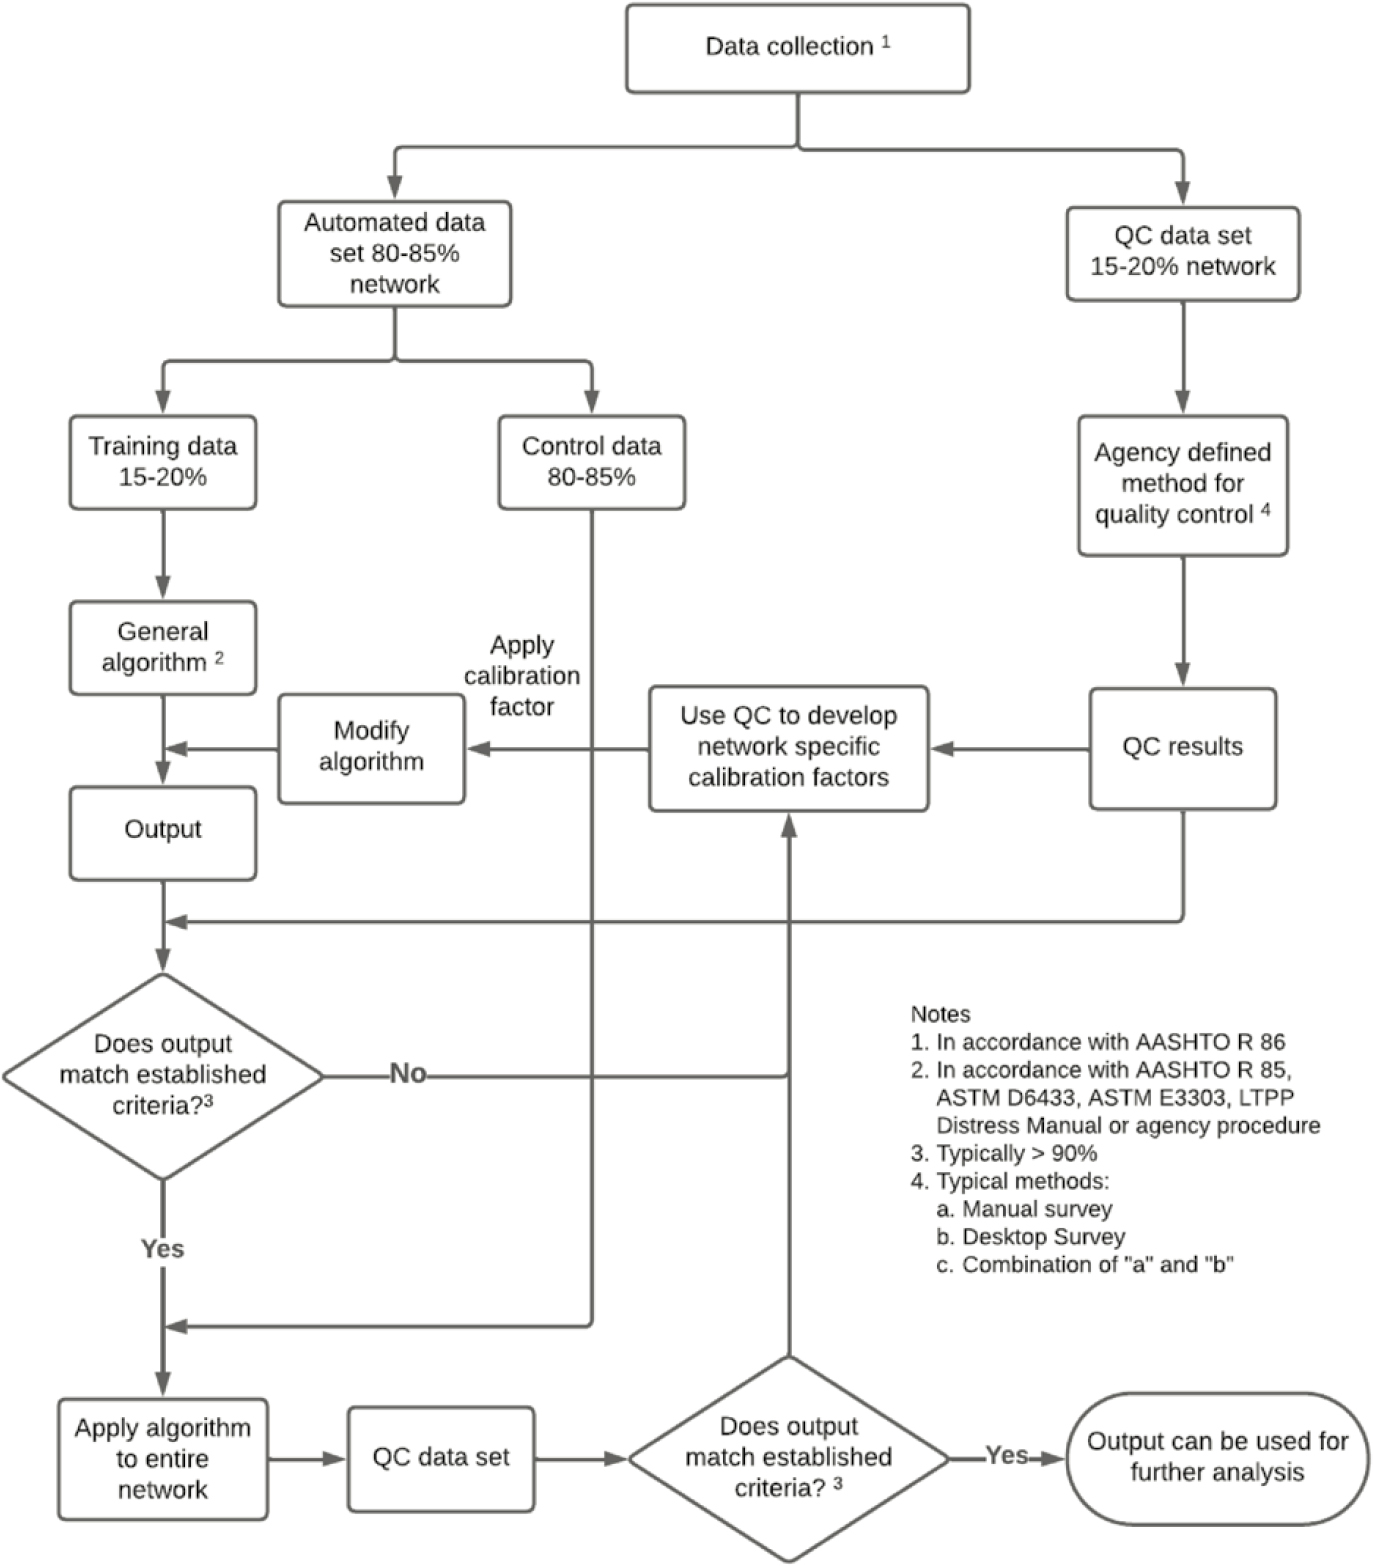
One method for quantifying distress is to evaluate the APCS results using ASTM D6433 (ASTM 2023) and/or AASHTO R 85 (AASHTO 2018). Typically, the collected data, preferably using AASHTO R 86 (AASHTO 2022), are divided into two data sets, one for training (15 to 20% of the entire data set) and one for control (80 to 85% of the entire data set). The training data set is used to fine-tune the algorithm to ensure different distresses (or distress indices) are correctly identified for the specific pavement network. Because the crack identification can vary significantly between different pavement distress and conditions, the training data set should include distress types and conditions (i.e., good, fair, poor, and very poor) representative of the pavement network being surveyed. As part of the training stage, it is also recommended to conduct a manual quality control pavement condition survey to ensure the algorithms are correctly and accurately identifying and measuring the distresses (or indices). Typically, the following three methods are used to conduct the manual data quality control (QC):
- Method 1: The most detailed, time-consuming, and costly approach includes experienced technicians or engineers conducting manual detailed distress data collection (i.e., ground truth testing). Ideally, this method includes collecting detailed pavement distress data on 15 to 20% of the pavement network.
- Method 2: A more cost-effective approach, and more typically used, is to conduct a detailed desktop pavement distress survey using the images collected during the APCS. As part of this method, experienced technicians or engineers utilize special software to view, identify, and quantify distress type, severity, and extent on 15 to 20% of the pavement network.
- Method 3: In this method, limited manual distress data collection is carried out, followed by an extensive desktop pavement condition survey (combination of Method 1 and 2). If the budget allows, this approach is the most preferred because the in-field survey provides ground truth information, which may be difficult to capture through images and/or a crack map alone.
Based on a comparison of the manual QC and the output from the general algorithm, the general algorithm is modified to ensure a high percentage (> 90%) of the output from the algorithm matches the manual data QC. Once this match is achieved, the algorithm is tailored to the network data and can be applied to the control data set. To ensure the quality of the final output, another round of QC testing using Method 2 is recommended for evaluating the control data set. Figure 38 illustrates the overall process for developing and calibrating an algorithm for distress prediction at the network level.
After multiple iterations over different networks, the algorithm is usually modified enough that it tends to predict the distresses with a high level of accuracy. If this is true, the training data set can be further reduced to less than 10% of the total data set and divided into two data sets, one for calibration (5%) and one for spot checks (5%). The calibration data set is used to test and/or calibrate the modified algorithm to ensure accurate predictions. Once the algorithm matches a higher percentage (> 90%) of the calibration data, it should then be checked against the check data set. If the algorithms are still correctly predicting a higher percentage (> 90%) of the check data set, then it can be applied to the remainder of the data set. Spot checks and QC utilizing Method 2 should be performed to ensure the final output reflects the ground truth testing results.

