Enhancing Airport Access with Emerging Mobility (2025)
Chapter: 6 Impact of Connected and Automated Vehicles on Airport Landside
CHAPTER 6
Impact of Connected and Automated Vehicles on Airport Landside
Introduction
This chapter provides an overview of the potential impact of the introduction of connected and automated vehicles (CAVs) on the airport landside. It summarizes the key findings of vehicular traffic simulations. The incremental introduction of CAVs with a higher level of automation was simulated through a modeled airport example. The chapter also explores potential changes in operating policies, communication systems, and infrastructure required to accommodate CAVs in the safest and most efficient manner possible.
Most of this chapter concerns vehicles with SAE driving automation Level 3 or more—the conditional, high, and full driving automation levels. Prior to the introduction of vehicles with such features, the impact of CAVs on airport infrastructure and operations will be limited. CAVs up to Level 2 are human-driven vehicles (HDVs)—all decision-making comes from the driver, with assistance from the system (“you drive, you monitor”). These CAVs cannot “drive back” empty to their origin, staging area, or station.
CAVs with driving automation Level 3 or higher activated are “self-driving” vehicles. Level 3 vehicles have automated driving features that allow their human driver to stay out of the loop, unless the vehicle is in a situation it cannot handle automatically. The system drives the vehicle, but the human driver must be able to take over; Level 3 CAVs cannot drive empty. Vehicles with driving automation Level 4 or 5 are driverless by design, with human override still an option for Level 4. These levels of CAVs can move without human involvement, generating new flows of empty cars and influencing the demand for facilities such as airport parking and staging areas.
Automated Driving Impact Assessment Through Traffic Simulations
Purpose
A research analysis was performed with a VISSIM traffic simulation model of the existing roadway system of Philadelphia International Airport (PHL) to self-driving (Level 3+) CAV penetration. Traffic counts gathered at PHL in 2019 (pre-COVID-19) were used to develop the VISSIM model for evaluating airport curbside roadway operations with different self-driving CAV penetration-rate scenarios.
The aim of the analysis was to understand whether these CAVs have the potential to improve airport operations and reduce delays as a means of deferring major capital investment in infrastructure. The primary measure of performance in the analysis—to determine the impact of Level 3+ automated driving features on operations—was a comparison of the level of service (LOS) and queue spillbacks at the frontages, also known as terminal curbside. For this purpose,
different traffic regulation and infrastructure strategies were simulated to explore how to leverage the full potential of self-driving CAVs to enhance operations.
Note that while PHL’s roadway system and traffic data were used to provide a realistic simulation environment, the results do not necessarily reflect future roadway traffic conditions at the simulated airport. In other words, the intent of these simulations was not to accurately forecast the future of CAV operations at PHL but rather to provide high-level findings on the potential impact of CAVs with automated driving features activated through fictional but realistic airport landside simulations.
Assumptions and Scenarios
Two different scenarios (or strategies) were tested to analyze the effect of self-driving CAV penetration on traffic volumes:
- Scenario 1, “CAVs at the Curb”: existing roadway conditions with shared curbside frontage among self-driving CAVs and HDVs on the same roadways.
- Scenario 2, “Local Staging Areas”: curbside congestion alleviated by staging the self-driving CAV overflow before the arrivals at frontages to minimize dwell times and delays to passengers.
Scenarios were then evaluated with two different traffic levels: Level A, which assumed 2019 traffic volumes, and Level B, a 15 percent increase from 2019 traffic volumes. The 15 percent increase in traffic volume represented an approximately 30 percent increase in the annual origin and destination passenger volumes, assuming the peak-hour traffic volumes absorb about half the average daily increase in traffic volumes. For each scenario and traffic level, CAV penetration rates were assumed at 0, 30, 60, and 90 percent of the total traffic volume. (Note: Appendix C provides a guide on how to account for CAVs in traffic flow simulations.)
Main Findings
Based on visual observations of the animated simulation and quantitative measures of performance of the model, network operations generally improved at higher penetration of self-driving CAVs. For example, under Scenario 1, queues were reduced at the airport exit weaving segment—usually a critical bottleneck—with higher self-driving CAV market share, as shown in Table 20. The origin of the queue length measurement is shown in Figure 48.
At 0 percent penetration rate, significant queue extensions occurred that sometimes blocked access to the frontages. At 30 percent penetration rate, there was a significant reduction—about 80 percent—in the queue spillback. At 60 percent penetration rate, queue spillbacks were reduced to less than 0.5 percent of the original baseline queues. The improvement (i.e., reduction) in queue lengths beyond 60 percent penetration rate was minimal.
Table 20. Average Queue Lengths from Simulated Self-Driving CAV Penetration Rates at PHL Exit Weaving Segment
| Penetration Rate | Average Queue Length (feet) |
|---|---|
| 0% | 4,127 |
| 30% | 768 |
| 60% | 20 |
| 90% | 6 |
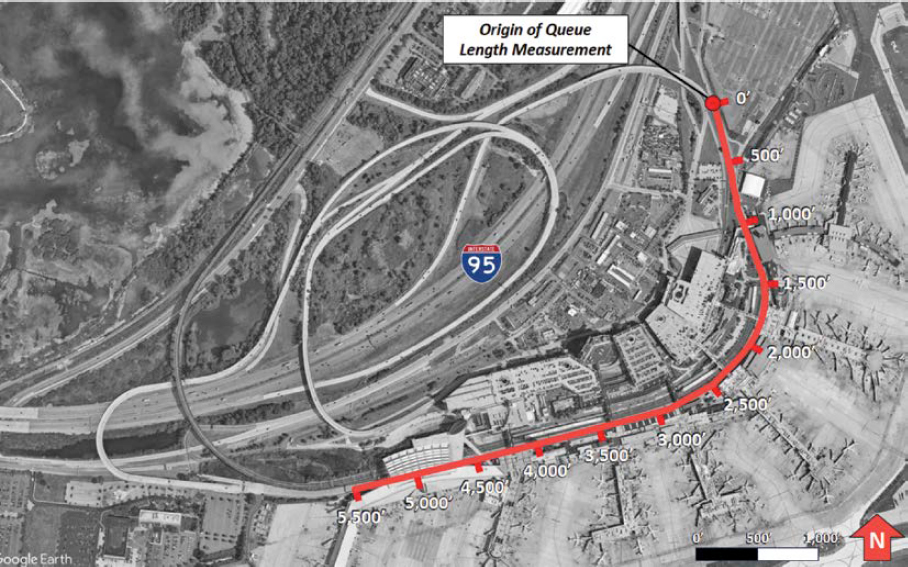
Table 21 presents the relationship between recirculation volumes, in vehicles per hour, at the arrivals frontage (a measure of frontage congestion) and CAV penetration rates. At 0 percent penetration, the recirculation volume was about 591 vehicles at the peak hour, indicating congested conditions or difficulty maneuvering into a parking spot at some frontages. As the penetration increased, there was a reduction in recirculation volumes of approximately 100 vehicles for each 30 percent increase in penetration.
The simulation results also indicate that the degree of saturation (or volume-to-capacity ratio) and LOS trended toward improvement. From a preliminary analysis, it appears that recirculation demand was lower at higher penetration rates. The LOS parameters were derived from Table 5-2 in ACRP Report 40: Airport Curbside and Terminal Area Roadway Operations (LeighFisher 2010).
The total processed vehicles and total “parked arrivals” (i.e., vehicles stopping at the curbside to pick up passengers) were highest at the 30 percent penetration rate, which could erroneously lead to a conclusion that this penetration rate is the most optimal at this airport setting. However, recirculation volumes were higher at 30 percent than at 60 percent and 90 percent penetration, an indication that the 30 percent penetration rate had more vehicles that were unable to stop and
Table 21. Average Recirculation Volumes of Arrivals from Simulated Self-Driving CAV Penetration Rates
| Penetration Rate | Recirculation Volumes (vh/h) |
|---|---|
| 0% | 591 |
| 30% | 500 |
| 60% | 409 |
| 90% | 288 |
would be forced to recirculate. Additionally, downstream queues at the airport exit weave segment persisted at the 30 percent penetration rate; this unexpectedly helped to meter recirculation volumes at the arrivals frontage and artificially improved the “parked” volumes at the 30 percent penetration rate.
At the 60 percent and 90 percent penetration rates, queues at the weave segment at the airport exit rarely spilled back and were typically able to process without impacting the frontages upstream. Traffic operations along the frontages, when observed as LOS as defined in ACRP Report 40 (LeighFisher 2010), indicate that the frontages trended from LOS C to LOS B.
Strategies for Managing CAVs
This section explores strategies for managing self-driving CAVs to mitigate adverse interactions between these vehicles, vehicles without automated driving features, and pedestrians, as well as maximize the benefits of targeted traffic management rules that apply to CAVs only. The comparative benefit of these different strategies and their overall relevance might change over time. For instance, while separate and CAV-dedicated curbsides might provide robust and safe accommodation for self-driving CAVs during the early hours of their operations, this strategy might be unnecessarily resource-demanding in the long term once automated driving systems (ADS) technologies are mature and their adoption becomes widespread.
Dedicated Curbsides for Self-Driving CAVs
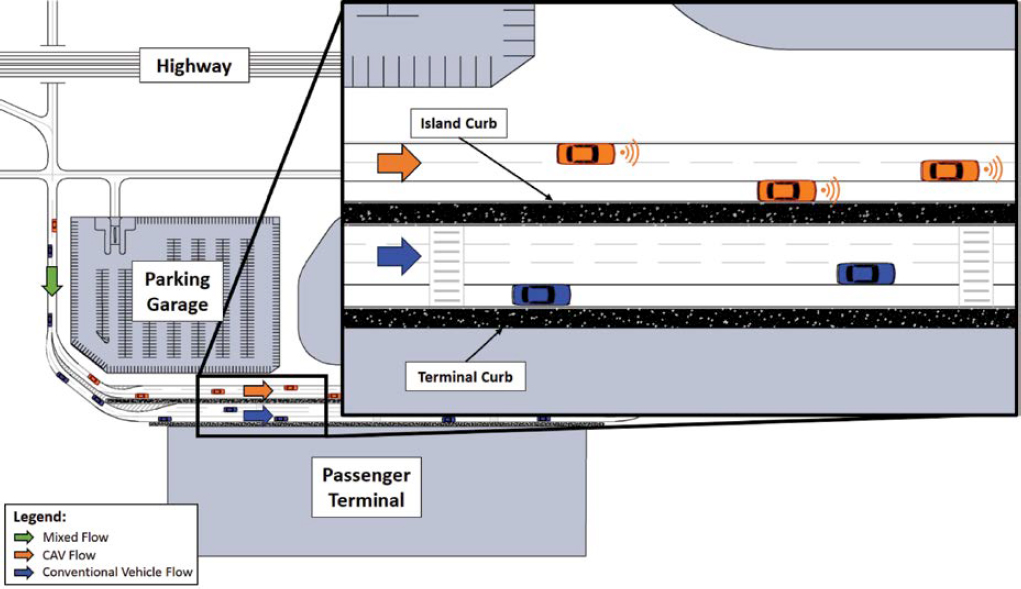
Airports with several curbside lanes and opportunities to isolate them could provide laterally separated curbsides for vehicles with and without automated driving features. The purpose of this strategy is to isolate self-driving CAVs from the rest of the vehicular traffic after the inbound curbside ramp, which will provide these vehicles with a dedicated and controlled low-energy area where vehicle-to-vehicle (V2V) and vehicle-to-infrastructure (V2I) technology (see Chapter 5 for definitions) can be fully leveraged and real-life trials can be conducted. This can prevent adverse maneuvering interactions between CAVs and non-CAVs as well as minimize or contain certain types of incidents that have occurred during early testing of CAVs in dense urban areas until these technologies become mature enough to allow safe and efficient mixed curbside operations. Also, these dedicated CAV curbsides should avoid pedestrian crossings and keep users on the boarding side of the curb to make pick-up and drop-off operations safer and more efficient.
Figure 49 depicts the concept of dedicated curbside lanes for CAVs.
Same Curbside Allocation
The curbside space is scarce at many airports that cannot implement a fully dedicated curbside for CAVs. Building on the introduction of transportation network companies (TNCs), these airports can dedicate a longitudinal portion of their curbside for CAV pick-up and drop-off, just as such space allocation is conducted today for separating existing curbside users. Figure 50 depicts the curbside with a CAV space allocation.
Near-Curbside Staging Areas
Departing passengers must arrive at the airport with enough time to allow for check-in, security screening, and flight boarding. The distribution of time before flight departure in which passengers arrive is called the passenger show-up profile. Departing passengers typically arrive at the airport over a wide span of time, with some getting to the airport three or more hours before

departure and others just a few minutes before departure. However, arriving passengers present themselves at the curb in surges, soon after flight arrival or claiming bags. Vehicle dwell time at the arrivals curb is a function of vehicle arrival time and passenger arrival time at the curb. Vehicle surges at the arrival curb are typical, similar to the arrival passenger surges. A logical option to accommodate these surges is to provide a near-curbside (local) lot as a buffer in the system, with a role that is similar to today’s cell lots.
The important criteria in selecting a local lot location should be quick access to the arrivals curbside. The travel time from the local lot to the arrivals curbside should be minimal because passengers will be at the curbside, waiting for their car. In theory, the vehicle dwell time will also decrease since passengers arrive earlier than vehicles.
An airport will benefit from a local lot if the pick-up dwell time is high; if their curbsides are constrained; or if the upstream processes, such as inbound baggage delivery, are not streamlined. The pick-up dwell time is a direct indicator of expected local lot demand. If the airport experiences higher dwell times compared to airports of similar sizes, then a properly sized local lot will be beneficial. A local lot will benefit airports of all sizes. Sizing of the local lot will depend on passenger characteristics and peak-hour terminating passenger demand at the airport.
Figure 51 illustrates the near-curbside staging area for CAVs.
Remote Staging Areas
Small- and medium-hub airports with constrained arrival curbsides and large-hub airports may require a remote lot. The remote lot could be at any location at the airport and not constrained by travel time to the arrivals curbside. The remote lot could also serve as a temporary holding location for CAVs. A typical operation policy may be to hold CAVs at a remote lot until their
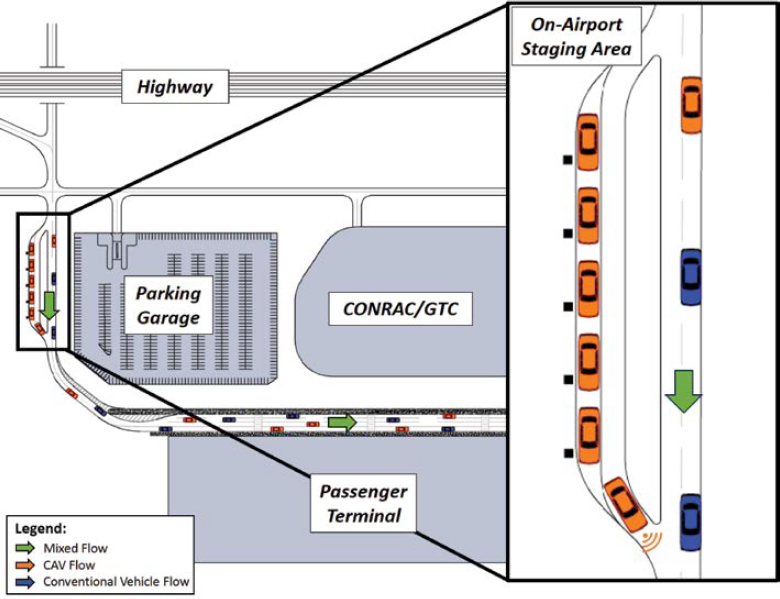
Note: CONRAC = consolidated rental car; GTC = ground transportation center.
flight arrives and then release the vehicles to either the local lot or arrivals curbside, depending on the utilization at the local lot. Factors to consider for a remote lot include the following:
- Catchment area, which results in vehicles traveling greater distances.
- Large metropolitan areas with extensive variability in traffic delays.
- Routine or weather-related flight delays.
- Size of the local lot and location.
- Accessibility to the local lot from the remote lot.
- Travel time to the local lot or arrivals curbside from the remote lot.
Figure 52 illustrates the concept of remote staging areas.
Dedicated Lanes for CAVs
NCHRP Research Report 891: Dedicating Lanes for Priority or Exclusive Use by Connected and Automated Vehicles (Booz Allen Hamilton et al. 2018) provides a guide for agencies on operational characteristics and impacts of dedicated lanes, including regulatory and policy guidance for states and local agencies on the intended benefits in terms of safety, mobility, and environmental and societal considerations; the conditions amenable to dedicating lanes for priority and exclusive use by CAVs; as well as laws and regulations regarding dedicating lanes.
The research identified that dedicated lanes for CAVs provide benefits to these vehicles, such as an increase in the average travel speed and a reduction in energy consumption. While other users mostly benefit from the induced effect of CAV lanes, simulations showed that non-CAVs (general purpose lane users) may experience slightly adverse conditions under low market penetration of CAVs. Overall, implementing dedicated lanes for CAVs might lead to a slight-to-moderate increase of the overall throughput at peak hours.
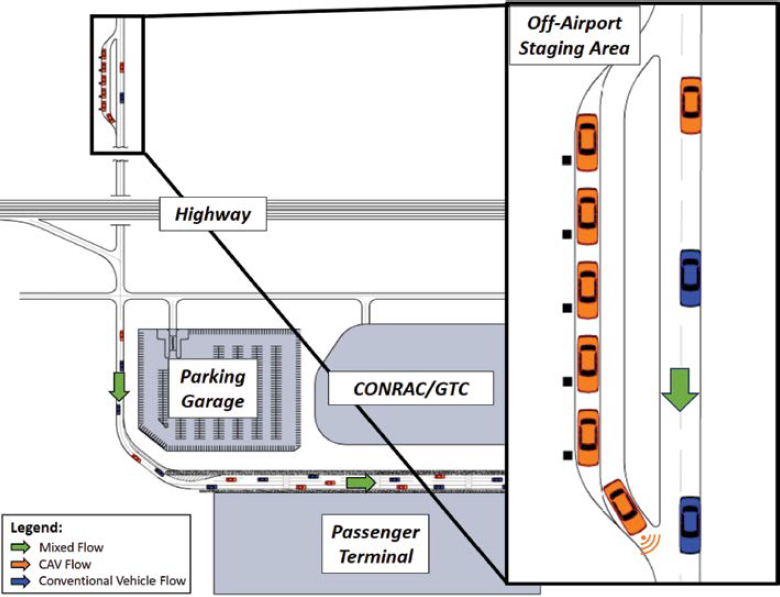
Note: CONRAC = consolidated rental car; GTC = ground transportation center.
The report suggested the following strategies in order to maximize benefits:
- Lower market penetration rates (up to 20 percent): CAVs share dedicated lanes with high-occupancy vehicles (HOVs).
- Higher market penetration rates (20 to 45 percent): Have exclusive lane access at a market penetration level that is at least proportional to the number of lanes dedicated to their exclusive use so that all lanes are fully utilized.
- Beyond 45 percent market penetration rates: Dedicated lanes for CAVs no longer bring significant benefits.
The Michigan Department of Transportation and Cavnue are working on developing a CAV corridor along Interstate 94. The project is designed to improve safety on the corridor, reduce congestion, improve mobility on the corridor, and support the advancement of CAV technologies. The intent of this project is to future-proof the corridor for future vehicle technologies—including personal vehicles, public transit, and freight—to move people and goods throughout the region safely and efficiently. The corridor will connect Detroit and Ann Arbor along with key communities and destinations in Wayne and Washtenaw Counties—including Detroit Metropolitan Wayne County Airport (DTW). CAVs, traditional transit vehicles, shared mobility, freight, and personal vehicles will coexist along this corridor.
CAV Traffic Management
CAV management strategies should include the development of policies on traffic regulation for self-driving CAVs. For instance, airports should define passenger wait-time goals for the local self-driving CAV traffic. The remote lot location should be selected depending on the criteria. Remote staging areas may also be available off-airport once these vehicles become widespread. Also, triggers should be defined for closing off local (on-airport) staging areas to further inbound vehicles, requiring vehicles eligible for buffers to find remote areas off-airport.
In addition, traffic management rules and pricing strategies might be developed by local governments for public roads and other infrastructure owner-operators (IOOs) on their property. Airports should maintain awareness of any changes to traffic management rules that could impact their own operations. They should also work with local governments and other IOOs to address these issues and collaboratively manage the CAV infrastructure capacity as a common resource.
Developing a Local Roadmap to Accommodate CAVs
Developing an airport-specific strategy requires an analysis of the local demand and identification of opportunities for pilot projects and step-by-step deployment. Pilot projects can be leveraged to understand the operational implications of CAV operations and the infrastructure needs for these vehicles. The preferred strategy for accommodating these activities is influenced by the airport setting and its specificities, CAV implementation, and mode choice within the airport catchment area. These parameters will change over time—for example, with the introduction of new driving automation technologies and the local adoption of CAV-based mobility.
For instance, dedicated outer curbs—as depicted in Figure 49—or remote curb areas might be preferable to conduct pilot projects since these curb options offer limited pedestrian-crossing and human-driven interactions in order to minimize and contain potential incidents. However, not all airports have the curbside or landside resources for accommodating such a setting. In addition, when self-driving CAVs become more widespread and the technology is mature and integrated, human-driven and self-driving vehicle flows may be combined, and the curb space may be allocated by user group like it is mainly done today. Near-curbside staging areas are only
relevant to specific user categories, such as ridesharing and other types of on-demand mobility. This includes empty, driverless (Level 4+) vehicles in the situations described earlier.
Local roadmaps should outline a step-by-step approach to CAV implementation that is consistent with the evolution of local contexts and realistic opportunities for early testing. Key steps should include
- Monitoring demonstrations and assessing the local CAV demand,
- Developing policies and procedures to enable initial deployment,
- Running pilot projects for testing deployment at limited scale,
- Developing capital projects to support broader implementation, and
- Reassessing and adapting policies and plans based on the evolution of the technology.
Duval et al. (2023) developed a roadmap to mobility automation for Dallas Fort Worth International Airport (DFW). The roadmap addresses mobility automation beyond CAV technologies and features key decision points for short- and longer-term implementation.
Additional Optimizations
Digital Infrastructure and Operating Rules
Industry-stakeholder interviews were conducted by FHWA to “further the understanding of interaction between AVs and highway infrastructure, increase preparedness among transportation agencies, and promote collaboration across various industry domains” (Gopalakrishna et al. 2021). The following key observations became apparent from the interviews:
- Digital information standards
- – “IOOs can potentially assist with AV [automated vehicle] rollout by providing slow-moving data via base maps or using data on lane assignment, road work, and road conditions, hosted on cloud platforms.”
- – “Cybersecurity for infrastructure connectivity should be commensurate with the cybersecurity practices of the automotive industry.”
- Operational design domains
- – “AV manufacturers are responsible for safety assessment and nomination of ODDs [object design domains].”
- – IOOs have a limited role in assisting with ODD definitions and nominations because ODDs are extremely complex and difficult and are proprietary to a company’s AV product and its ADS.
The infrastructure of the future needs to be guarded against cyberattacks, as infrastructure “[p]lays an increasingly critical role in providing information to vehicles regarding path planning and obstruction identification” (Gopalakrishna et al. 2021). If there are any attacks against the vehicles, the resulting submitted data must have integrity.
Two potential cyberattacks that can happen on AV infrastructure involve tampering with the Global Navigation Satellite System (GNSS), which is commonly used by CAVs for localization and route planning. The GNSS could be spoofed where the vehicle is given false positioning (i.e., cause the CAV to behave as though it is driving in another country while it is driving in the United States) or an offset is inserted into the GNSS, causing the vehicle to weave into oncoming traffic or go off-road. Researchers also showed that it is possible to stop the GNSS signal without losing the fix status, causing the vehicle to become unstable. These attacks were completed by researchers using $400 worth of hardware equipment in testing.
Similar to spoofing the GNSS, CAV data have the potential to be spoofed if rigorous verification processes are not in place. CAVs collect a large amount of road data while driving, and
without verification processes in place, there is the potential for cyberattacks to occur by altering or providing false data to the systems; this will cause vehicles to think that major traffic incidents have occurred and trigger warnings, unnecessary reroutes, etc.
Open challenges for infrastructure are as follows:
- Authentication of data from vehicles is needed so that data can be trusted and used to make or guide safety decisions. Overcoming this challenge will require a careful balance of privacy vs. data authenticity.
- Software over the air—not deployed en masse. Systems cannot remain secure for their expected life without the ability to patch vulnerabilities.
- Camouflage must incorporate sensor fusion for verification or validation of both localization estimation and object detection.
Physical Infrastructure Adaptation
Determining how best to adapt infrastructure to support the implementation of CAVs and identify the areas where gaps need to be filled is a challenging subject. The Canadian Standards Association identified several gaps in physical infrastructure standards that need to be addressed for CAVs. The identified gaps include areas like intersections, crosswalks, road surface markings, signals, signage, and road geometry (Kimmel et al. 2021). For instance, at intersections “thus far, CAV standards have focused primarily on the specification between physical infrastructure and road users at intersections”; however, “these specifications do not provide guidelines for developing or testing physical infrastructure components to accommodate CAVs at intersections” (Kimmel et al. 2021). Furthermore, future specifications should consider the unique perception and planning software inherent to CAV operations, as “most specifications assume mostly human drivers” (Kimmel et al. 2021).
FHWA conducted industry-stakeholder interviews to better understand the interaction of CAVs and highway infrastructure and promote collaboration, among other goals. FHWA noted that a highlight from the interviews revealed the sentiment that “there is no silver bullet in infrastructure engineering to dramatically advance AVs.” However, most interviewees felt that the quality and consistency of infrastructure supports CAV implementation (Gopalakrishna et al. 2021). Highlights identified by FHWA during the interview process are as follows:
- Clear lane markings, lighting, and signage are critical.
- Increased reflections from signs are needed.
- Lack of pavement markings is an issue, and the quality of markings is critical.
- IOOs need to follow the Manual on Uniform Traffic Control Devices (MUTCD) guidelines consistently to enable efficient AV operations.
- Safety precautions need to be considered in conjunction with MUTCD guidelines.
- Issues hindering AV implementation include stripe maintenance, potholes, and tree maintenance.
Quality and consistency are even more important in a rapidly changing landscape. For example, the design and capabilities of CAV sensors as well as the emergence of multiple types of sensors (e.g., cameras, radar, and lidar) make it difficult to predict infrastructure needs over a 10-year or longer horizon. Another conclusion based on interview results is that TNCs are more likely to see greater use of CAVs in the near term than the general population (Gopalakrishna et al. 2021).


