Considerations for the Design and Construction of Bonded and Unbonded Post-Tensioned Concrete Bridge Elements (2025)
Chapter: 4 Analytical Investigations
CHAPTER 4
Analytical Investigations
4.1 Introduction
The analytical investigation was conducted to: (1) allow the study of girders in larger scales compared with test specimens, and (2) expand the experimental investigation through parametric analyses. The analytical investigation was performed using computational models validated with test results from the experimental investigation of this study. Various analysis methods were used to analyze beams under flexure, shear, and torsion and are summarized in the following sections.
4.2 Flexural Analysis
4.2.1 Sectional Analysis
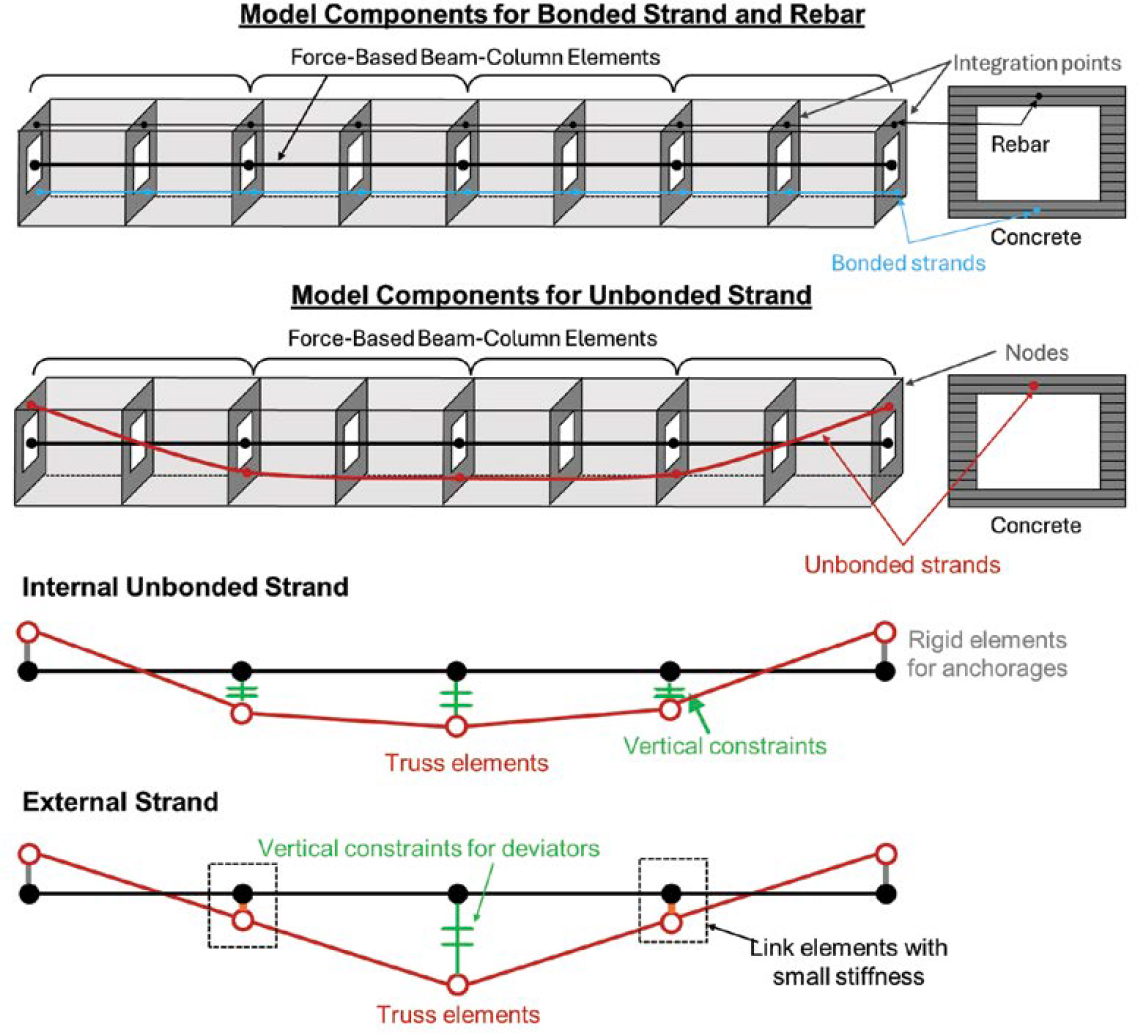
Sectional analysis (SA), based on principles of strain and/or displacement compatibility, was utilized to perform flexural analyses. The analysis can predict the load displacement relationship of the members, failure mode (strand fracture or concrete crushing), and strand stresses and strains during loading. SA was performed using an open-source finite element software, OpenSees (McKenna 2011). Figure 4.1 shows a schematic of the SA models.
The concrete girder was modeled using the Force-based Beam-Column Element from the element library in OpenSees. This beam element consists of several integration points further divided into multi-layers of fibers with assigned concrete material properties. Because bonded strands and nonprestressed reinforcement are strain-compatible with the concrete girder, they were modeled by assigning material properties and areas within the cross section of the beam elements at integration points. Conversely, unbonded strands, including internal and external strands, were modeled using additional truss elements due to lack of strain compatibility. To simulate anchorages and deviation points, rigid elements were used to connect the beam and truss elements, ensuring displacement compatibility of the concrete and strands. For internal unbonded strands, the nodes of the truss elements were vertically constrained to the beam elements so that the elements displaced together. For external strands, the nodes of the truss elements were connected to the beam elements via link elements with negligible axial stiffness to allow free movement with respect to the beam.
The beam response is obtained using an iterative process by incrementally increasing displacement and forming element compatibility at nodes, assuming a predefined force field for the elements with constant axial force and linear moment distribution.
4.2.2 Material Models for SA
4.2.2.1 Concrete
The Concrete02 model from the OpenSees material library was used and is described in Figure 4.2. Concrete compressive strength, f′c, was based on material testing from the experimental
investigation. The modulus of elasticity, Ec, was calculated using the equation, Ec = 57,000√f′c (psi), according to ACI 318-19. The pre-peak stress-strain curve in compression including concrete compressive strain corresponding to the compressive strength, εc, was based on the Kent-Scott-Park concrete model (Scott et al. 1982). The post-peak response in compression was assumed to be bi-linear and was defined so that the crushing energy, Gc, remains constant at 0.024f′c (lb/in. where f′c is in psi) based on validation models. Concrete compressive strain corresponding to 20% of the compressive strength after the peak stress, ε20, was selected by varying the length of beam elements between integration points, LIP, to ensure constant crushing energy release (Pugh et al. 2015).

For concrete in tension, the tensile strength of concrete, ft, was assigned to be the modulus of rupture, fr = 7.5√f′c (psi), calculated according to ACI 318-19, and the modulus of elasticity in tension was assumed to be the same as the modulus of elasticity in compression. The tension softening stiffness, Ets, was calculated from Gf =264f′c0.18 (lb/in.) determined per the fib model code (Fédération internationale du béton 2013), and LIP selected to keep the crushing energy in compression constant.
4.2.2.2 Prestressing Strand
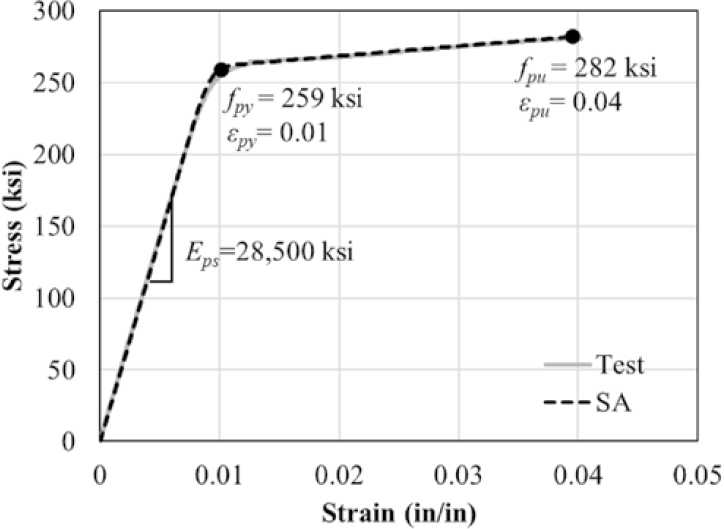
The Steel4 model from the OpenSees material library was used to model prestressing strands as shown in Figure 4.3. The model was nonlinear and refined based on tensile testing of strands from the experimental investigation. The yield strength, fpy, and corresponding strain of the strands were selected to be 259 ksi and 1%, respectively, to match the shape of the stress-strain curve obtained from testing. The modulus of elasticity for the prestressing strand, Eps, the ultimate strength, fpu, and the ultimate strain based on tensile testing were 28,500 ksi, 282 ksi, and 4%, respectively. Prestressing was introduced to pretensioned and post-tensioned strands as initial stress using the -init parameter in the Steel4 model.
4.2.2.3 Mild Reinforcement
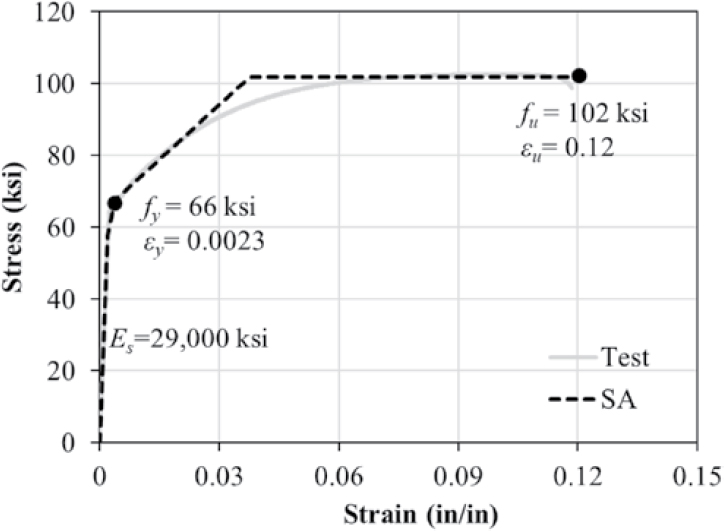
Figure 4.4 presents the Steel4 material model of OpenSees used for modeling longitudinal mild reinforcement. The yield strength, fpy, yield strain, εy, ultimate strength, fu, and ultimate strain, εu, were taken as 66 ksi, 0.23%, 102 ksi, and 12%, respectively, based on average values from stress-strain curves obtained from multiple tensile tests performed as part of the experimental investigation. The modulus of elasticity, Es, was assumed to be 29,000 ksi.
4.2.3 Validation of Modeling Techniques for SA
SA models for flexure were validated using test data from the experimental investigation. Test Specimens IU-12, IU-13, IBU-8, IBU-9, IBU-10, IBE-4, and IEU-4 were used for validation. Test data used to validate SA models included the load displacement relationship, initial stiffness, load and displacement at ultimate strength of the girder, fps for post-tensioned strands, the relationship between stress in the post-tensioned strands and the girder displacement at midspan, and failure mode.
Analysis inputs are provided in Table 4.1. Two batches of concrete from two concrete trucks were used to fabricate Specimens IBE-4 and IEU-4. To model these specimens, the compressive strength of the batch used in the top portion of the specimens was used. When modeling specimens where unbonded strand fractured at the anchorage during testing, the ultimate strain of the strand was taken to be equal to the fracture strain measured by strain gauges during the tests. For Specimen IU-12, the measured fracture strain was unavailable due to lost strain gauges. Therefore, the ultimate strain of unbonded strand in the girder was chosen such that the simulated displacement capacity matched the displacement capacity measured during testing.
The experimental load displacement curves for Specimens IU-12, IU-13, IBU-8, IBU-9, IBU-10, IBE-4, and IEU-4 are compared to the SA model results in Figure 4.5. A detailed comparison of the results is provided in Table 4.2. Figure 4.5 and Table 4.2 indicate that the maximum load was slightly overpredicted by SA for IU specimens but was predicted well for IBU, IBE, and IEU specimens. Although SA overpredicted the initial stiffness, the post-cracking stiffness was predicted reasonably well for all girders. The displacement at the maximum load was significantly overestimated for Specimen IBU-10, underpredicted for Specimen IBU-9, and was underpredicted to a lesser extent for the other specimens. In general, failure modes predicted
Table 4.1. Model inputs for validation cases.
| Spec. No. | Concrete | Post-Tensioned Strand | Pretensioned Strand | Mild Reinforcement | ||||||||||||
|---|---|---|---|---|---|---|---|---|---|---|---|---|---|---|---|---|
| f’c (ksi) | fpy (ksi) | Eps (ksi) | ɛpy (%) | ɛpu (%) | fpe | fpy (ksi) | E (ksi) | ɛpy (%) | ɛpu (%) | fpe (ksi) | fy (ksi) | E (ksi) | ɛy (%) | ɛu (%) | ||
| BF (ksi) | EX (ksi) | |||||||||||||||
| IU-12 | 10.7 | 259 | 28,500 | 1 | 0.89* | 155 | - | - | 66 | 29,000 | 0.2 | 12 | ||||
| IU-13 | 10.5 | 259 | 28,500 | 1 | 0.95* | 163 | - | - | 66 | 29,000 | 0.2 | 12 | ||||
| IBU-8 | 9.0 | 259 | 28,500 | 1 | 0.86* | 152 | - | 259 | 28,500 | 1 | 4 | 175 | 66 | 29,000 | 0.2 | 12 |
| IBU-9 | 10.6 | 259 | 28,500 | 1 | 0.90* | 172 | - | 259 | 28,500 | 1 | 4 | 157 | 66 | 29,000 | 0.2 | 12 |
| IBU-10 | 9.4 | 259 | 28,500 | 1 | 4 | 152 | - | 259 | 28,500 | 1 | 4 | 161 | 66 | 29,000 | 0.2 | 12 |
| IBE-4 | 9.2 | 259 | 28,500 | 1 | 0.86* | 144 | 155 | - | 66 | 29,000 | 0.2 | 12 | ||||
| IEU-4 | 9.3 | 259 | 28,500 | 1 | 4 | 142 | 165 | - | 66 | 29,000 | 0.2 | 12 | ||||
Notes: BF = Bottom flange strand, EX = External strand
*Post-tensioned strands fractured at anchorages during testing

Table 4.2. Comparison of initial stiffness, maximum load, displacement at maximum load, and failure mode from tests and SA.
| Spec. No. | Initial Stiffness | Pmax | ∆ at Pmax | Failure Mode | |||||||
|---|---|---|---|---|---|---|---|---|---|---|---|
| Test (kip/in.) | SA (kip/in.) | SA / Test | Test (kip) | SA (kip) | SA / Test | Test (in.) | SA (in.) | SA / Test | Test | SA | |
| IU-12 | 215 | 277 | 1.29 | 131 | 139 | 1.06 | 4.0 | 4.0 | 0.99 | Post -Tensioned Strand Fracture | Post -Tensioned Strand Fracture |
| IU-13 | 206 | 274 | 1.33 | 109 | 117 | 1.08 | 4.7 | 4.3 | 0.92 | Post -Tensioned Strand Fracture | Post -Tensioned Strand Fracture |
| IBU -8 | 216 | 256 | 1.19 | 120 | 116 | 0.97 | 3.7 | 3.6 | 0.96 | Post -Tensioned Strand Fracture | Post -Tensioned Strand Fracture |
| IBU -9 | 230 | 277 | 1.20 | 117 | 116 | 0.99 | 4.5 | 3.2 | 0.72 | Post -Tensioned Strand Fracture | Post -Tensioned Strand Fracture |
| IBU -10 | 210 | 259 | 1.23 | 117 | 122 | 1.04 | 4.0 | 8.4 | 2.08 | Pretensioned Strand Fracture | Pretensioned Strand Fracture |
| IBE -4 | 342 | 424 | 1.24 | 142 | 137 | 0.97 | 6.0 | 4.6 | 0.76 | Post -Tensioned Strand Fracture | Post -Tensioned Strand Fracture |
| IEU -4 | 327 | 422 | 1.29 | 125 | 122 | 0.98 | 4.5 | 3.7 | 0.82 | Concrete Crushing | Concrete Crushing |
| Average | 1.25 | 1.01 | 1.04 | ||||||||
by SA were consistent with the failure modes observed during testing. The average ratios of the values of the initial stiffness, maximum load, and displacement at the maximum load predicted by SA to the values from the tests were 1.25, 1.01, and 1.04, respectively.
The measured post-tensioned strand stress-displacement relationships are compared to those from the SA models in Figure 4.6. Tendons shown in red in the cross sections correspond to the strands for which stress measurements (calculated from measured strains) were available. Measured strand stress for Specimen IU-12 is not shown for girder displacements greater than 1.5 in. due to gauges lost during testing. In general, strand stresses were predicted well by SA. The comparison of fps from tests and SA is presented in Table 4.3, with the SA-to-test-value ratios highlighted in green. The average of the ratios of the fps values predicted by SA to those measured were 1.04 and 1.02 for the internal and external strands, respectively.
4.2.4 Parametric Analysis
4.2.4.1 Description of Girders Used for Parametric Analysis
SA models were used to perform parametric analysis using the cross sections of girders presented in Figure 4.7. The bulb tee and U-shaped girders correspond to AASHTO Type IV (PCI 2023) and Washington DOT U78G5 girders (Washington State Department of Transportation 2023). The web thickness of these sections was modified to 10 in. to enable post-tensioning duct placement as consistent with practice. The girders were modeled with composite decks. Simply supported and two-span continuous girders were analyzed. All bonded and unbonded strands were lumped at their respective centroids. The distance from the top fiber of the deck to the strands, dps, was kept constant regardless of strand bond and location type (internal bonded, internal unbonded, and external) to directly compare the analysis results for various girder cases. The values of dps at midspan for bulb tee and U-shaped girder models were 75 in. and 82 in., respectively. The values of dps at the interior support for continuous bulb tee and U-shaped girder models were 69 in. and 73 in., respectively, so that the strands were located inside the girders with a concrete cover of 3 in. Continuous girder models contained deck longitudinal reinforcement consisting of two layers of No. 3 rebars spaced at 4 in. across the deck width with a concrete cover of 2 in. to provide sufficient flexural strength over the interior support.
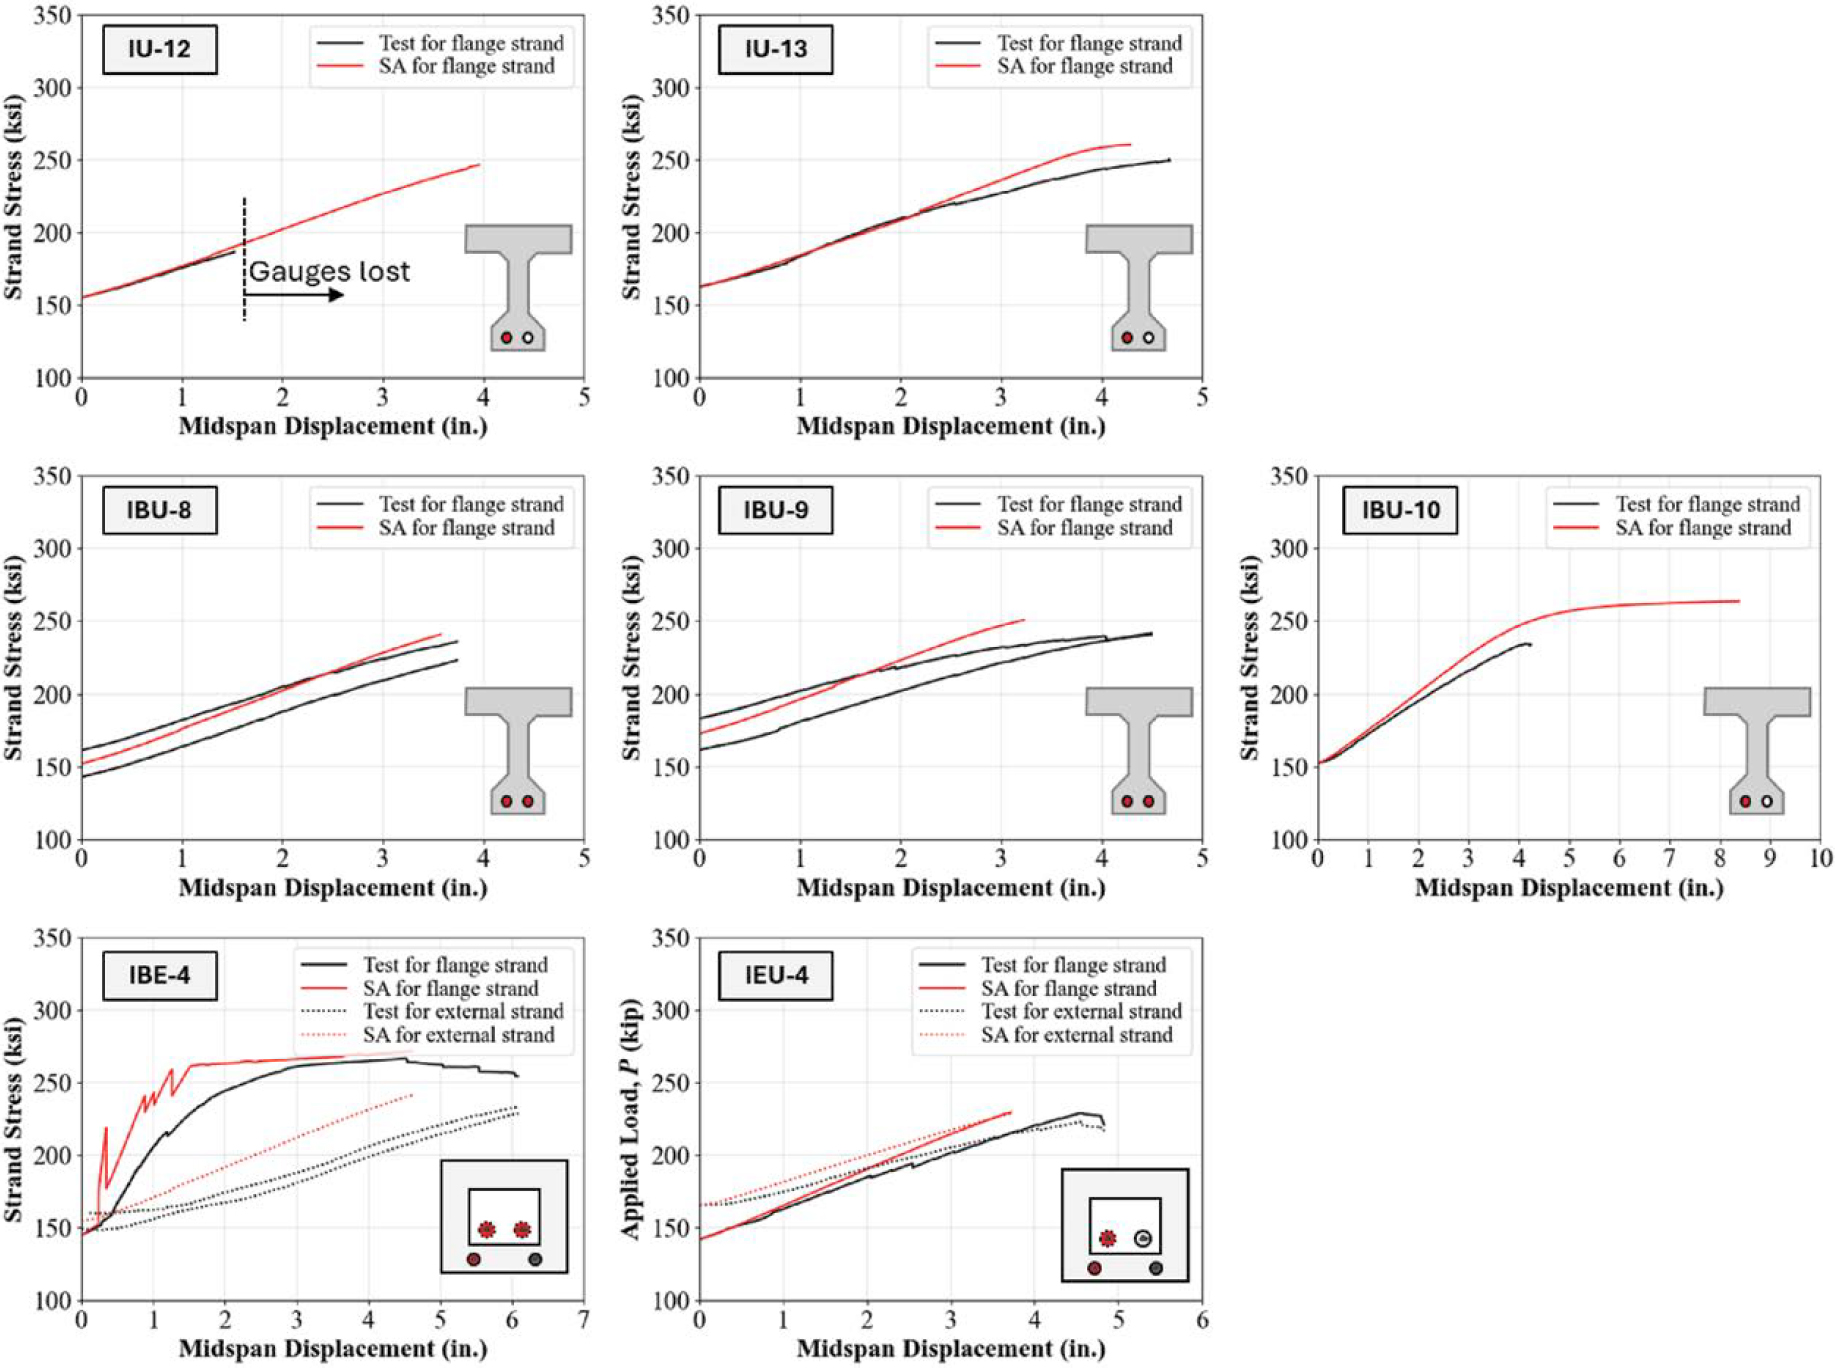
Table 4.3. Detailed comparison of fps of post-tensioned strands.
| Spec. No. | fps | |||||
|---|---|---|---|---|---|---|
| Bottom Flange Strands | External Strands | |||||
| Test (ksi) | SA (ksi) | SA / Test | Test (ksi) | SA (ksi) | SA / Test | |
| IU-12 | n/a | 247 | - | - | - | - |
| IU-13 | 251 | 260 | 1.04 | - | - | - |
| IBU-8 | 236 | 241 | 1.02 | - | - | - |
| IBU-9 | 242 | 251 | 1.04 | - | - | - |
| IBU-10 | 234 | 264 | 1.13 | - | - | - |
| IBE-4 | 266 | 271 | 1.02 | 233 | 241 | 1.03 |
| IEU-4 | 229 | 227 | 0.99 | 223 | 226 | 1.01 |
| Average | 1.04 | 1.02 | ||||
n/a: not available
4.2.4.2 Parameters
The parametric analysis matrix for simply supported girders is provided in Table 4.4. Variables in the nested tables were changed one at a time, and the gray-shaded cells indicate the variables that remain constant. The IB, IU, IBU, IBE, and IEU cases were created and analyzed with a point load applied at midspan. Additionally, one model was created for each of the IB, IU, and IBU groups to be analyzed with two-point loads, creating a constant moment region of one-quarter of the span length. The parameters included span length (80–140 ft), strand profile (internal strands: straight vs. parabolic and external strands: straight vs. one-point harped vs. two-point harped), girder concrete strength (8 ksi vs. 15 ksi), total strand area, Aps, (7.81–11.72 in.2), and bonded strand area to total strand area ratio (0–100%). It is noted that IU and IEU specimens included various amounts of mild reinforcement, resulting in bonded reinforcement area to total reinforcement area ratio of 0 to 0.5. The total number of simply supported cases was 69.
The parametric analysis matrix for continuous girders is provided in Table 4.5. Variables in the nested tables were changed one at a time, and the gray shaded cells indicate the variables that remain constant. The beams were analyzed with point loads applied at midspan of each girder span. The parameters for continuous girder cases included bonded strand area to total strand area ratio (0–100%). The total number of continuous cases was 12. In total, 81 analyses were performed (simply supported and continuous).
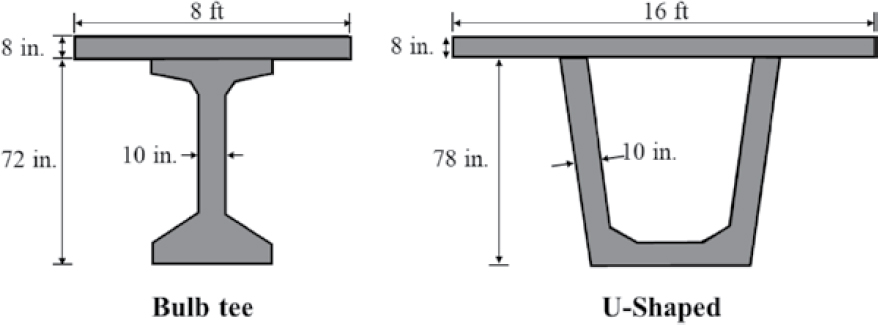
Table 4.4. Parametric analysis matrix for simply supported girders.

Aps: total strand area, Apsb: bonded strand area, As: nonprestressed mild reinforcement area, Act: girder cross-sectional area between extreme tension fiber and centroid of section
Abbreviations: Str.: Straight, Dr.: Draped, H1: Harped with one hold down at midspan, H2: Harped with two hold downs at third points along span
*Strand profile is for unbonded strands
Table 4.5. Parametric analysis matrix for continuous girders.

Aps: total strand area, Apsb: bonded strand area, As: nonprestressed mild reinforcement area, Act: girder cross section area between extreme tension fiber and centroid of section
Abbreviations: Dr.: Draped, H1: Harped with one hold down at midspan, H2: Harped with two hold downs at third points along span
4.2.4.3 Model Inputs for Flexural Analyses
The material model inputs and input sources for the analysis cases are summarized in Table 4.6. The definitions of the parameters are consistent with the material models previously described and used for model validation. For simply supported girders, the concrete tensile strength was neglected. For continuous girders, the concrete tensile strengths for the girders and deck were taken as the modulus of rupture [fr = 7.5√f′c (psi)] calculated according to ACI 318-19 (2019). The material properties of the prestressing strand and mild reinforcement were based on material testing from the experimental investigation.
4.2.4.4 Flexural Analysis Results
The influence of the various parameters on flexural strength and on fps for bonded, unbonded, and external strands was evaluated. When determining flexural capacities by SA, the crushing strains of the girder and deck concrete were assumed to be 0.003 and 0.004, respectively, and were defined as the strain at which concrete loses approximately 10% of its strength.
4.2.4.4.1 Simply Supported Girders
Flexural capacities reported for the simply supported girders were obtained from SA at the location of failure (midspan).
Table 4.6. Model inputs and input sources for flexural cases with concrete compressive strengths of 8 ksi and 15 ksi.
| SA Input | Girder Concrete | Deck Concrete | Post-Tensioned Strand | Mild Reinforcement | |||||||||||||||
|---|---|---|---|---|---|---|---|---|---|---|---|---|---|---|---|---|---|---|---|
| f’c (ksi) | Ec (ksi) | ft (psi) | ɛc (%) | ɛ20 (%) | f′c (ksi) | Ec (ksi) | ft (psi) | ɛc (%) | ɛ20 (%) | fpy (ksi) | Ep (ksi) | fpu (ksi) | ɛpy (%) | ɛpu (%) | fy (ksi) | fu (ksi) | Es (ksi) | ɛy (%) | |
| S.S. | 8 | 5,098 | 0 | 0.31 | 0.66 | 4 | 3,605 | 0 | 0.2 | 0.55 | 259 | 28,500 | 282 | 0.9 | 4.0 | 66 | 102 | 29,000 | 12 |
| 15 | 6,981 | 0 | 0.43 | 0.79 | 4 | 3,605 | 0 | 0.2 | 0.55 | 259 | 28,500 | 282 | 0.9 | 4.0 | 66 | 102 | 29,000 | 12 | |
| Cont. | 8 | 5,098 | 671 | 0.31 | 0.66 | 4 | 3,605 | 474 | 0.2 | 0.55 | 259 | 28,500 | 282 | 0.9 | 4.0 | 66 | 102 | 29,000 | 12 |
| Source | Design strength | ACI (2019) | - | Scott et al. (1982) | Pugh et al. (2015) | Design strength | ACI (2019) | Scott et al. (1982) | Pugh et al. (2015) | Test | Test | ||||||||
Abbreviations: S.S: Simply supported, Cont.: Continuous
4.2.4.4.1.1 Impact of Girder Concrete Strength
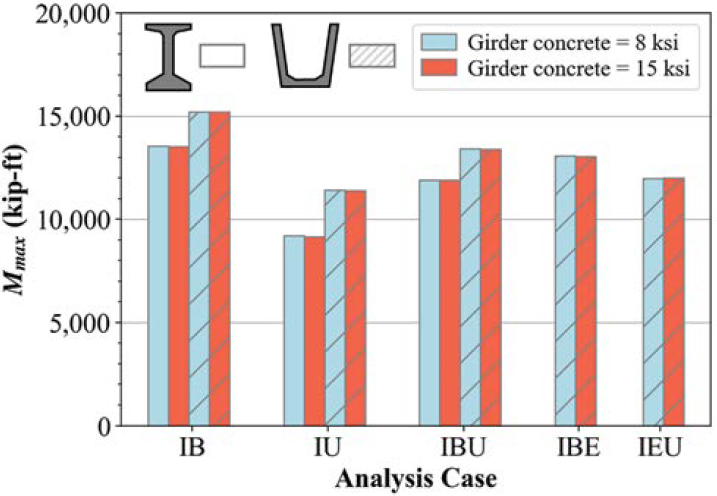
Figure 4.8 compares flexural capacities with 8-ksi and 15-ksi girder concrete compressive strengths. The compressive strength of deck concrete in all cases was 4 ksi. The compressive strength of the girder concrete had essentially no impact on flexural strength. This result is due to the fact that the neutral axis at midspan was in the deck regardless of the compressive strength of girder concrete.
4.2.4.4.1.2 Impact of Strand Profile
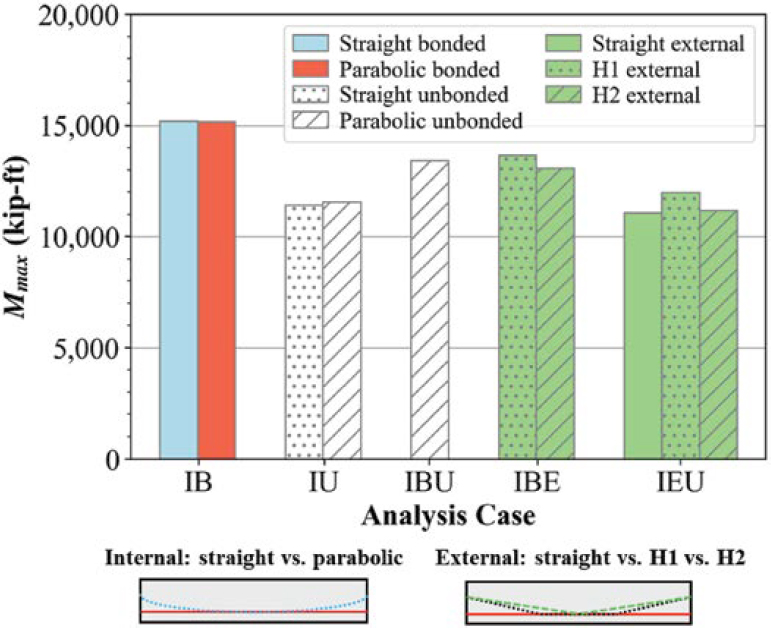
Figure 4.9 compares flexural capacities with varying strand profiles for IB, IU, IBU, IBE, and IEU cases. For IBU and IBE cases, bonded strands were straight. For IEU girder cases, internal unbonded strands were straight. Only the results of the U-shaped cases are shown here.
As shown, the strand profile had a negligible impact on the flexure capacities of IB and IU cases. External strands with two hold down points (H2) resulted in a slightly smaller flexural capacity than for one hold down point (H1) for IBE and IEU cases. The flexural capacity of the IEU case with straight external strands was similar to that with two hold down points (H2). These small changes are attributed to the smaller eccentricity of straight or H2 profiles with respect to the deformed shape of the girders under loading as compared to H1 profiles.
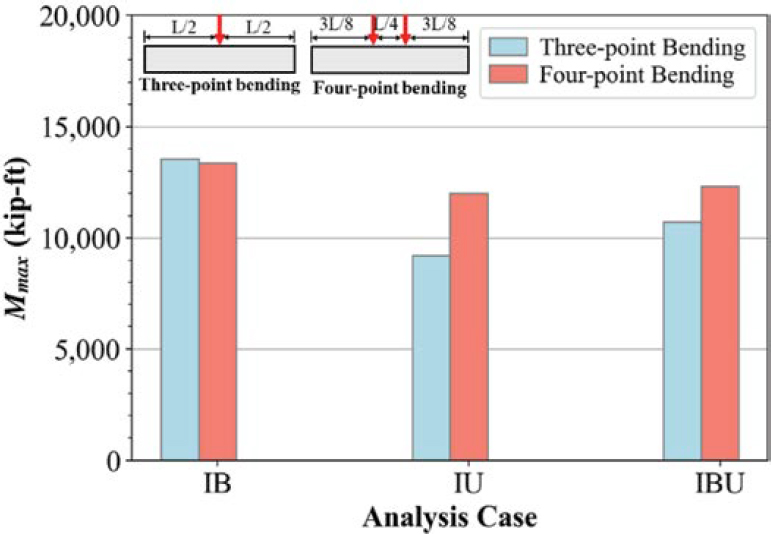
4.2.4.4.1.3 Impact of Loading Type
The impact of loading type (one or two load points along the span) was investigated using IB, IU, and IBU cases as shown in Figure 4.10. Cases with one load point had the load applied at midspan. Cases with two load points created a constant moment region for a quarter of the span length consistent with the experimental investigation. Flexural capacities of IB cases were nearly identical, with a 1% variation. In contrast, load points significantly increased the capacities of IU and IBU cases. An increase in the length of the constant moment region from zero to one-quarter of the span length resulted in 30% and 15% increases in the capacity of IU and IBU girder cases, respectively.
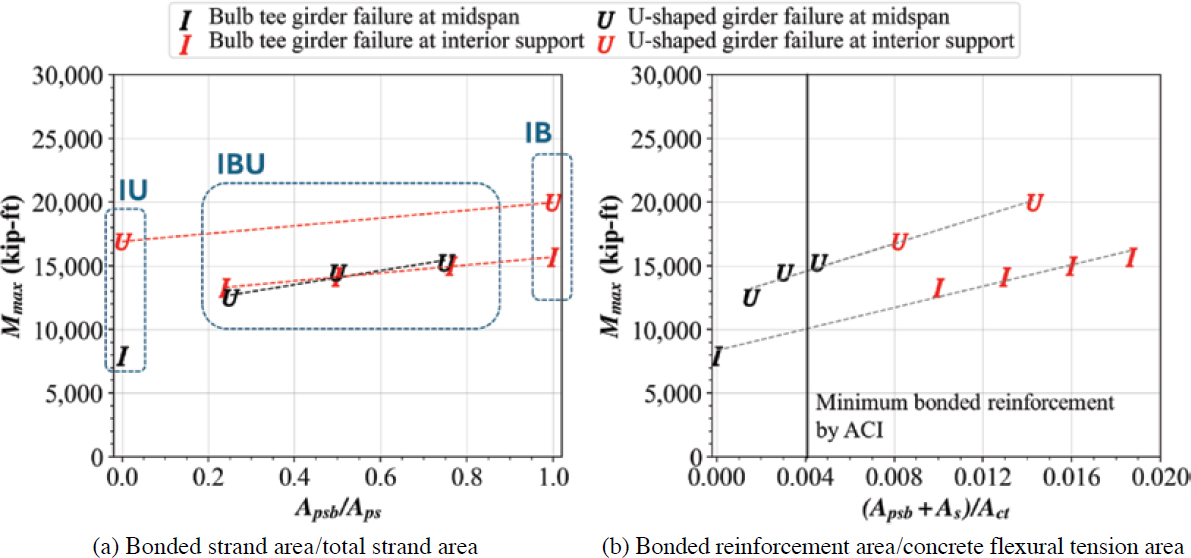
4.2.4.4.1.4 Impact of Bonded Strand Area
Figure 4.11 presents the relationship between the flexural capacity and the bonded strand area (Apsb). I- and U-shaped markers represent bulb tee and U-shaped cross sections, respectively. IBE cases are not shown because their flexural capacities were very similar to IBU cases. Similarly, IEU cases are not shown due to the similarity of their flexural capacity to IU cases. Figure 4.11(a)

shows how the flexural capacity changes with the ratio of bonded strand area to total strand area (Apsb/Aps). There is a strong linear correlation between Apsb/Aps and flexural capacity as shown by the dashed linear regression lines. It should be noted that the IU cases shown in Figure 4.11 do not include mild reinforcement.
Figure 4.11(b) presents the same results in a normalized manner. The flexural capacity was normalized by the capacity of the respective IU cases (Apsb/Aps = 0) for each girder cross section and span length. The horizontal axis is the ratio of bonded strand area to the concrete flexural tension area (Apsb/Act). The flexural tensile area is defined as the girder cross section area between the extreme tension fiber and the centroid of the section. A single regression line is presented for all normalized cases in Figure 4.11(b). When the values of Apsb/Act increased from 0 to 0.011, the capacities increased by 47%. For the larger values of Apsb/Act (approximately > 0.011), changes in capacity were insignificant.
4.2.4.4.2 Continuous Girders
Flexural capacities reported for the continuous girders were obtained from SA at the location of failure predicted by SA (midspan vs. interior support).
4.2.4.4.2.1 Impact of Bonded Reinforcement
Figure 4.12(a) shows the relationship between the flexural capacity and the ratios of bonded strand area to total strand area (Apsb/Aps). I- and U-shaped markers represent bulb tee and U-shaped cross sections, respectively. Red and black colors indicate the failure location predicted by SA. The capacity increased linearly with increasing Apsb/Aps.
Figure 4.12(b) presents the relationship between the flexural capacity and the ratio of bonded reinforcement to the concrete flexural tension area [(Apsb + As)/Act]. The bonded reinforcement included prestressing strands and nonprestressed mild reinforcement to consider the presence of longitudinal deck reinforcement when failure occurred at the interior supports due to negative moment. For U-shaped girders, increasing (Apsb + As)/Act from 0.0015 to 0.014 led to a 60% increase in capacity. For I-shaped girders, increasing (Apsb + As)/Act from 0 to 0.019 led to a 97% increase in capacity. The capacity increased approximately linearly with respect to (Apsb + As)/Act regardless of the failure location.
4.2.4.5 Comparison of Flexural Analysis Results with AASHTO LRFD
Figure 4.13 compares stresses in bonded strands at nominal flexural capacity, fpsb, as calculated by the LRFD BDS (AASHTO 2020) and as predicted by SA. The 45-degree line indicates a perfect correlation between the LRFD BDS and SA. Cases that have bonded strands (IB, IBU, and IBE)
are presented. Equation 4.1 was used when calculating fpsb according to the LRFD BDS. With SA, fpsb predictions were obtained at the location of maximum moment. Figure 4.13 shows that the LRFD BDS predicted fpsb well.
| Equation 4.1 |
where:
| fpsb = | stresses in bonded strands at nominal flexural capacity |
| fpu = | specified tensile strength of prestressing steel (ksi) |
| k = | |
| fpy = | yield strength of prestressing steel |
| c = | distance from the extreme compression fiber to the neutral axis (in.) |
| dp = | distance from extreme compression fiber to the centroid of the prestressing force (in.) |

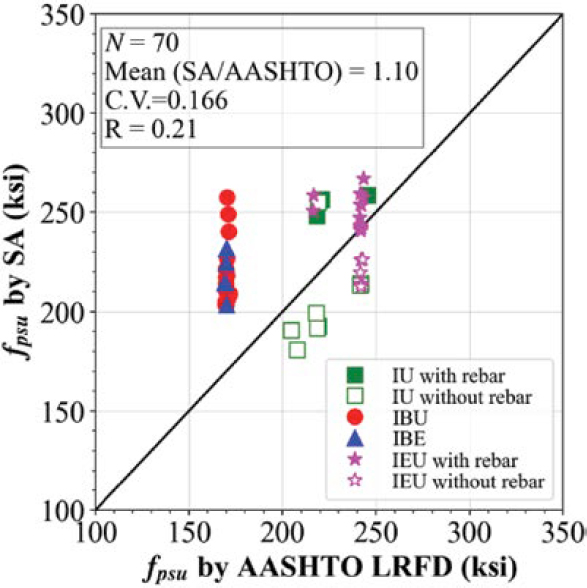
Figure 4.14 compares stresses in unbonded strands at nominal flexural capacity, fpsu, as calculated by the LRFD BDS (AASHTO 2020) and as predicted by SA. Cases that have unbonded strands (IU, IBU, IBE, and IEU) are presented. For the LRFD BDS, Equation 4.2 was used to calculate fpsu for the IU cases and the IU cases with rebar. For IBU and IEU cases, fpsu was determined as the effective prestress, fpe, consistent with the LRFD BDS. For predictions with SA, fpsu was obtained at the location of maximum moment.
Figure 4.14 indicates that the LRFD BDS (AASHTO 2020) significantly underestimate fpsu for IBU and IBE cases (above the 45-degree line) because the LRFD BDS assumes fpe for unbonded strands when they are used with bonded strands. Furthermore, estimations of fpsu by the LRFD BDS were conservative for girders with unbonded strands and mild reinforcement (IU with rebar and IEU with rebar) as shown above the 45-degree line. However, for girders without rebar (IU and IEU cases), the LRFD BDS overestimated fpsu (below the 45-degree line) except for the case corresponding to a girder that was loaded with two point loads.
| Equation 4.2 |
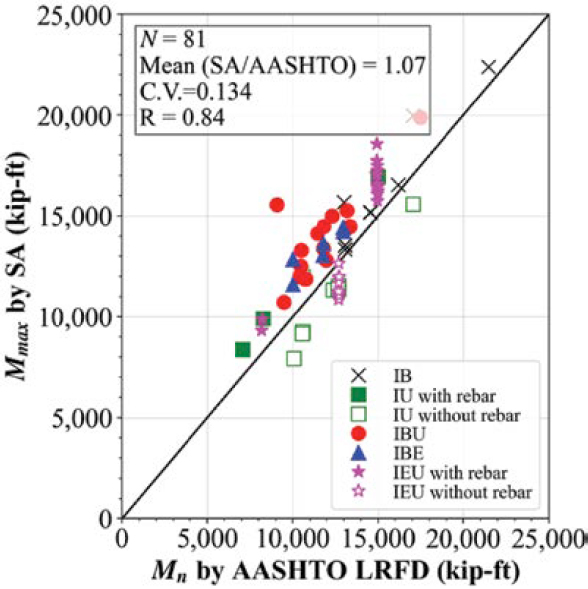
Figure 4.15 shows a comparison of the flexural capacities calculated according to the LRFD BDS (AASHTO 2020) and obtained from SA for all cases. The strengths calculated according to the LRFD BDS for the IB, IBU, and IBE girder cases are conservative (above the 45-degree line). In addition, the strengths calculated according to the LRFD BDS for girders containing unbonded strands and mild reinforcement (IU with rebar, and IEU with rebar cases) are conservative. However, the strengths calculated according to the specifications for girders with unbonded strands and no bonded reinforcement (IU and IEU cases) were unconservative (below the 45-degree line).
4.2.4.6 Flexural Analysis Conclusions
The following are the conclusions from the analytical investigation for flexure:
- Bonded strands only: The LRFD BDS (AASHTO 2020) estimate bonded strand stress and flexural capacity well.
- Unbonded strands only: The LRFD BDS (AASHTO 2020) provide unconservative estimates of strand stress and flexural capacity for girders without a constant moment region (three-point bending). When mild reinforcement is added, the flexural capacity linearly increases with the ratio of the mild reinforcement area to the concrete flexural tension area, Act. For these cases, the LRFD BDS (AASHTO 2020) conservatively predicted strand stress and flexural capacity.
- Bonded and unbonded strands: The flexural capacity linearly increases with the amount of bonded reinforcement. The LRFD BDS (AASHTO 2020) assume unbonded strand stress does not increase at ultimate, resulting in conservative flexural capacity predictions.
4.3 Shear Analysis
4.3.1 MCFT-Based Analysis
The shear design provisions of the AASHTO LRFD Bridge Design Specification (2020) for B-regions are derived from the MCFT (Vecchio and Collins 1986). The finite element software, VecTor2 (Wong et al. 2002), which is based on MCFT and the distributed stress field model (Vecchio 2000), was employed to perform shear analyses. A schematic of the modeling techniques used for MCFT-based analysis (MCFTA) is presented in Figure 4.16.
Girder concrete was modeled using four-node plane stress elements. Transverse and longitudinal mild reinforcement were modeled as smeared reinforcement. Bonded and unbonded prestressing strands were modeled using truss elements. For bonded strands, the nodes of the strands were tied to the nodes of the surrounding concrete, simulating perfect bond. For internal unbonded strands, truss elements were tied to concrete at anchorage points. In between anchorages, the nodes of the truss element were connected to the nodes of the surrounding concrete through very stiff normal and flexible tangential link elements that provide displacement compatibility between strands and the adjacent concrete without bond. External strands were modeled using the same modeling approach as the internal unbonded strands.
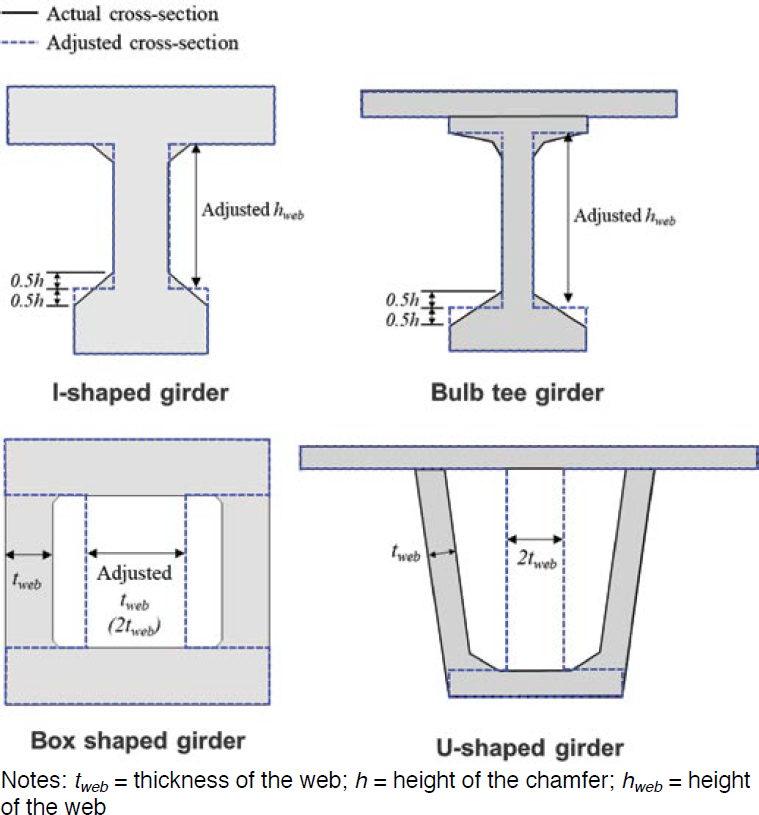
VecTor2 is a two-dimensional finite element software, where beams are modeled with shell elements along the length. The girder cross section is discretized along the height to allow varying thickness for the shell elements. For both grouted and ungrouted ducts in the web, the web
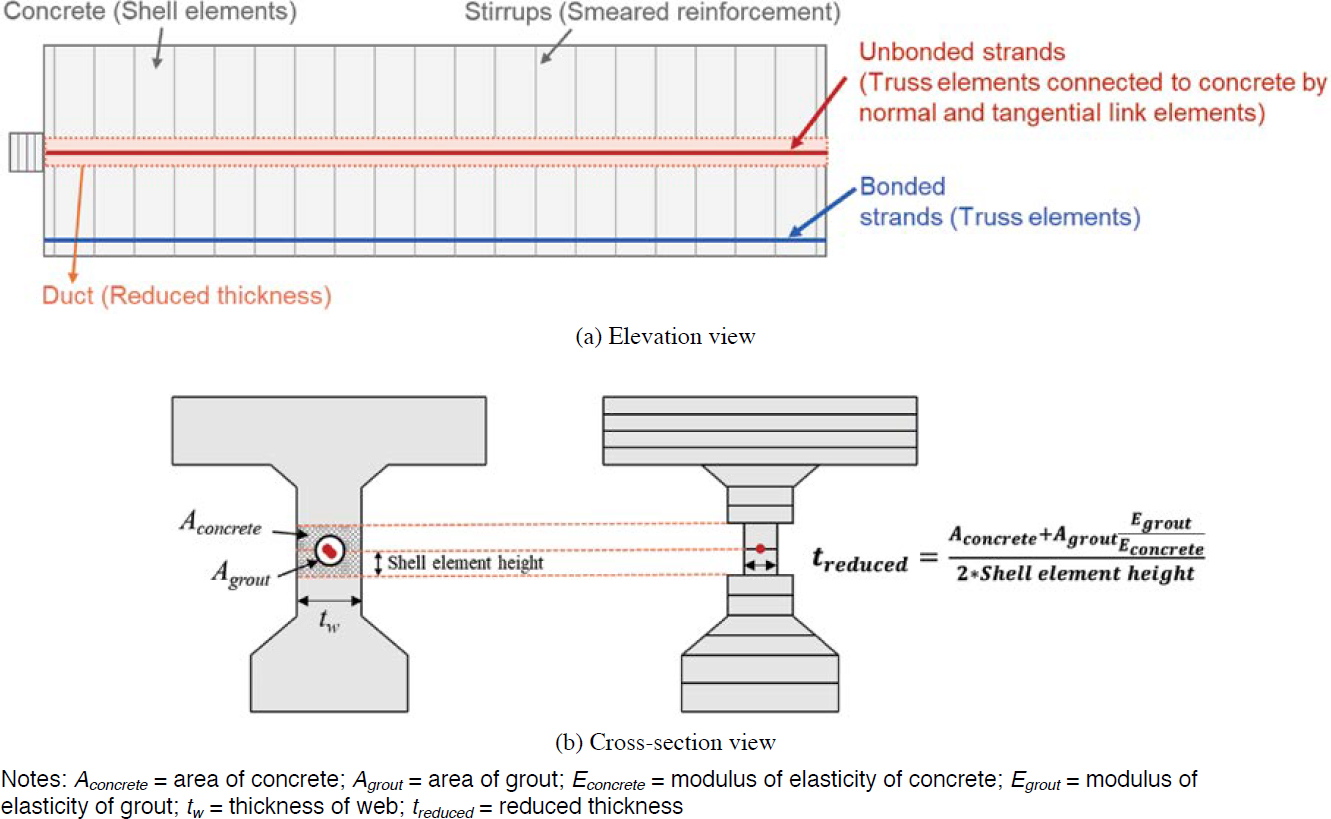
thickness at the duct location was reduced to simulate the effects of ducts as shown in Figure 4.16(b). For grouted ducts, the web thickness at the duct was set equal to the ratio of the sum of the area of concrete and grout transformed into equivalent concrete to the height of the two shell elements around the ducts. For ungrouted ducts, the thickness at the duct location was set equal to the ratio of the area of concrete to the height of two shell elements. When modeling external strands, the web thickness was not reduced.
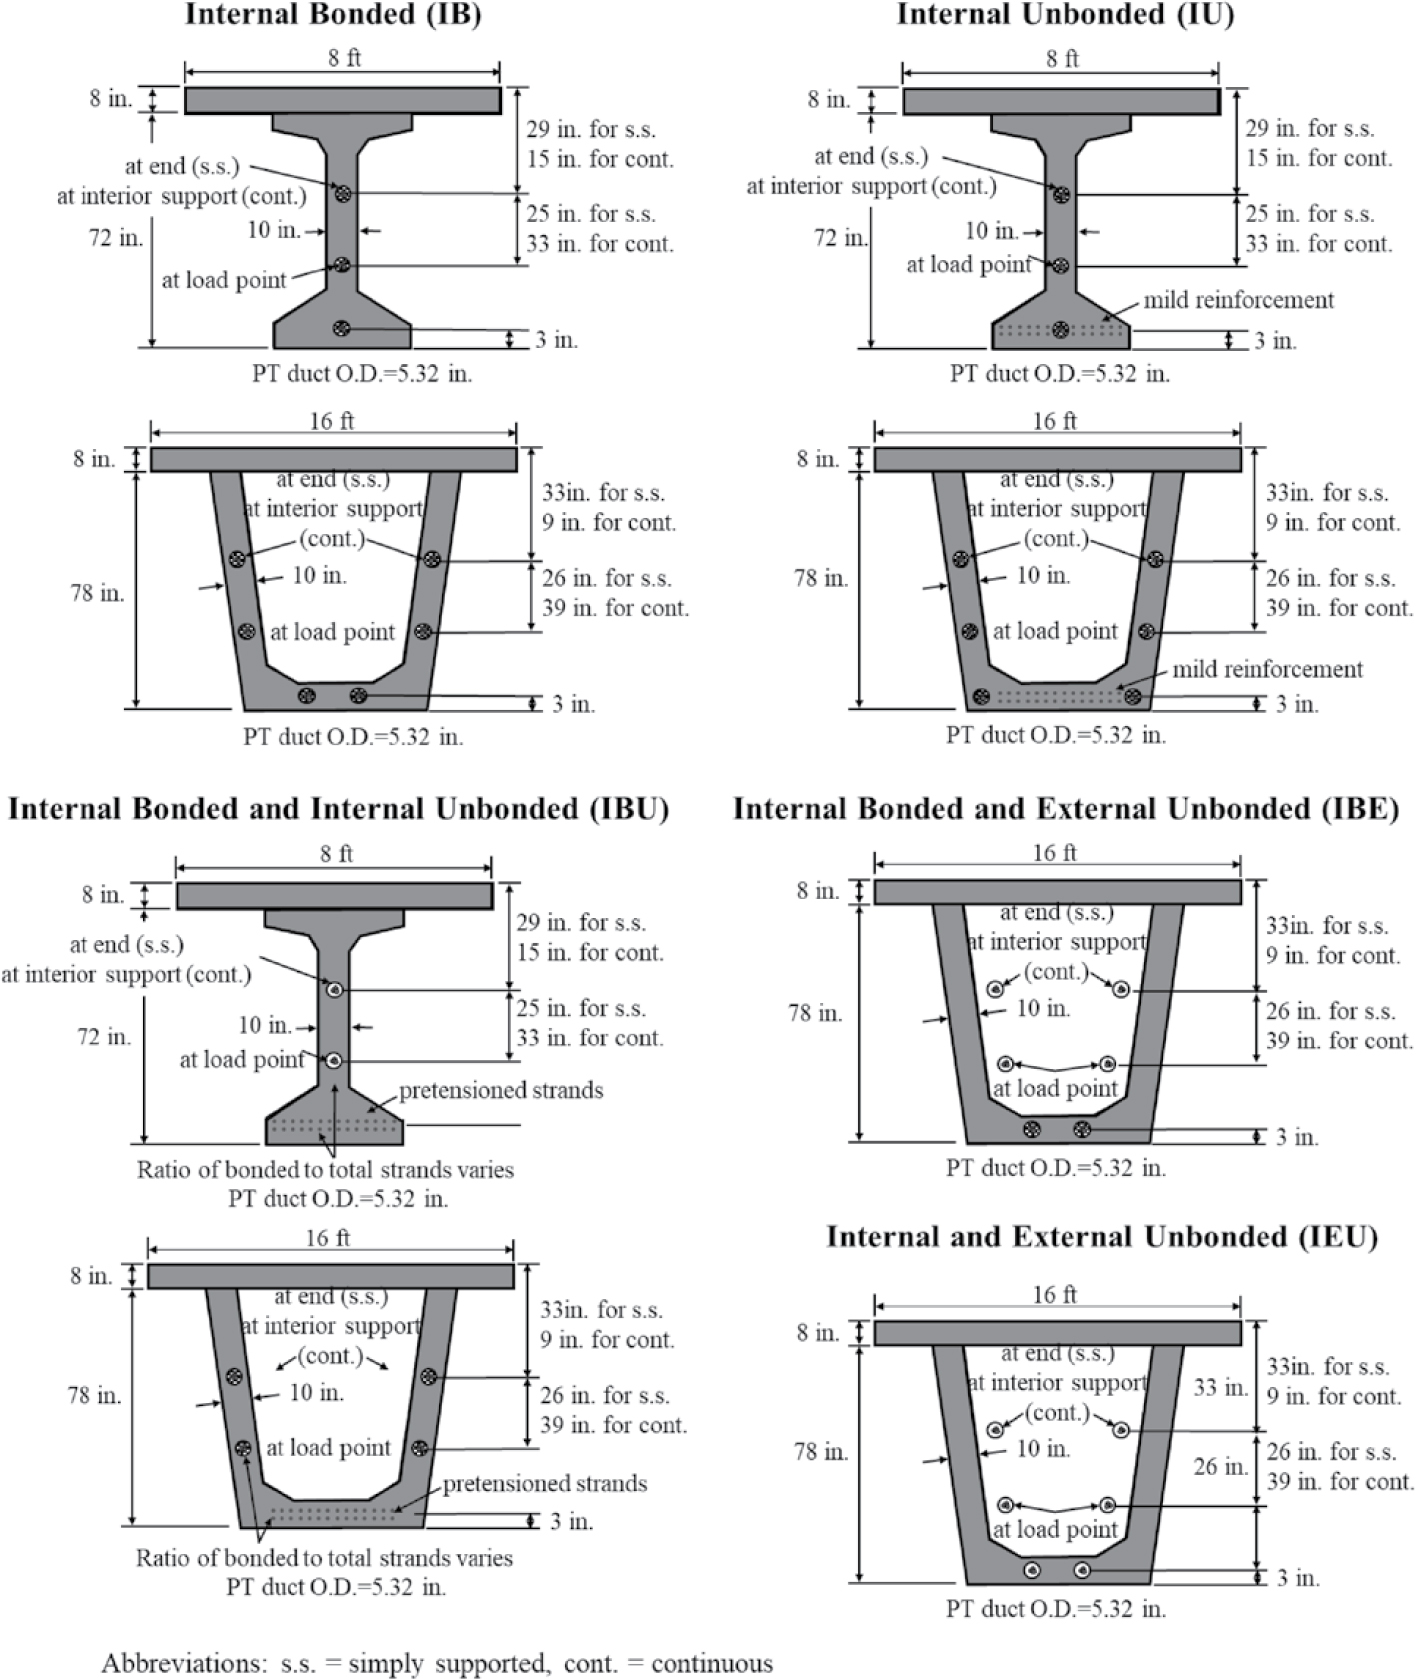
The shear analyses included models of I-shaped and box girders for validation, and bulb tee and U-shaped girders for parametric analysis. The cross sections are idealized as shown in Figure 4.17.
4.3.2 Material Models for MCFTA
4.3.2.1 Concrete
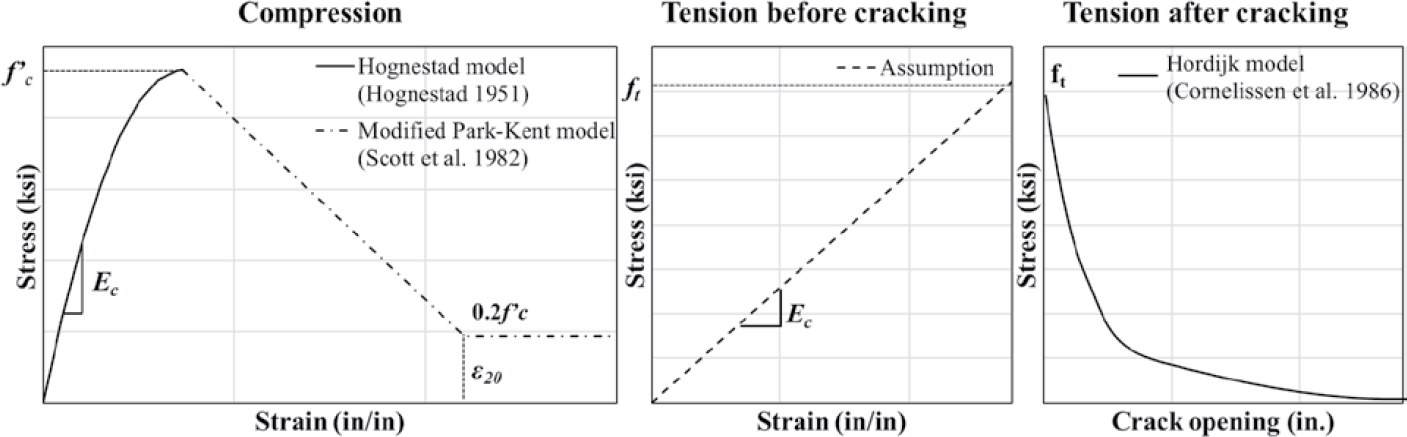
The concrete material model was defined as shown in Figure 4.18. In validation analyses, concrete compressive strength, f′c, was based on material testing from the experimental investigation. In parametric analyses, the value of f′c was assumed to be the design strength. The modulus of elasticity, Ec, was calculated using the equation Ec = 57,000√f′c (psi), according to ACI 318-19 (ACI 2019). The linearly descending branch of the stress-strain curve in compression was dependent on principal stresses. In tension, concrete behavior up to cracking was assumed to be linear with Ec assumed to be the same as Ec in compression. The tensile strength of concrete, ft, was taken as 7.5√f′c (psi). A nonlinear stress-crack opening relationship was used to define concrete tensile behavior after cracking according to the Hordijk model (Cornelissen et al. 1986). Shear slip along cracks was neglected.
4.3.2.2 Prestressing Strand
The Prestressing steel model from the VecTor2 material library was used to model the prestressing strands as shown in Figure 4.19. The model is based on the Ramberg-Osgood formulation
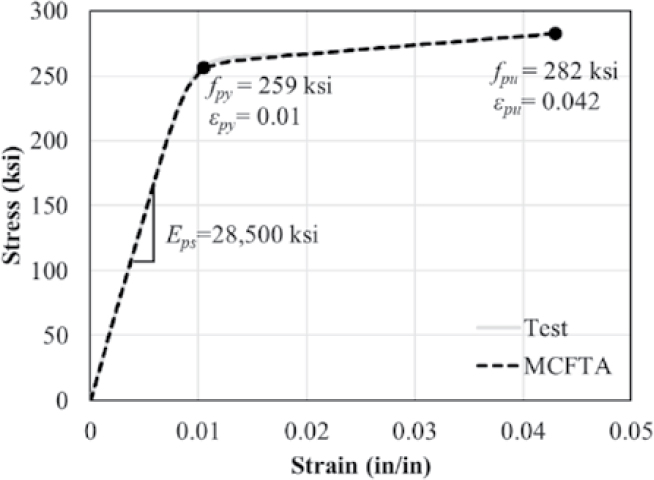
(Ramberg and Osgood 1943) and was refined based on tensile testing of strands from the experimental investigation. The yield strength, fpy, and corresponding strain of the strands were selected to be 259 ksi and 1.0%, respectively, to match the shape of the stress-strain curve obtained from testing. The modulus of elasticity, Eps, the ultimate strength, fpu, and the ultimate strain were 28,500 ksi, 282 ksi, and 4.2%, respectively, based on strand testing. Prestressing was introduced as an initial strain using the Prestrain parameter in the Prestressing steel model.
4.3.2.3 Mild Reinforcement
For modeling shear reinforcement in MCFTA, the stress-strain curves of the mild reinforcement were approximated as multi-linear with strain hardening as shown in Figure 4.20. The yield strength, fy, the yield strain, the ultimate strength, fpu, and the ultimate strain were based on the results of mild reinforcement tensile tests from the experimental investigation.
4.3.3 Validation of Modeling Techniques for MCFTA
MCFTA models for shear were validated using test data from the experimental investigation using results from Specimens IB-0, IB-1, IB-4, IU-4, IBU-1, IBU-2, IBU-3, IBU-4, IBU-5, IBE-1, and IEU-2. Test data used for validation included the load displacement relationship, initial stiffness, shear and flexural cracking loads, load and displacement at ultimate strength, the relationship between the strand stress and the beam displacement at the load point, and crack pattern at failure.
Analysis inputs are provided in Table 4.7. The effective stress, fpe, in the bottom flange strands of Specimens IB-1 and IBE-1 and fpe in the top external strands of Specimen IEU-2 were assumed to be 150 ksi since test data for these strands was not available.
The experimental load displacement curves for Specimens IB-0, IB-1, IB-4, IU-4, IBU-1, IBU-2, IBU-3, IBU-4, IBU-5, IBE-1, and IEU-2 are compared to the MCFTA model results in Figure 4.21. First flexural and shear cracking are noted with a circle and a triangle, respectively. A quantitative comparison of the results is provided in Table 4.8.
In general, Figure 4.21 and Table 4.8 indicate that the maximum load was predicted well. The maximum load was overestimated for Specimen IBE-1 that experienced horizontal cracks at the level of ducts and slip along a horizontal crack. MCFTA cannot capture concrete slip. For most specimens, the flexural cracking load was predicted reasonably well, but the initial stiffness, shear cracking load, and displacement at shear cracking were overpredicted. In addition, the displacement at flexural cracking and at the maximum load was underpredicted.
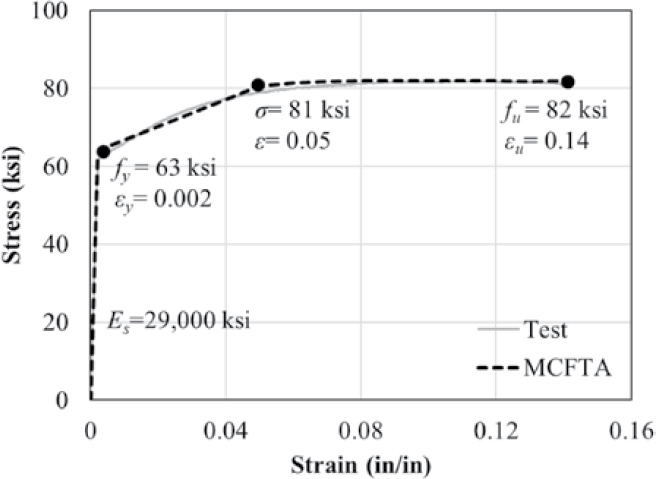
Table 4.7. Model inputs for validation cases.
| Group | Spec. No. | Concrete | Prestressing Steel | Shear Reinf. | ||||||||||||
|---|---|---|---|---|---|---|---|---|---|---|---|---|---|---|---|---|
| f′c (ksi) | E (ksi) | ft (psi) | fpy (ksi) | Eps (ksi) | ɛpy (%) | ɛpu (%) | fpe | fy (ksi) | E (ksi) | ɛy (%) | ɛu (%) | |||||
| BF (ksi) | BW (ksi) | TW (ksi) | EX (ksi) | |||||||||||||
| Internal Bonded (IB) | IB-0 | 10.8 | 5,917 | 779 | 259 | 28,500 | 1 | 4.2 | 156 | None | None | None | 63 | 29,000 | 0.2 | 14 |
| IB-1 | 9.8 | 5,648 | 743 | 259 | 28,500 | 1 | 4.2 | 150* | 156 | 146 | None | 63 | 29,000 | 0.2 | 14 | |
| IB-4 | 10.7 | 5,905 | 777 | 259 | 28,500 | 1 | 4.2 | 145 | 136 | 156 | None | 63 | 29,000 | 0.2 | 14 | |
| Internal Unbonded (IU) | IU-4 | 9.0 | 5,421 | 713 | 259 | 28,500 | 1 | 4.2 | 140 | 135 | 144 | None | 63 | 29,000 | 0.2 | 14 |
| Internal Bonded & Unbonded (IBU) | IBU-1 | 10.5 | 5,828 | 767 | 259 | 28,500 | 1 | 4.2 | 140 | 145 | 154 | None | 63 | 29,000 | 0.2 | 14 |
| IBU-2 | 11.0 | 5,983 | 787 | 259 | 28,500 | 1 | 4.2 | 159 | 142 | 118 | None | 63 | 29,000 | 0.2 | 14 | |
| IBU-3 | 10.6 | 5,861 | 771 | 259 | 28,500 | 1 | 4.2 | 140 | 150 | 156 | None | 63 | 29,000 | 0.2 | 14 | |
| IBU-4 | 11.1 | 6,009 | 791 | 259 | 28,500 | 1 | 4.2 | 140 | 147 | 146 | None | 63 | 29,000 | 0.2 | 14 | |
| IBU-5 | 11.3 | 6,060 | 797 | 259 | 28,500 | 1 | 4.2 | 159 | 147 | 144 | None | 63 | 29,000 | 0.2 | 14 | |
| Internal Bonded & External (IBE) | IBE-1 | 10.6 | 5,876 | 777 | 259 | 28,500 | 1 | 4.2 | 150* | 137 | 136 | 147 | 63 | 29,000 | 0.2 | 14 |
| Internal & External Unbonded (IEU) | IEU-2 | 8.9 | 5,383 | 708 | 259 | 28,500 | 1 | 4.2 | 166 | Middl 143 | web: | Bottom: 131 Top: 150* | 63 | 29,000 | 0.2 | 14 |
Abbreviations: BF = Bottom flange strand, BW = Bottom web strand, TW = Top web strand, EX = External strand
*fpe assumed as 150 ksi
Figure 4.22 shows the relationship between strand stress and beam displacement at the load point from MCFTA and testing. Strain gauge measurements were not available for the bottom flange strands of Specimens IB-1 and IBE-1 and for the top external strands of Specimen IEU-2. A detailed comparison of strand stresses at maximum load from tests to the values from MCFTA is provided in Table 4.9. Figure 4.22 and Table 4.9 indicate that MCFTA predicted increases in bonded and unbonded strands well. In general, MCFTA predictions were similar to the test results regardless of strand location across the cross section and regardless of strands being internal or external. The average ratios of the strand stresses at maximum load predicted by MCFTA to the values from the tests are 0.98, 1.03, 1.04, and 0.98 for the bottom flange, bottom web, top web, and external strands, respectively.
Crack patterns observed during testing were compared to crack patterns (concrete principal compressive strain directions) predicted by MCFTA (Figure 4.23). For crack patterns from MCFTA, the thin and thick red lines indicate crack widths greater than 0.04 in. and 0.08 in., respectively. Regions of concrete crushing observed during testing were compared to the ratio of the concrete principal compressive strain to the concrete compressive strain corresponding to f′c, that is εcomp./εatf ′c. Values of εcomp./εatf′c greater than 1 indicate that concrete begins to crush. The blue color indicates values less than 1 and represents regions that have not crushed. Red and green colors indicate regions of crushing predicted by MCFTA, with the green color indicating higher values of compressive strain.
Figure 4.23 provides a comparison for the IB specimens. The simulated crack patterns and web crushing for Specimens IB-1 and IB-4 were consistent with the ones from testing. For Specimen IB-0, which did not contain web ducts and did not experience web crushing, the crack pattern was not consistent.
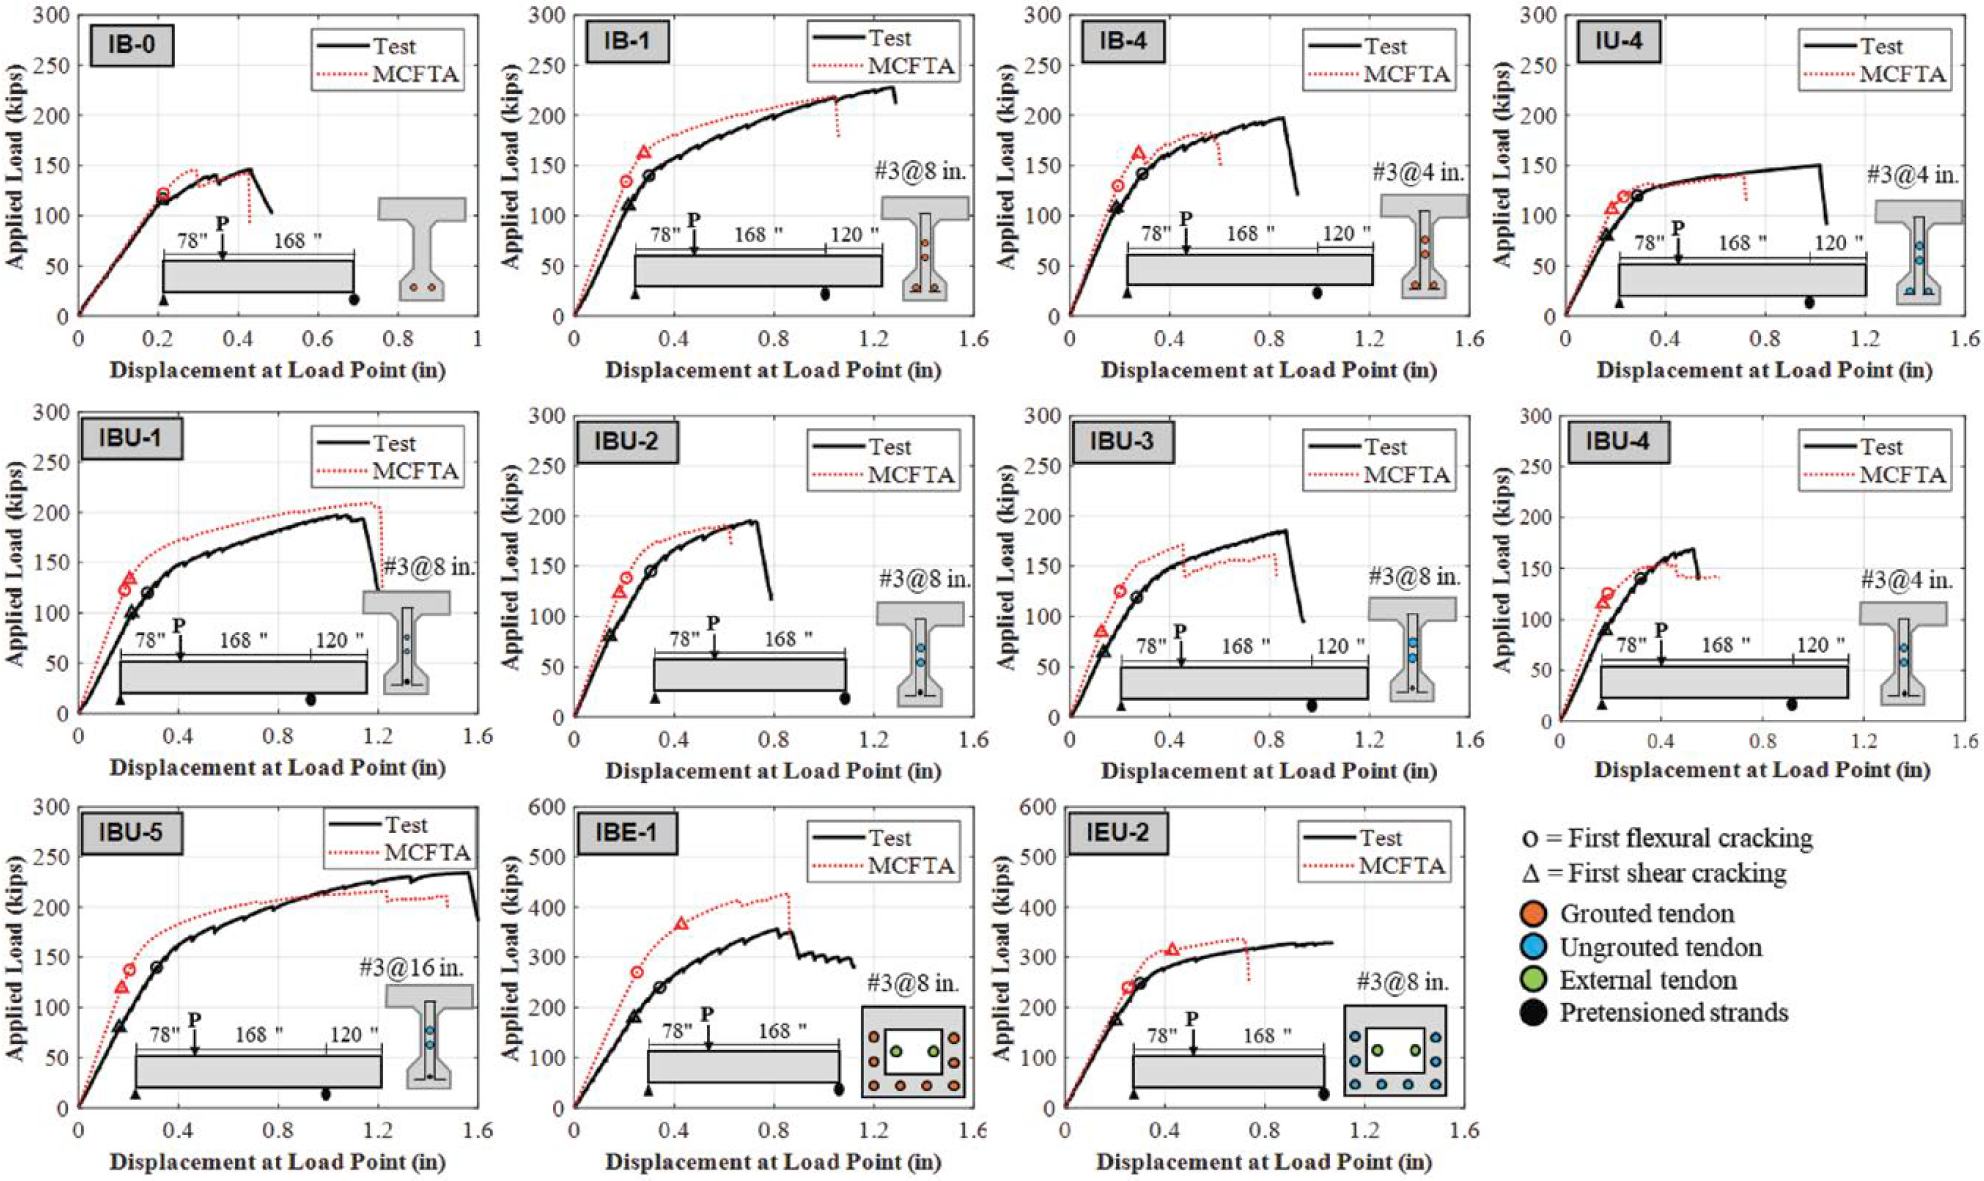
Table 4.8. Detailed comparison of load displacement results from tests and MCFTA.
| Group | Spec. No. | Initial Stiffness | Pmax | ∆ at Pmax | Pcr at flange | ∆ at Pcr at flange | Pcr at web | ∆ at Pcr at web | ||||||||||||||
|---|---|---|---|---|---|---|---|---|---|---|---|---|---|---|---|---|---|---|---|---|---|---|
| Test (kip/in.) | MCFTA (kip/in.) | MCFTA/Test | Test (kip) | MCFTA (kip) | MCFTA/Test | Test (in.) | MCFTA (in.) | MCFTA/Test | Test (kip) | MCFTA (kip) | MCFTA/Test | Test (in.) | MCFTA (in.) | MCFTA/Test | Test (kip) | MCFTA (kip) | MCFTA/Test | Test (in.) | MCFTA (in.) | MCFTA/Test | ||
| Internal Bonded (IB) | IB-0 | 588 | 577 | 0.98 | 146 | 146 | 1.00 | 0.4 | 0.3 | 0.68 | 117 | 122 | 1.04 | 0.2 | 0.2 | 1.01 | n/o | n/o | - | n/o | n/o | - |
| IB-1 | 481 | 668 | 1.39 | 228 | 219 | 0.96 | 1.3 | 1.0 | 0.82 | 140 | 134 | 0.96 | 0.3 | 0.2 | 0.70 | 110 | 162 | 1.48 | 0.2 | 0.3 | 1.29 | |
| IB-4 | 602 | 668 | 1.11 | 197 | 183 | 0.93 | 0.9 | 0.6 | 0.66 | 142 | 130 | 0.92 | 0.3 | 0.2 | 0.66 | 108 | 162 | 1.50 | 0.2 | 0.3 | 1.48 | |
| Internal Unbonded (IU) | IU-4 | 500 | 577 | 1.15 | 150 | 140 | 0.93 | 1.0 | 0.7 | 0.70 | 120 | 119 | 0.99 | 0.3 | 0.2 | 0.81 | 80 | 107 | 1.33 | 0.2 | 0.2 | 1.14 |
| Internal Bonded and Unbonded (IBU) | IBU -1 | 446 | 668 | 1.50 | 197 | 209 | 1.06 | 1.0 | 1.2 | 1.13 | 120 | 122 | 1.02 | 0.3 | 0.2 | 0.67 | 100 | 133 | 1.33 | 0.2 | 0.2 | 0.96 |
| IBU -2 | 568 | 668 | 1.18 | 195 | 191 | 0.98 | 0.7 | 0.6 | 0.86 | 145 | 138 | 0.95 | 0.3 | 0.2 | 0.68 | 80 | 123 | 1.54 | 0.1 | 0.2 | 1.27 | |
| IBU -3 | 490 | 668 | 1.36 | 186 | 171 | 0.92 | 0.9 | 0.5 | 0.52 | 119 | 125 | 1.05 | 0.3 | 0.2 | 0.75 | 64 | 84 | 1.32 | 0.1 | 0.1 | 0.93 | |
| IBU -4 | 515 | 668 | 1.30 | 169 | 156 | 0.92 | 0.5 | 0.4 | 0.79 | 140 | 125 | 0.90 | 0.3 | 0.2 | 0.59 | 89 | 115 | 1.30 | 0.2 | 0.2 | 0.94 | |
| IBU -5 | 485 | 706 | 1.45 | 234 | 216 | 0.92 | 1.6 | 1.2 | 0.79 | 140 | 137 | 0.98 | 0.3 | 0.2 | 0.65 | 80 | 119 | 1.49 | 0.2 | 0.2 | 1.06 | |
| Internal Bonded & External (IBE) | IBE -1 | 769 | 1058 | 1.38 | 356 | 427 | 1.20 | 0.8 | 0.9 | 1.05 | 240 | 270 | 1.13 | 0.3 | 0.3 | 0.7 3 | 180 | 365 | 2.03 | 0.2 | 0.4 | 1.80 |
| Internal Unbonded & External (IEU) | IEU -2 | 893 | 977 | 1.09 | 329 | 336 | 1.02 | 1.1 | 0.7 | 0.65 | 248 | 240 | 0.97 | 0.3 | 0.3 | 0.84 | 174 | 313 | 1.80 | 0.2 | 0.4 | 2.12 |
| Average | 1.26 | 0.99 | 0.79 | 0.99 | 0.74 | 1.51 | 1.30 | |||||||||||||||
n/o: not observed
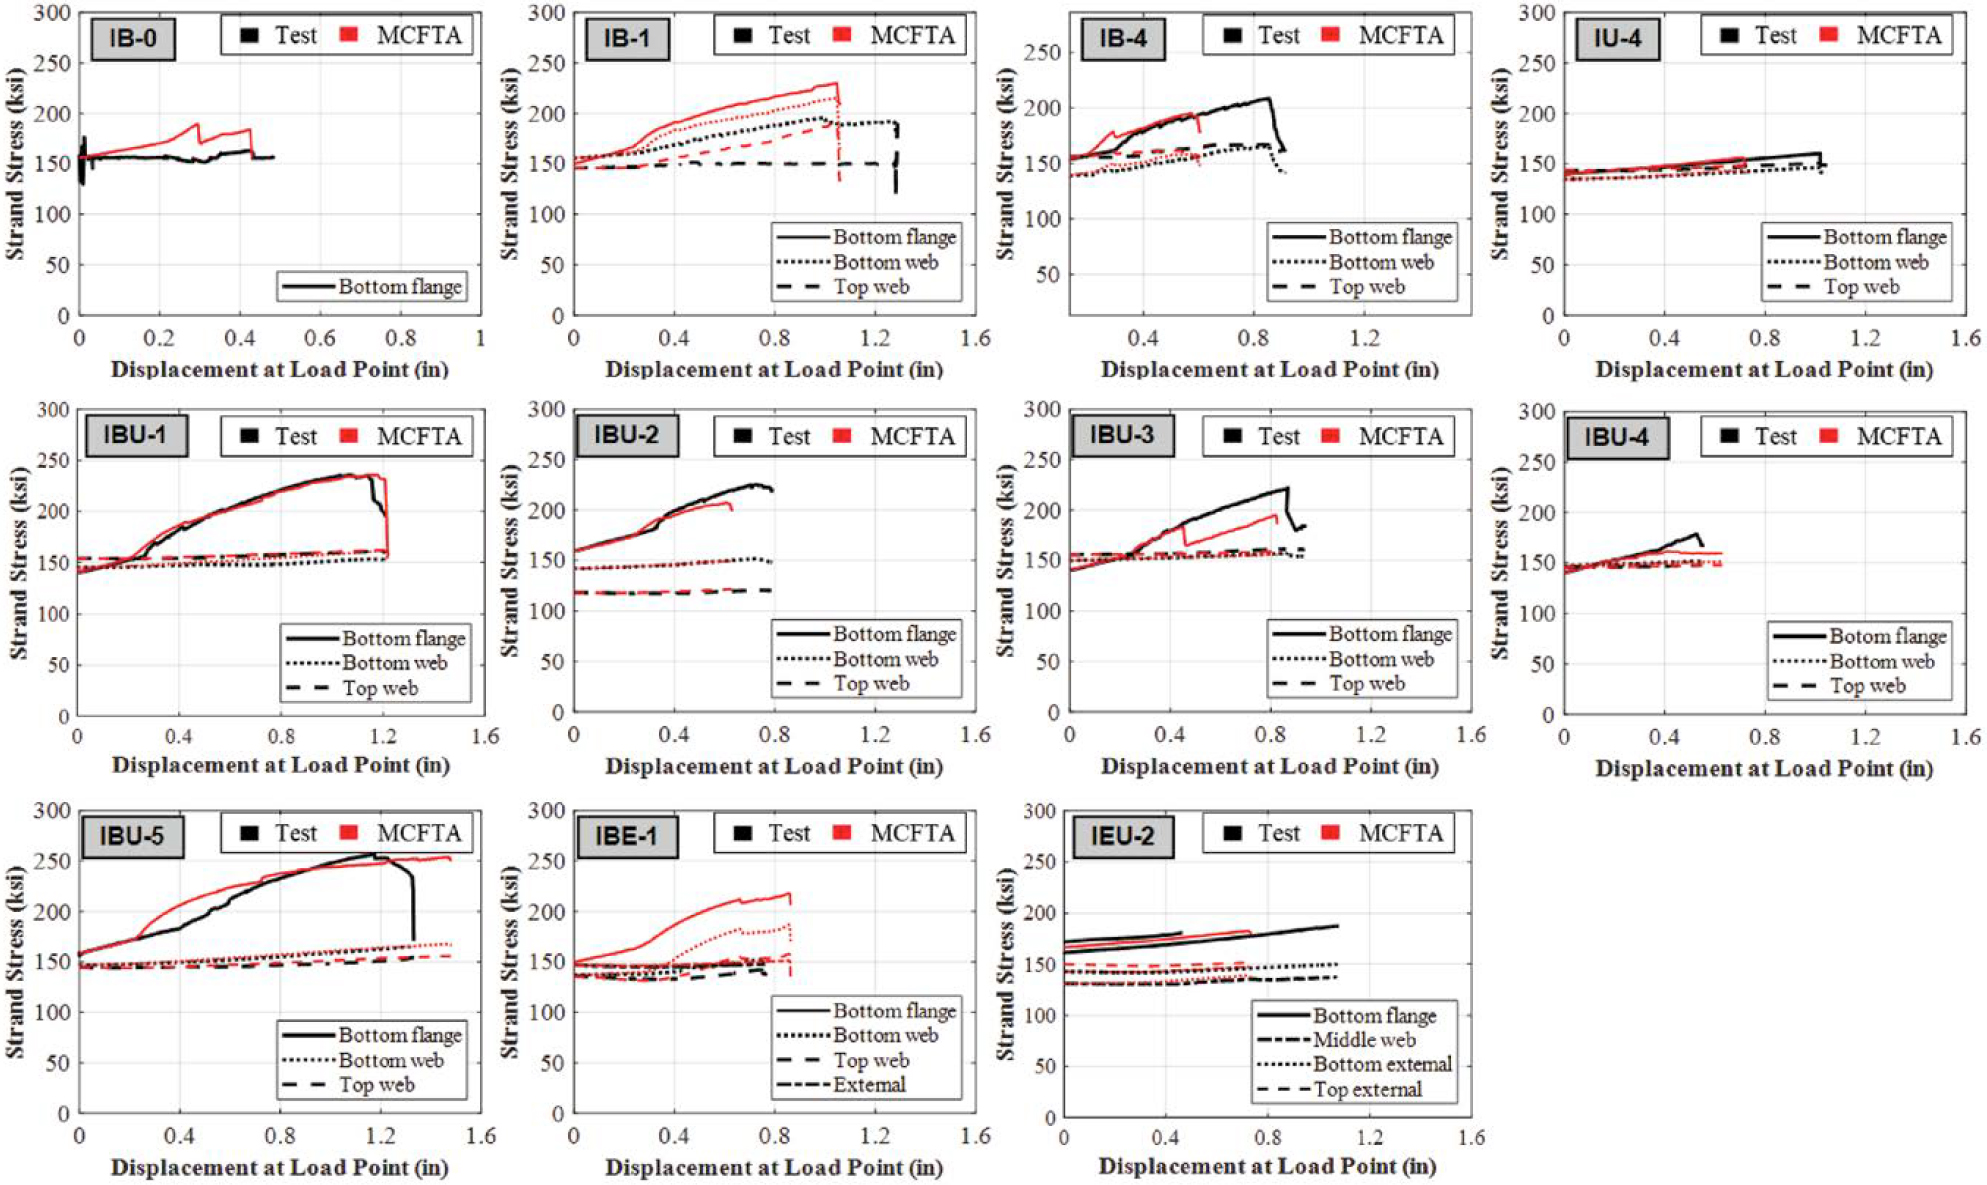
Table 4.9. Detailed comparison of strand stresses at maximum load results from tests and MCFTA.
| Group | Spec. No. | Strand stress at maximum load | |||||||||||
|---|---|---|---|---|---|---|---|---|---|---|---|---|---|
| Bottom Flange (BF) | Bottom Web (BW) | Top Web (TW) | External (EX) | ||||||||||
| Test (ksi) | MCFTA (ksi) | MCFTA / Test | Test (ksi) | MCFTA (ksi) | MCFTA / Test | Test (ksi) | MCFTA (ksi) | MCFTA / Test | Test (ksi) | MCFTA (ksi) | MCFTA / Test | ||
| Internal Bonded (IB) | IB-0 | 160 | 189 | 1.18 | - | - | - | - | - | - | - | - | - |
| IB-1 | n/a | 230 | - | 192 | 215 | 1.12 | 150 | 190 | 1.27 | - | - | - | |
| IB-4 | 209 | 196 | 0.94 | 165 | 159 | 0.96 | 167 | 162 | 0.97 | - | - | - | |
| Internal Unbonded (IU) | IU-4 | 160 | 153 | 0.96 | 146 | 142 | 0.97 | 151 | 147 | 0.98 | - | - | - |
| Internal Bonded and Unbonded (IBU) | IBU - 1 | 235 | 236 | 1.00 | 160 | 161 | 1.01 | 152 | 162 | 1.07 | - | - | - |
| IBU - 2 | 225 | 207 | 0.92 | 151 | 149 | 0.99 | 120 | 121 | 1.01 | - | - | - | |
| IBU - 3 | 199 | 183 | 0.92 | 155 | 154 | 0.99 | 161 | 158 | 0.98 | - | - | - | |
| IBU - 4 | 178 | 161 | 0.91 | 151 | 151 | 1.00 | 147 | 148 | 1.00 | - | - | - | |
| IBU - 5 | 257 | 254 | 0.99 | 165 | 168 | 1.02 | 154 | 156 | 1.01 | - | - | - | |
| Internal Bonded & External (IBE) | IBE- 1 | n/a | 218 | - | 152 | 187 | 1.23 | 142 | 158 | 1.11 | 148 | 151 | 1.02 |
| Internal Unbonded & External (IEU) | IEU - 2 | 187 | 182 | 0.98 | Middle Web: | - | - | - | Bottom | ||||
| 150 | 139 | 0.93 | |||||||||||
| 137 | 147 | 1.07 | Top: | ||||||||||
| n/a | 152 | - | |||||||||||
| Average | 0.98 | 1.03 | 1.04 | 0.98 | |||||||||
n/a: not available
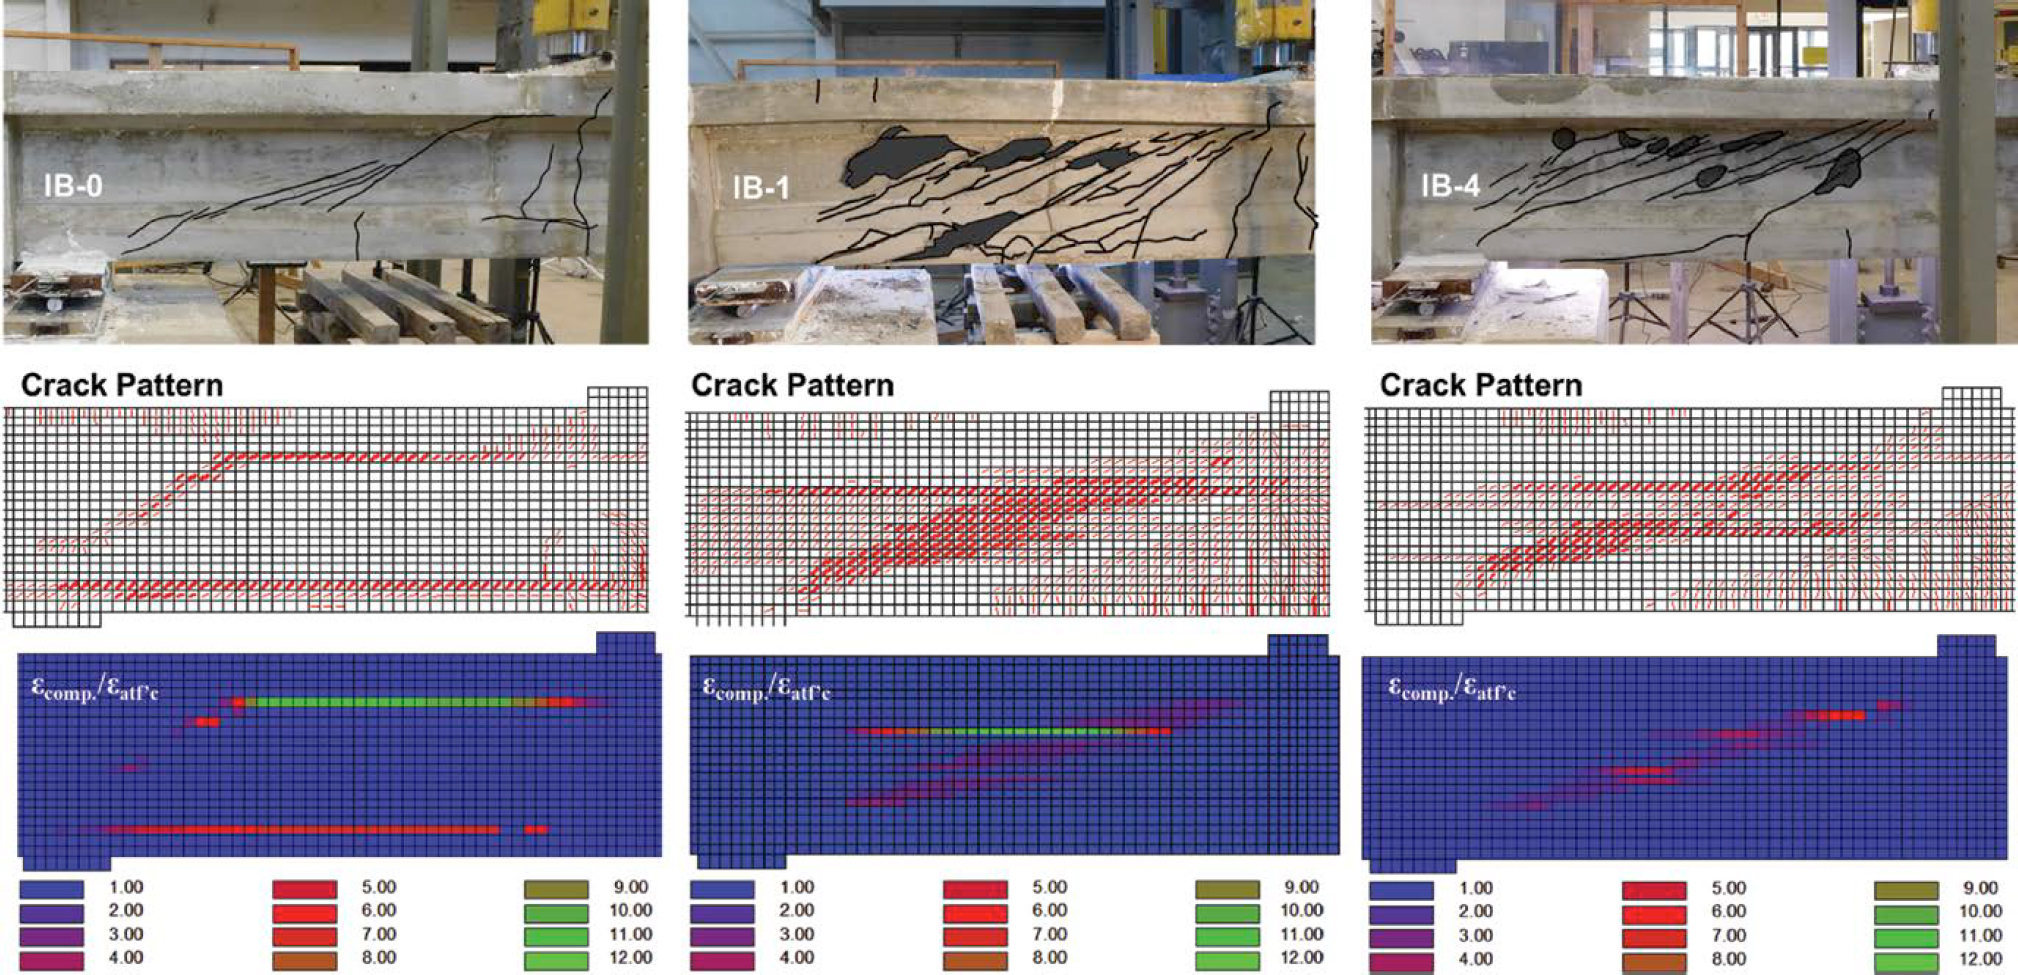
Figure 4.24 shows the MCFTA and test results for the IU specimen. Diagonal cracking and crushing below the top flange were predicted by MCFTA.
Figure 4.25 compares the cracking and crushing for the IBU specimens. The web-shear cracks and flexural cracks were captured well by MCFTA. For specimens other than IBU-5, crushing regions (green and red regions in the εcomp./εatf′c contour plots) were reasonably consistent with the regions of crushing observed during testing. For Specimen IBU-5, the analysis indicated crushing in the top flange near the load plate, while the specimen experienced crushing in the web during testing.
Figure 4.26 compares cracking and crushing for the IBE specimen. Two tests were conducted on Specimen IBE-1 due to a premature failure observed during the first test. New cracks from the second test are denoted using a blue color. During testing, the specimen experienced horizontal cracks at the level of ducts in the top portion of the web, and horizontal slip began to occur along the cracks. This behavior was not captured by MCFTA. The regions of crushing observed during the test indicate that a very small amount of crushing was localized at the horizontal cracks. The regions of crushing obtained from MCFTA, however, indicate that the dominant crushing occurred at the top flange near the load plate.
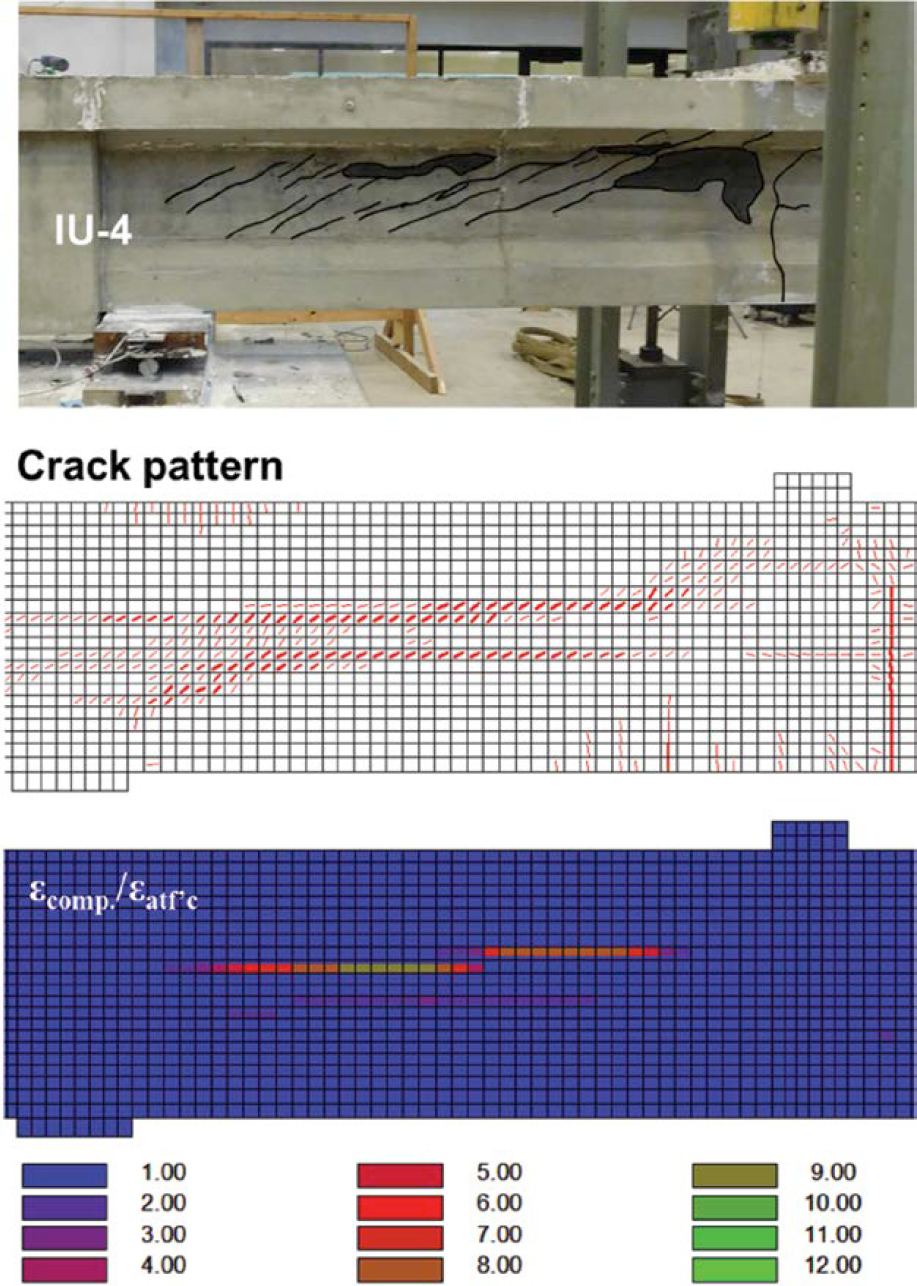
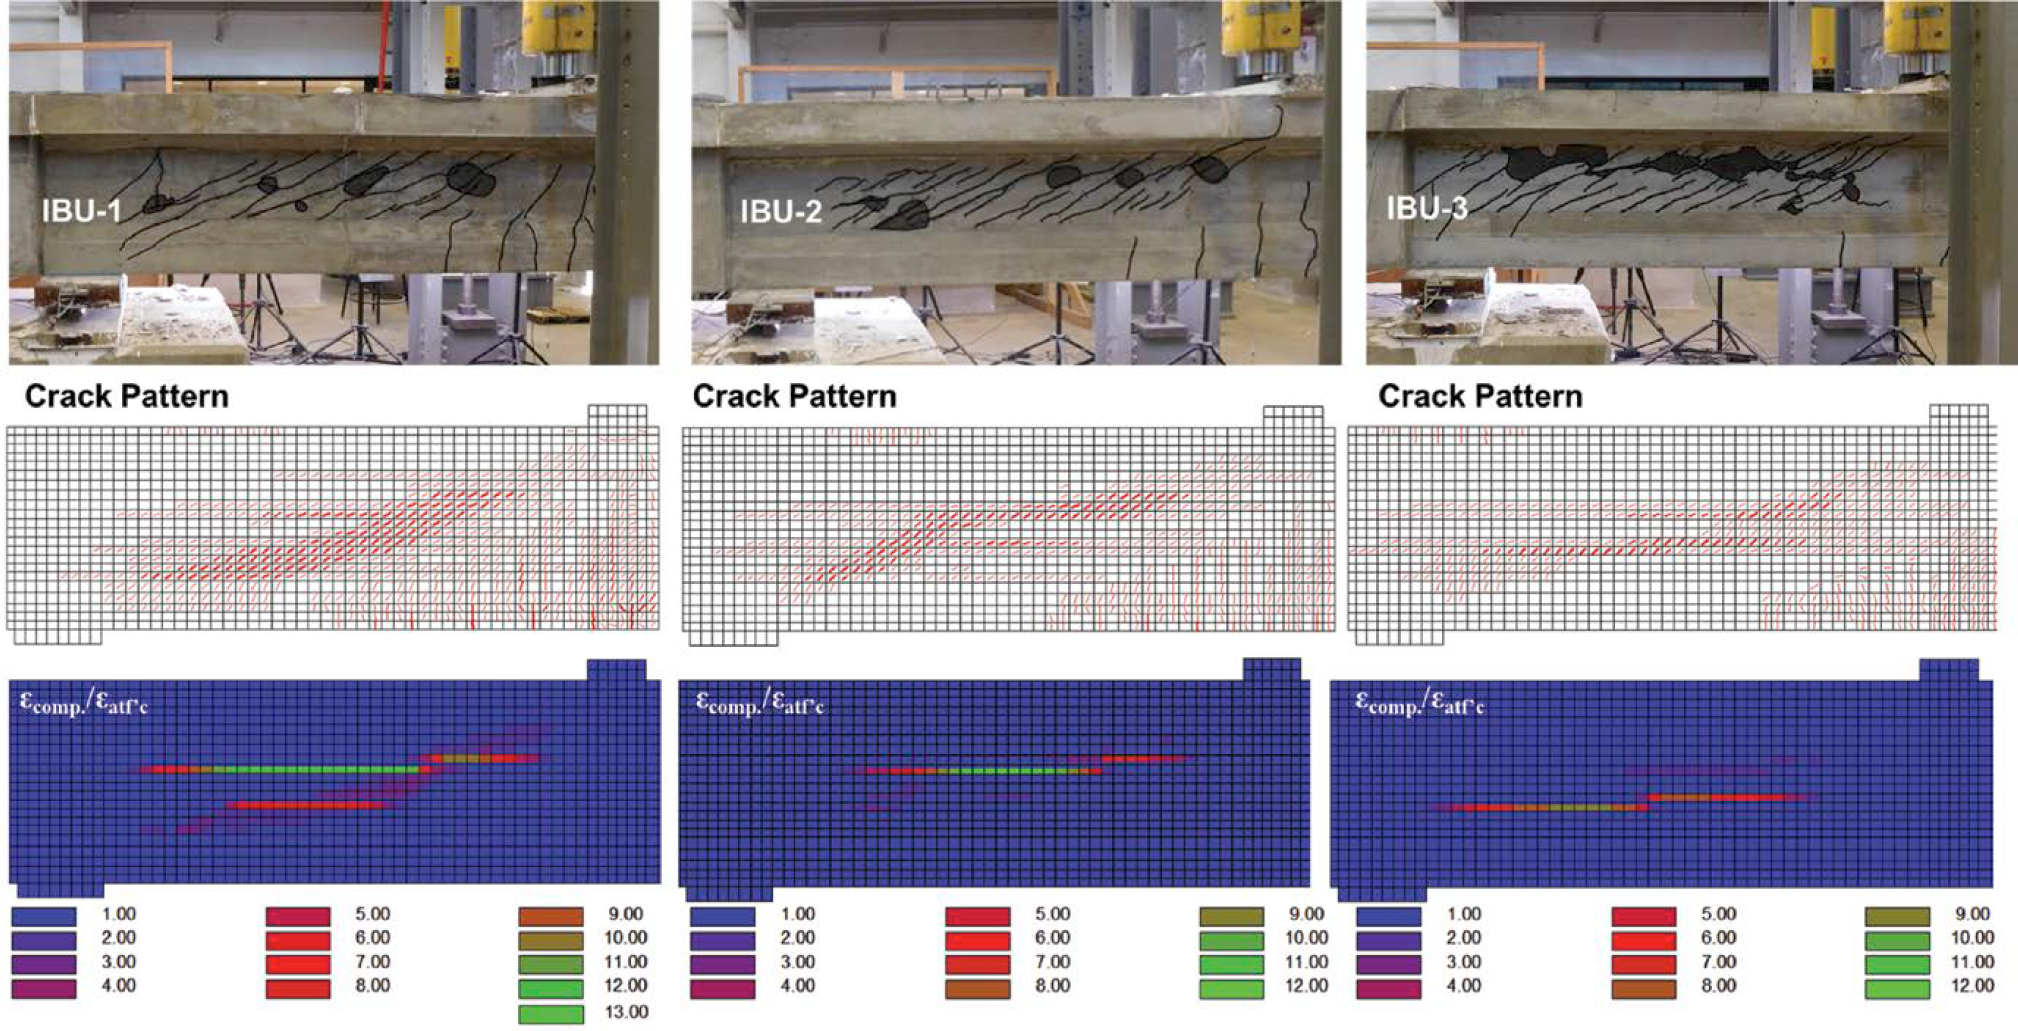
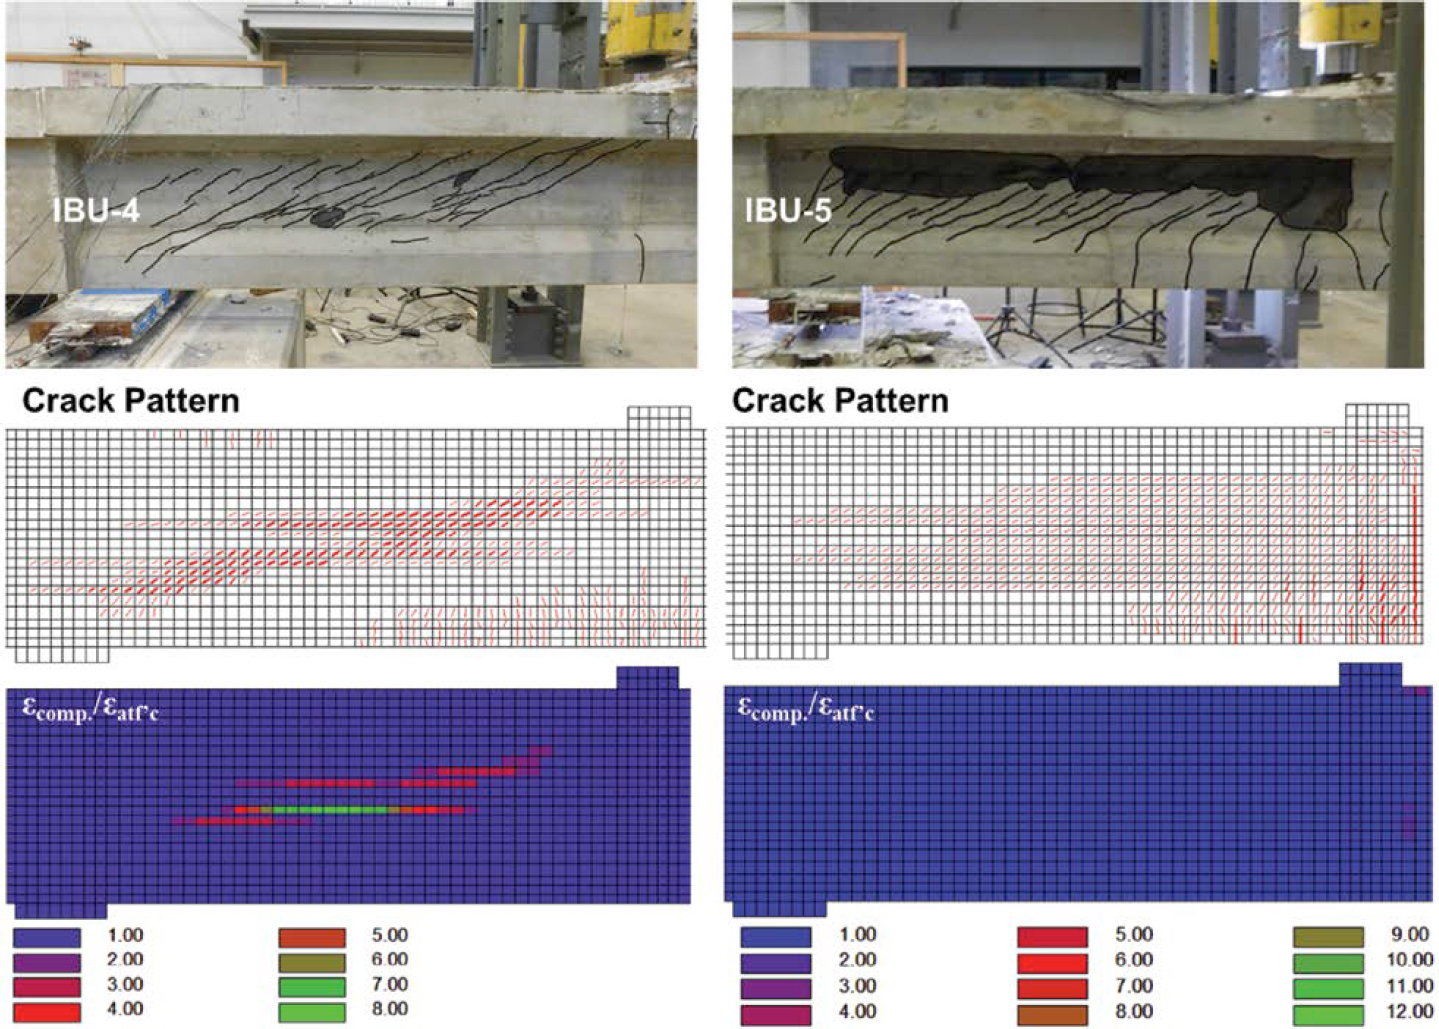
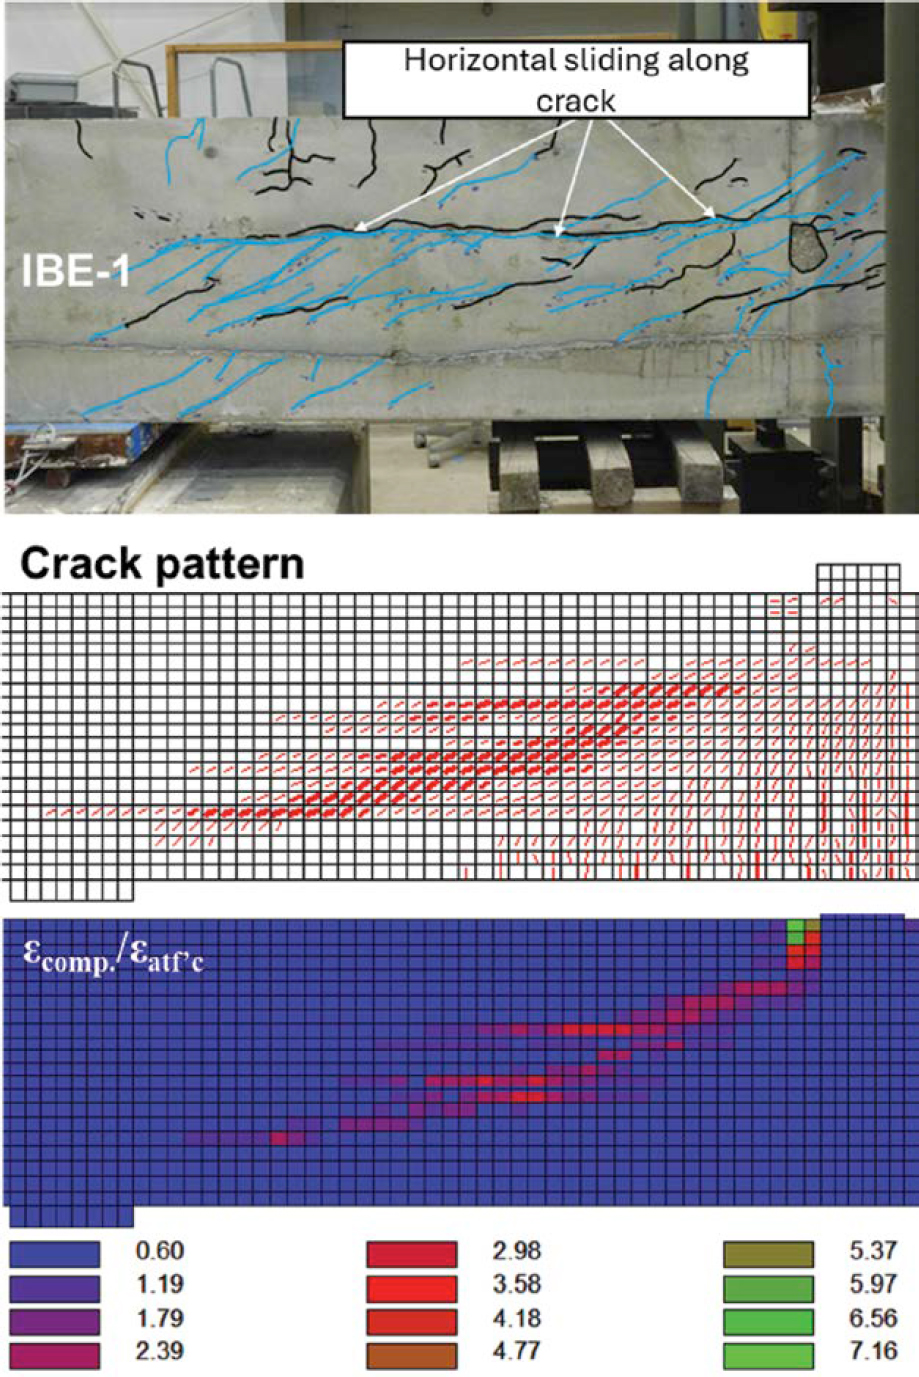
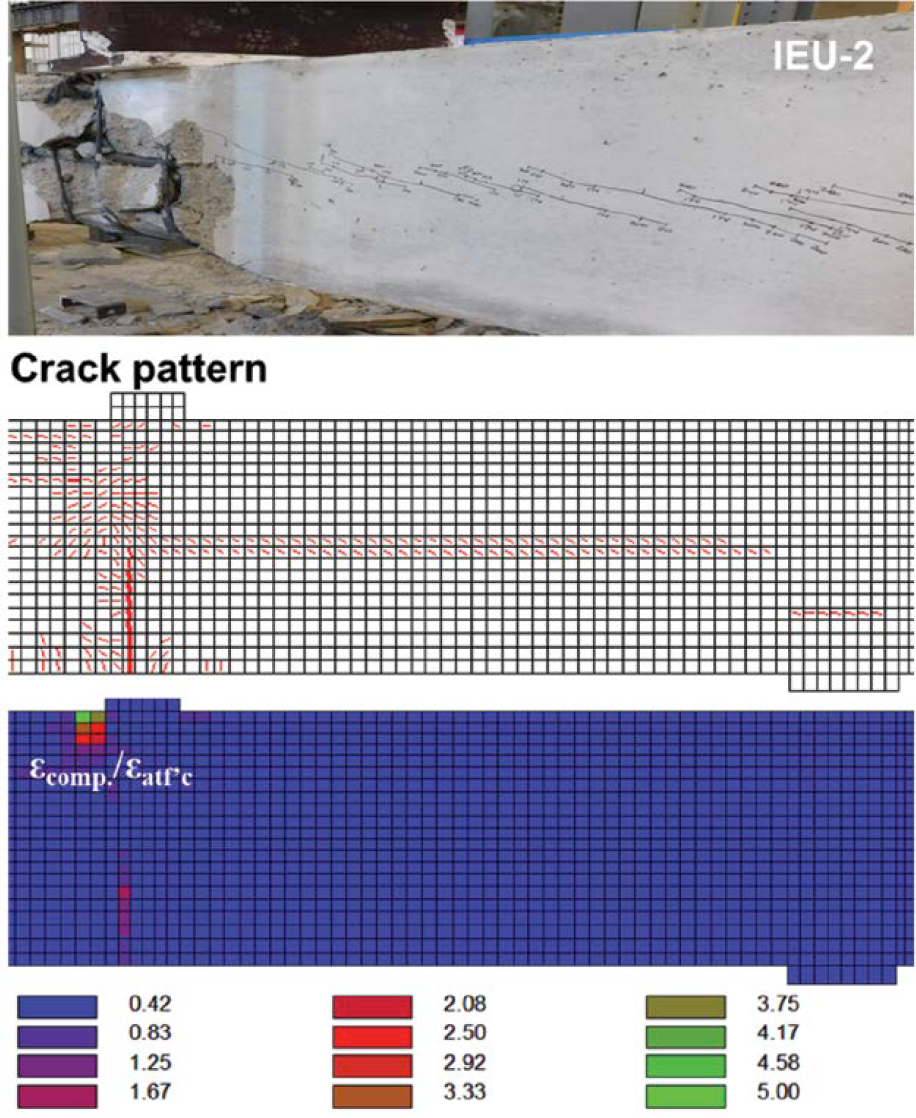
Figure 4.27 compares the results for the IEU specimen. During testing, Specimen IEU-2 experienced shear cracking at the level of the single web duct and flexural cracks at the load point, which was captured by MCFTA. Similarly, crushing of the top flange at the location of the point load observed during the test was also consistent with the regions of crushing predicted by MCFTA.
4.3.4 Parametric Analysis
4.3.4.1 Description of Girders Used for Parametric Analysis
The cross sections of the simply supported and continuous girders used for the parametric analyses are presented in Figure 4.28. The bulb tee and U-shaped girders correspond to AASHTO
Type IV (PCI 2023) and Washington DOT U78G5 girders (Washington State Department of Transportation 2023). The web thickness of these sections was modified to 10 in. to enable post-tensioning duct placement as consistent with practice. The girders were modeled with composite decks. For all cases, bottom flange strands were straight, and web strands were draped. The profiles of the external strands for the IBE and IEU cases were identical to the web strands for the IU and IBU cases for direct comparison of results across different girder cases. The combined strand cases (IBU and IBE) had bonded strands in the bottom flange and unbonded strands in the web. The IU and IEU cases had mild reinforcement in the bottom flange to avoid flexural failure.
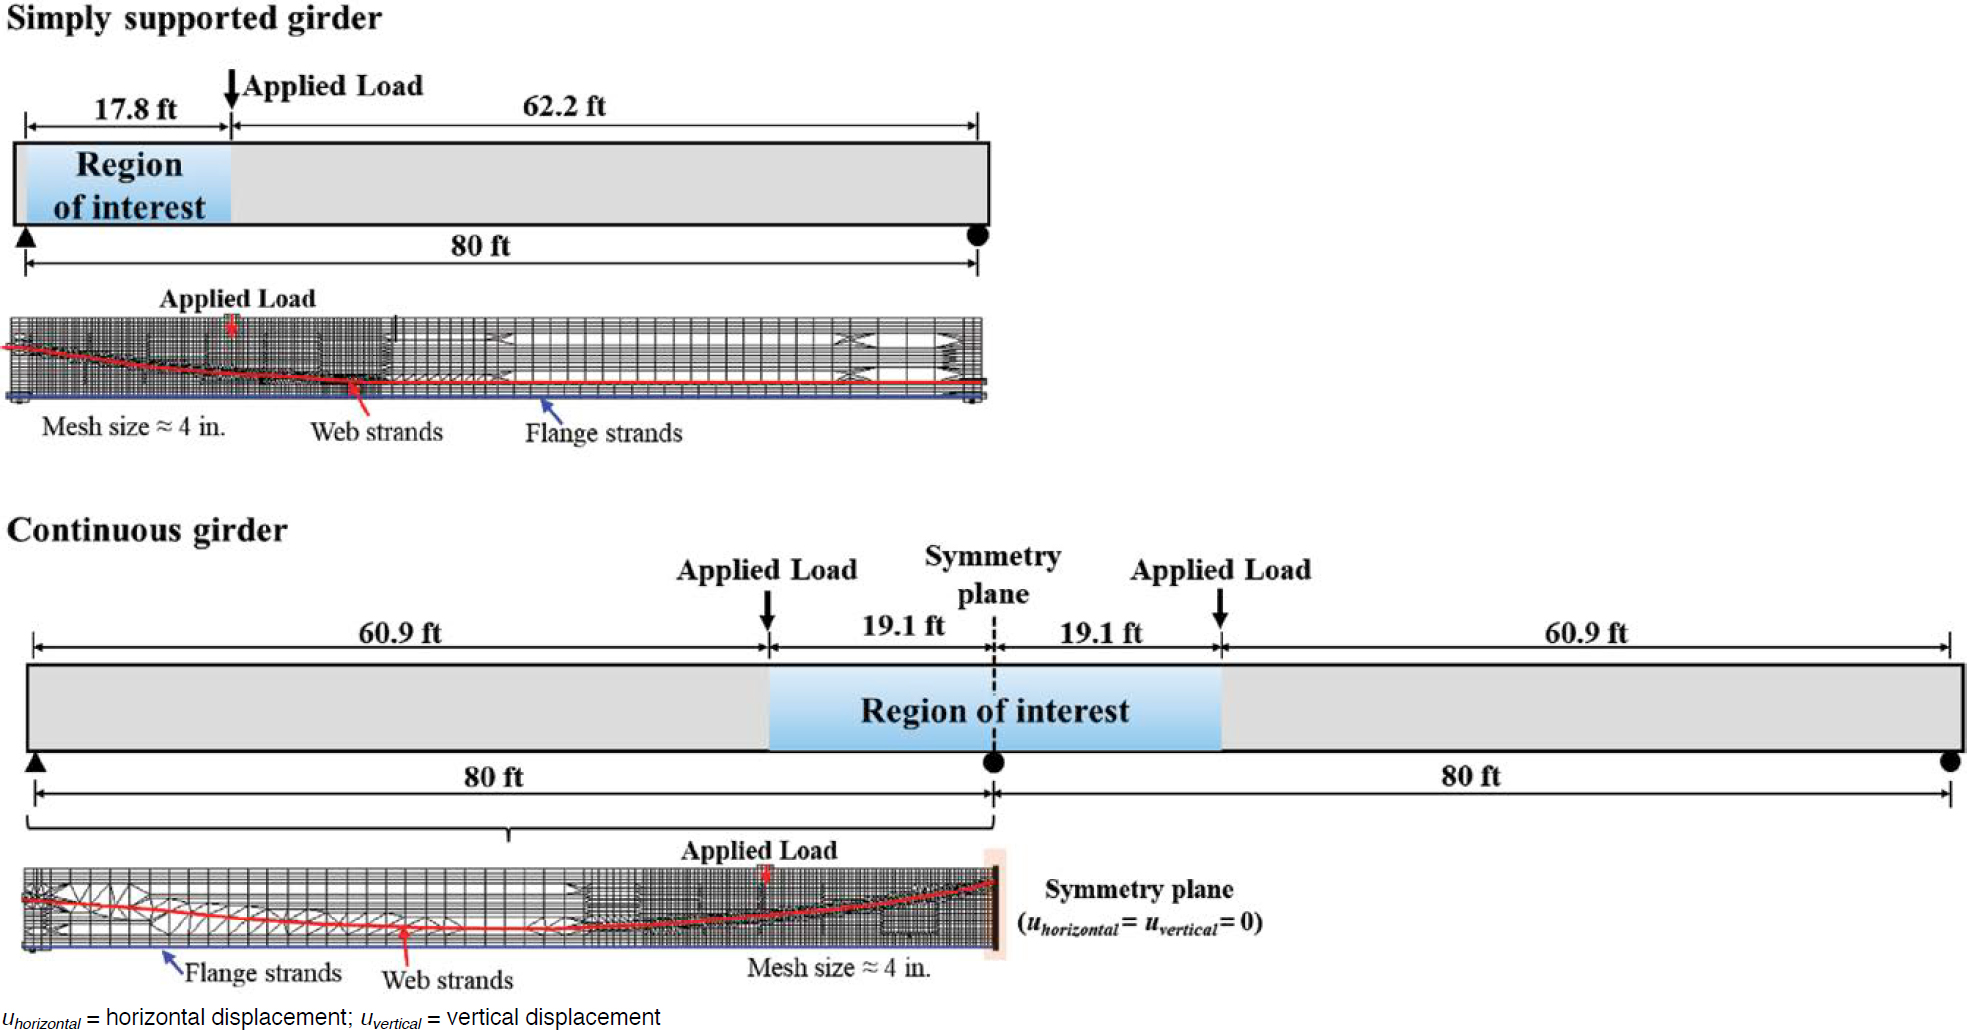
For simply supported cases, a single point load was applied 17.8 ft away from the support over a span length of 80 ft. Continuous cases had two 80-ft-long spans, and a point load was applied 19.1 ft away from the interior support on each span. Only one span of the continuous girders was modeled by applying symmetric boundary conditions at the interior support as illustrated in Figure 4.29. For both simply supported and continuous cases, the mesh in the region where shear failure was expected was refined, while the rest of the girder had a coarser mesh. A combination of triangular and rectangular elements was used.
4.3.4.2 Parameters
The parameters for simply supported and continuous cases are provided in Table 4.10 and Table 4.11, respectively. For simply supported cases, parameters included girder cross section (bulb tee vs. U-shaped), girder concrete strength (8 ksi vs. 15 ksi), the amount of shear reinforcement (No.4 stirrups spaced at 8 in. vs. No.4 stirrups spaced at 4 in.), flange to web strand area ratio (for IBU cases only), and mild reinforcement area (for IU and IEU cases only). For continuous cases, parameters included girder cross section (bulb tee vs. U-shaped) and the ratio of the flange to web strand area. The parameter receiving focus in each group is highlighted in green.
4.3.4.3 Model Inputs for Shear Analyses
The model inputs and input sources for the shear analyses are summarized in Table 4.12. The material inputs include properties of the girder and deck concrete, strand, and mild reinforcement. The definitions of the parameters in Table 4.12 are consistent with the material models previously described. The stress-strain curves of strand and mild reinforcement were based on material testing from the experimental investigation. The effective stress was assumed to be 170 ksi. The compressive strength and modulus of elasticity of the grout were assumed to be 4 ksi and 3,605 ksi, respectively, when calculating the reduced web thickness due to grouted ducts.
Table 4.10. Details of parameters for simply supported girders.
| Continuity | Group | Section | Aps (in.2) | As (in.2) | Girder Concrete Strength (ksi) | Shear Reinf. | |||
|---|---|---|---|---|---|---|---|---|---|
| Internal Flange Reinf. | Internal Web Reinf. | External Reinf. | Internal Flange Reinf. | Deck | |||||
| Simply Supported | IB | Bulb tee | 10.42 | 3.47 | None | None | 9.9 | 8 | #4@8" |
| 15 | #4@8" | ||||||||
| 8 | #4@4" | ||||||||
| U | 18.23 | 6.08 | None | None | 19.84 | 8 | #4@8" | ||
| 15 | #4@8" | ||||||||
| 8 | #4@4" | ||||||||
| IU | Bulb tee | 10.42 | 3.47 | None | 11.68 | 9.9 | 8 | #4@8" | |
| 15 | #4@8" | ||||||||
| 8 | #4@4" | ||||||||
| 6.55 | 8 | #4@8" | |||||||
| U | 18.23 | 6.08 | None | 19.86 | 19.84 | 8 | #4@8" | ||
| 15 | #4@8" | ||||||||
| 8 | #4@4" | ||||||||
| 11.74 | 8 | #4@8" | |||||||
| IBU | Bulb tee | 10.42 | 3.47 | None | None | 9.9 | 8 | #4@8" | |
| 15 | #4@8" | ||||||||
| 8 | #4@4" | ||||||||
| 6.94 | 6.94 | 8 | #4@8" | ||||||
| U | 18.23 | 6.08 | None | None | 19.84 | 8 | #4@8" | ||
| 15 | #4@8" | ||||||||
| 8 | #4@4" | ||||||||
| 12.15 | 12.15 | None | None | 19.84 | 8 | #4@8" | |||
| IBE | U | 18.23 | None | 6.08 | None | 19.84 | 8 | #4@8" | |
| 15 | #4@8" | ||||||||
| IEU | U | 18.23 | None | 6.08 | 19.86 | 19.84 | 8 | #4@8" | |
| 15 | #4@8" | ||||||||
| 11.74 | 8 | #4@8" | |||||||
Highlighted cells are parameters receiving focus in each group
Table 4.11. Details of parameters for continuous girders.
| Continuity | Group | Section | Aps (in.2) | As (in.2) | Girder Concrete Strength (ksi) | Shear Reinf. | |||
|---|---|---|---|---|---|---|---|---|---|
| Internal Flange Reinf. | Internal Web Reinf. | External Reinf. | Internal Flange Reinf. | Deck | |||||
| Continuous | IB | Bulb tee | 10.42 | 3.47 | None | None | 9.9 | 8 | #4@8" |
| U | 18.23 | 6.08 | None | None | 19.84 | 8 | #4@8" | ||
| 6.08 | 18.23 | ||||||||
| IU | Bulb tee | 10.42 | 3.47 | None | 11.68 | 9.9 | 8 | #4@8" | |
| U | 18.23 | 6.08 | None | 19.86 | 19.84 | 8 | #4@8" | ||
| 6.08 | 18.23 | ||||||||
| IBU | Bulb tee | 10.42 | 3.47 | None | None | 9.9 | 8 | #4@8" | |
| U | 18.23 | 6.08 | None | None | 19.84 | 8 | #4@8" | ||
| 6.08 | 18.23 | None | None | 19.84 | |||||
| IBE | U | 18.23 | None | 6.08 | None | 19.84 | 8 | #4@8" | |
| 6.08 | 18.23 | ||||||||
| IEU | U | 18.23 | None | 6.08 | 19.86 | 19.84 | 8 | #4@8" | |
| 6.08 | 18.23 | ||||||||
Highlighted cells are parameters receiving focus in each group
4.3.4.4 Shear Analysis Results
Shear loads at web-shear cracking, stirrup yielding, and ultimate obtained from MCFTA are presented for girders with varying parameters. Additionally, shear strength predicted by MCFTA and the LRFD BDS (AASHTO 2020) are compared.
4.3.4.4.1 Simply Supported Girders
The parameters receiving focus for simply supported girders were strand bond type, girder concrete strength, and the amount of shear reinforcement.
4.3.4.4.1.1 Impact of Ducts in the Web
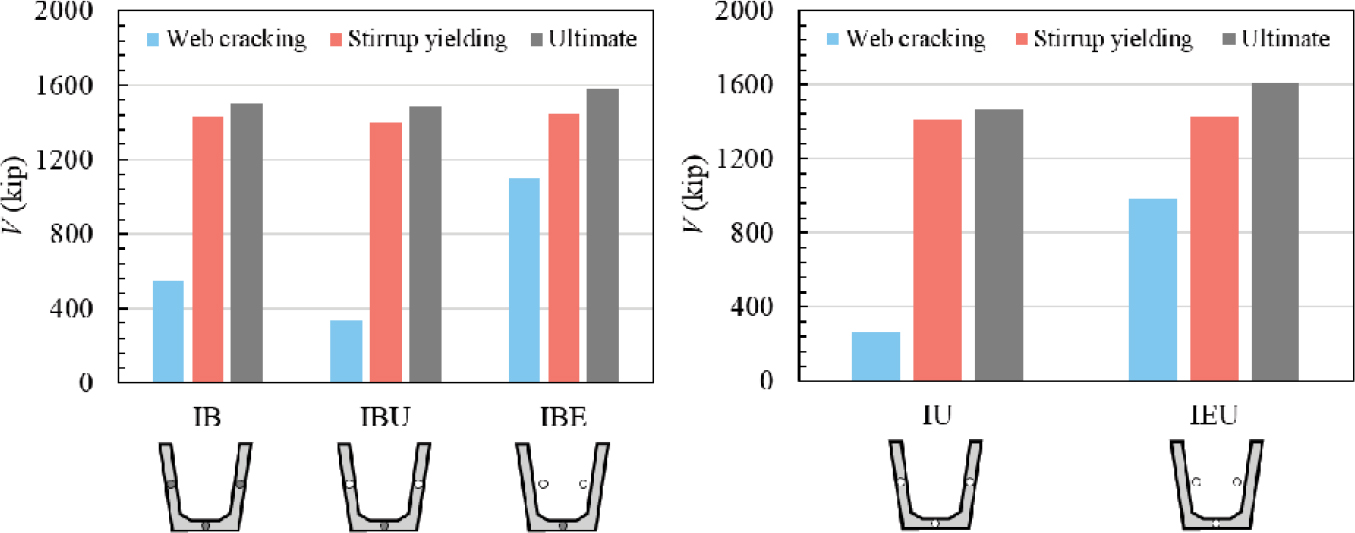
Figure 4.30 compares shear loads at web-shear cracking, stirrup yielding, and ultimate with the presence of ducts in the web. When grouted ducts were located in the web (IB case), shear loads at web-shear cracking and ultimate decreased compared to the case with external ducts (IBE case). Similarly, when ungrouted ducts were located in the web (IBU and IU cases), shear loads at web-shear cracking and ultimate were smaller compared to cases with external ducts (IBE and IEU cases). For both grouted and ungrouted ducts, using the ducts in the web resulted in an average of 6% decrease in ultimate capacity.
Table 4.12. Model inputs and input sources for shear cases.
| Input | Girder Concrete | Deck Concrete | Post-Tensioned Strand | Mild Reinforcement | |||||||||||||
|---|---|---|---|---|---|---|---|---|---|---|---|---|---|---|---|---|---|
| f′c (ksi) | Ec (ksi) | ft (psi) | f′c (ksi) | Ec (ksi) | ft (psi) | fpy (ksi) | Eps (ksi) | fpu (ksi) | ɛpy (%) | ɛpu (%) | fpe (ksi) | fy (ksi) | fu (ksi) | Es (ksi) | ɛy (%) | ||
| MCFTA | 8 | 5,098 | 671 | 4 | 3,605 | 474 | 259 | 28,500 | 282 | 1 | 4.2 | 170 | 63 | 82 | 29,000 | 14 | |
| 15 | 6,981 | 919 | 4 | 3,605 | 474 | 259 | 28,500 | 282 | 1 | 4.2 | 170 | 63 | 82 | 29,000 | 14 | ||
| Source | Design strength | ACI (2019) | Assumed | Design strength | ACI (2019) | Assumed | Test | Assumed | Test | ||||||||
Notes: fu = tensile strength of reinforcements:
4.3.4.4.1.2 Impact of Girder Concrete Strength
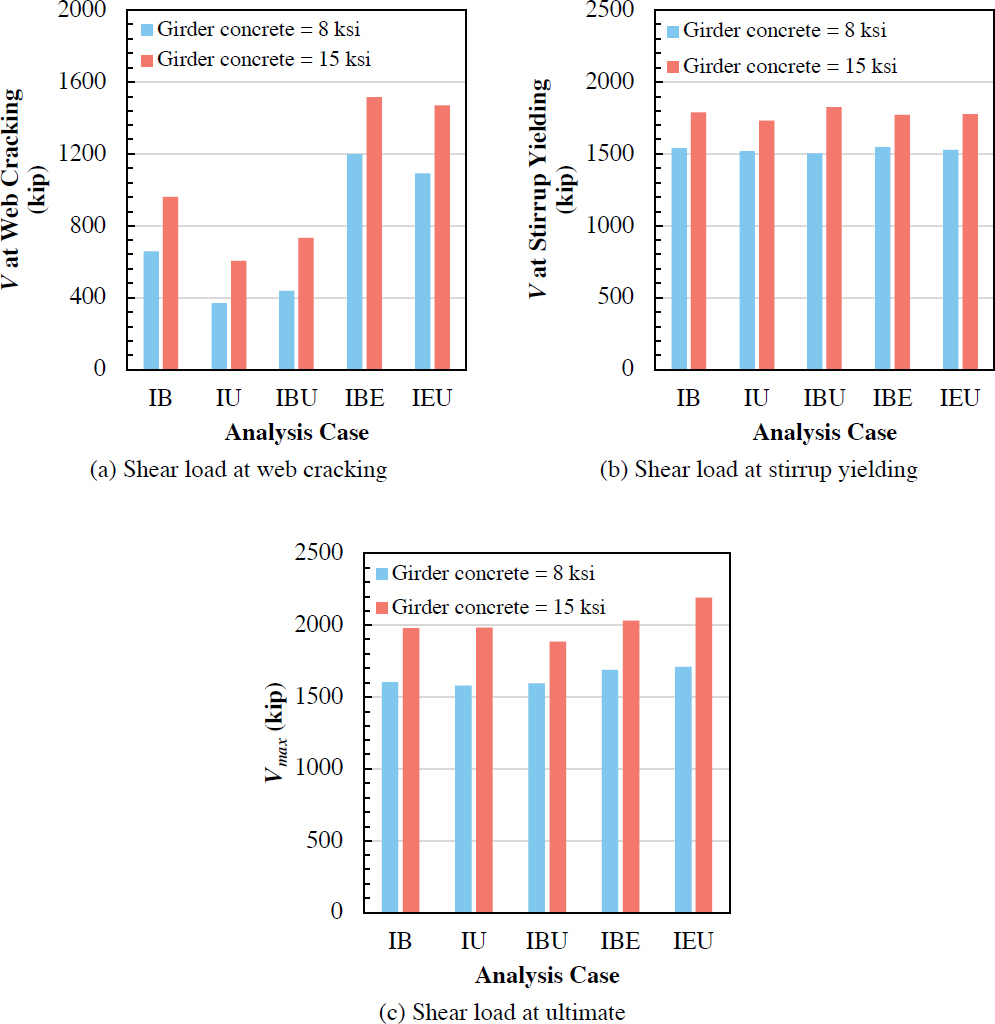
Figure 4.31 compares shear loads at web-shear cracking, stirrup yielding, and ultimate with 8-ksi and 15-ksi girder concrete compressive strengths. The compressive strength of the deck concrete for all cases was 4 ksi. Only the cases of U-shaped girders with shear failures are presented. The results for bulb tee girders are not shown because they do not include IBE and IEU cases. Furthermore, the conclusions for the bulb tee girders for the IB, IU, and IBU cases were similar to those of the U-shaped girders.
In all cases, higher girder concrete compressive strengths caused an increase in the shear loads at web cracking, stirrup yielding, and ultimate. An increase in girder concrete compressive strength from 8 ksi to 15 ksi (an increase in √f′c of 37%) led to a 48% increase in shear load at web cracking when averaged for all cases with the U-shaped cross section. The increase was 16% for stirrup yielding and 24% for ultimate capacity when averaged for all cases of the U-shaped cross section.
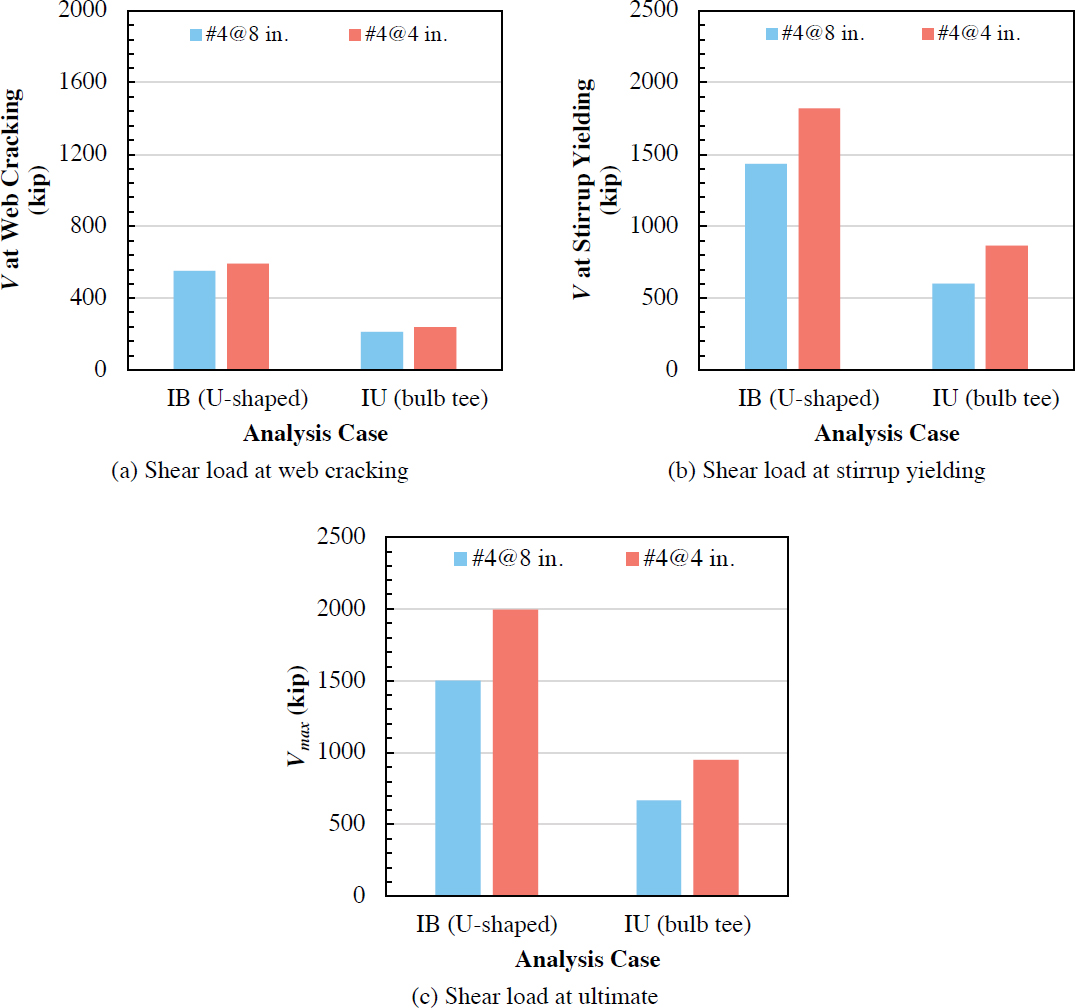
4.3.4.4.1.3 Impact of Shear Reinforcement
Figure 4.32 compares shear loads at web-shear cracking, stirrup yielding, and ultimate with different amounts of shear reinforcement (#4 stirrups spaced at 8 in. vs. #4 stirrups spaced at 4 in.). All beams included double-legged stirrups in each web. Only the cases resulting in shear failures are presented (IB and IU cases). The IBU, IBE, and IEU cases failed in flexure when the shear reinforcement was doubled, and these results are not included here.
Doubling the amount of shear reinforcement slightly increased the shear load at web cracking by 10% but significantly increased the shear load at stirrup yielding by 36% on average for the cases shown. As expected, the decrease in spacing in shear reinforcement led to a 37% increase in capacity on average for these cases.
4.3.4.4.2 Continuous Girders
The parameter receiving focus for the continuous girders was the ratio of web strand area to total strand area.
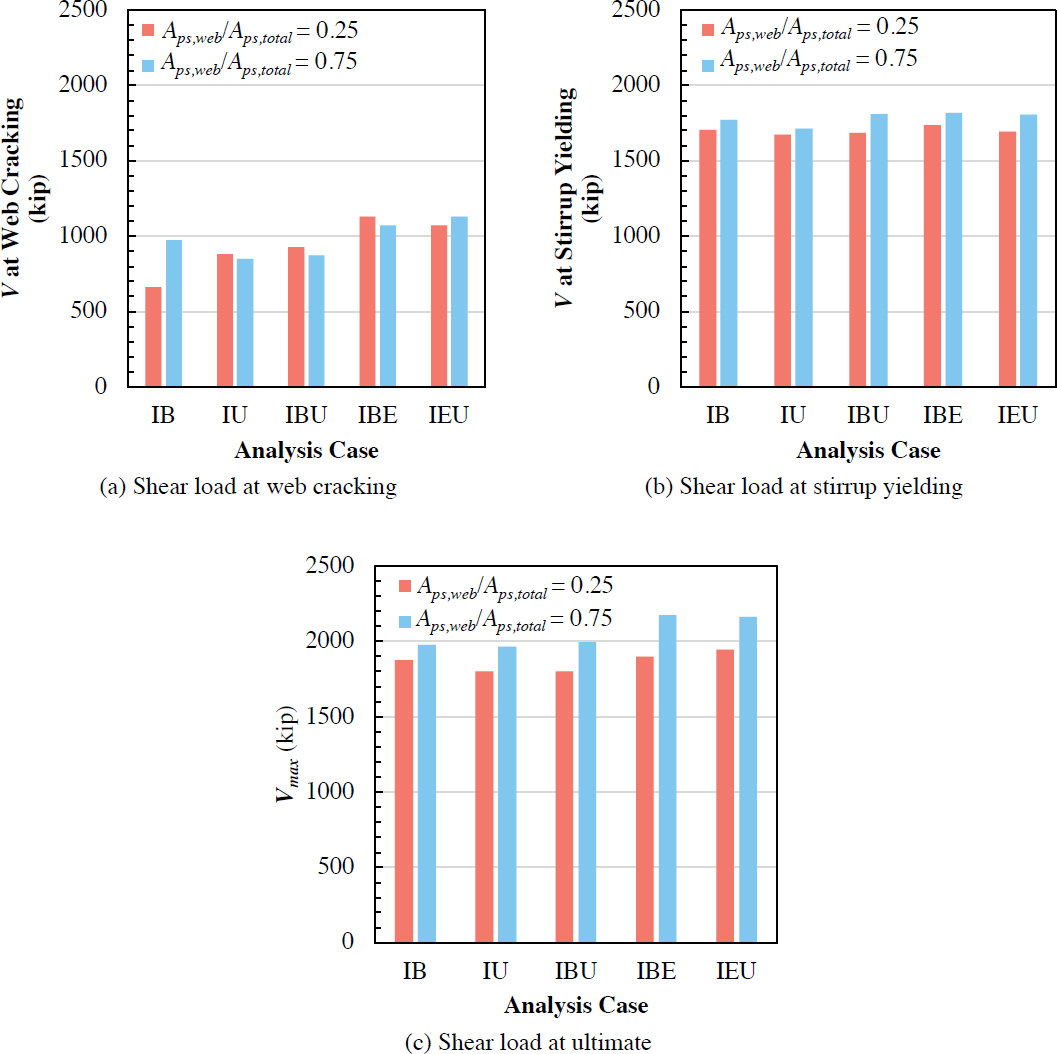
4.3.4.4.2.1 Impact of Web Strand Area
Figure 4.33 compares shear loads at web-shear cracking, stirrup yielding, and ultimate with different areas of web strands while keeping the total strand area constant. Duct diameter was also maintained constant between cases. The ratio of web strand area to total strand area, Aps,web/Aps,total,
was varied considering 0.25 and 0.75. A greater Aps,web/Aps,total ratio is more common near interior supports of continuous girders.
As shown in Figure 4.33(a), the change in web strand area impacted the web cracking load significantly for only the IB case (47% increase). For this case, stress in the bonded prestressing strand in the web at web cracking was significantly higher compared to the other cases, which included unbonded strands in the web where the strand stress did not change significantly at web cracking. For cases other than IB, the change in the web cracking load due to the change in web strand area was small (<5% increase or decrease). When the Aps,web/Aps,total ratio increased, shear loads at stirrup yielding for all cases increased by a small amount (<7%) as shown in Figure 4.33(b).
Figure 4.33(c) shows that, when the web strand area decreased significantly without changing the total strand area, the ultimate shear capacities decreased by less than 15% for all cases and by 10% on average. This is contradictory to the shear capacity estimations according to the LRFD BDS (AASHTO 2020) that predict a 39% decrease on average for all cases due to the decrease in web strand area. The difference between MCFTA and the LRFD BDS predictions is due to the fact that the LRFD BDS only accounts for strands on the flexural tension side of the section when calculating the net longitudinal strain in the cross section (Aps fpo term in Eq. 5.7.3.4.2-4 of the LRFD BDS). For negative moment regions of the continuous girders investigated here, only the web strands were on the flexural tension side. Therefore, the LRFD BDS predicts significantly
lower shear capacities. MCFTA shows, however, that the location of strands across the cross section is not as critical as assumed by the LRFD BDS.
4.3.4.5 Comparison of Shear Analysis Results with AASHTO LRFD
Figure 4.34 compares shear capacities obtained from MCFTA to the capacities calculated according to the LRFD BDS (AASHTO 2020). Only the analyses resulting in shear failures were included in the plot. For both simply supported and continuous cases, the shear capacity was calculated as dv away from the point of highest moment under applied load (excluding self-weight). For the simply supported cases, the location was dv away from the load point. For continuous cases, the location was dv away from the interior support. The 45-degree line indicates perfect correlation between predictions by MCFTA and the calculated shear capacity by the LRFD BDS. The number of analysis cases, mean of the ratio of MCFTA predicted capacities to the LRFD BDS calculated capacities, the standard deviation (SD) of this ratio, and the correlation coefficient (R) are presented in the plots.
The LRFD BDS (AASHTO 2020) calculated values are conservative for all cases (above the 45-degree line) regardless of the duct location over the height of the girder cross section (bulb tee vs. U-shaped), strand location (internal vs. external), strand bond type (bonded vs. unbonded), girder concrete compressive strength (8 ksi vs. 15 ksi), the amount of shear reinforcement (#4 spaced at 4 in. vs. #4 spaced at 8 in.), and girder continuity (simply supported vs. continuous).
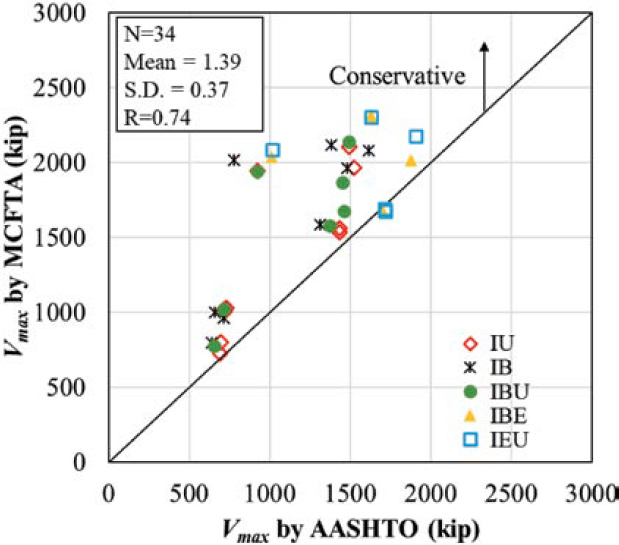
This result is partially because the analytical models include strain hardening for stirrups while the LRFD BDS ignores stress increases in stirrups after yielding. While conservative, it should be noted that there is significant scatter in the results and many points are very conservative with ratios over 2.
4.3.4.6 Shear Analysis Conclusions
The following are the conclusions from the analytical investigation for shear:
- Simply supported girders: Ducts in the web reduced the shear capacity, and the reduction was similar for grouted and ungrouted ducts. Greater concrete compressive strengths led to an increase in the web cracking load. The percentage increase in cracking load was similar to the percentage increase in the square root of the compressive strength (√f′c). Increasing the stirrup area resulted in an increase in the stirrup yielding load, with the percentage increase in stirrup area being similar to the percentage increase in the shear capacity.
- Continuous girders: Analyses indicated that the shear capacity decreased by 10% on average when the area of web strands decreased (while keeping the total strand area constant). For the same girders, the LRFD BDS (AASHTO 2020) predicted the shear capacity to decrease by 39% on average. The difference between the analysis and the LRFD BDS predictions stems from the fact that the LRFD BDS only accounts for strands on the flexural tension side of the section. For continuous girders in negative moment regions, strands on the compression side of the section are not considered in capacity predictions, resulting in smaller shear capacities. The analysis results indicate that strands on the flexural compression side also contribute to shear capacity.
- The LRFD BDS (AASHTO 2020) conservatively estimated the shear capacity for the simply supported and continuous girders analyzed in this parametric investigation. While conservative, there was significant scatter in the results, and very conservative estimates of shear strength were noted for multiple cases.
4.4 Torsional Analysis
4.4.1 Finite Element Analysis
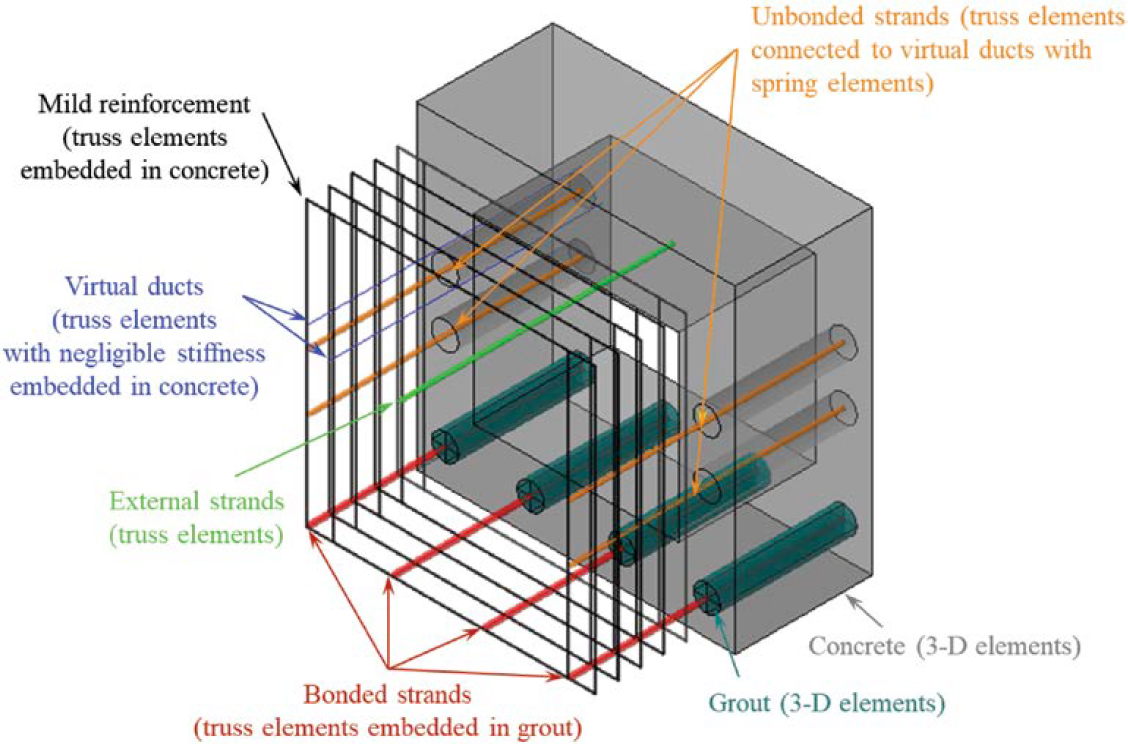
A commercial finite element analysis (FEA) software package, Abaqus (Dassault Systèmes Simulia Corporation 2013), was utilized to perform torsional analysis. A schematic of the models is shown in Figure 4.35. Girder concrete and grout were modeled using linear 3-D hexahedral elements. Nonprestressed reinforcement, such as stirrups and longitudinal mild reinforcement, was modeled using truss elements embedded in concrete elements. Bonded and unbonded strands were modeled using truss elements. For bonded strands, the nodes of the truss elements were tied to the nodes of the surrounding grout, creating perfect bond. For internal unbonded strands, the nodes of the truss elements between anchorages and between deviation points were connected to the nodes of virtual ducts (elements with negligible stiffness embedded in concrete) by rigid spring elements to ensure displacement compatibility. The spring elements were placed every 1 ft along the girder length. Truss elements used to model external strands had nodes only at anchorages and deviation points. The displacements and rotations of these nodes were constrained to those of nodes of the surrounding concrete.
4.4.2 Material Models for FEA
4.4.2.1 Concrete
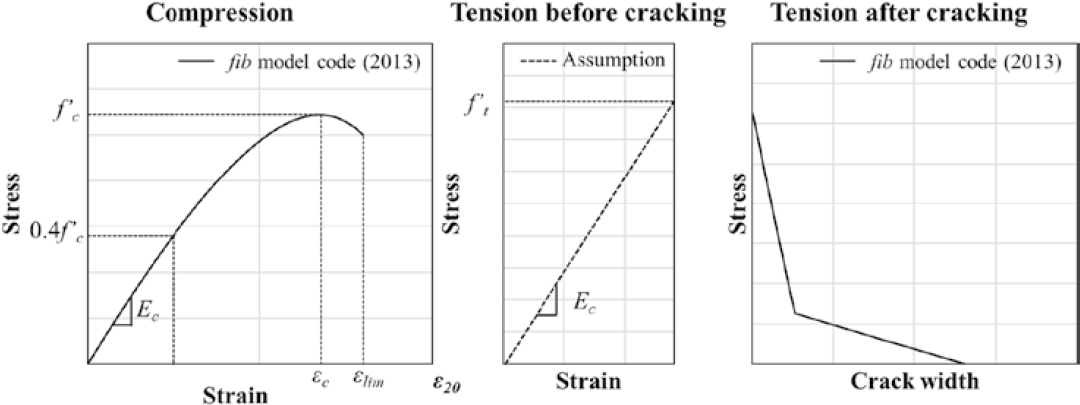
Concrete was modeled using the concrete damaged plasticity model from the Abaqus material library. The stress-strain curve in compression and the stress-crack width curve in tension were
defined according to the fib model code (Fédération internationale du béton 2013) as described in Figure 4.36. Concrete compressive strength, f′c, used for validation and parametric analyses was based on material testing from the experimental investigation. The modulus of elasticity, Ec, compressive strain corresponding to f′c, εc, and compressive strain at the crushing limit, εlim, were calculated according to the fib model code. In tension, concrete behavior up to cracking was assumed to be linear, with Ec assumed to be the same as Ec in compression. The tensile strength of concrete, ft, was taken as 6√f′c (psi).
4.4.2.2 Grout
The material models for grout were assumed to be the same as the material models for concrete except for the compressive and tensile strengths of the grout. The compressive strength of the grout was obtained from tests of cube specimens in the experimental investigation. This cube strength was converted to cylinder strength according to the fib model code. The tensile strength of grout was set to be 3√f′c (psi).
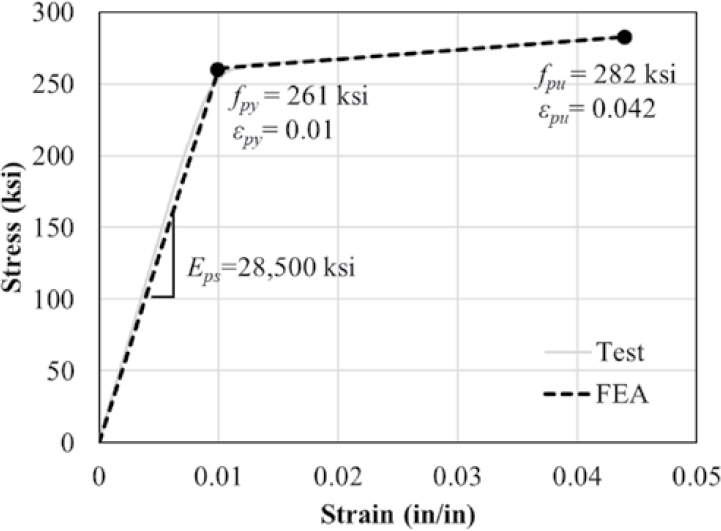
4.4.2.3 Prestressing Strand
Figure 4.37 presents the bi-linear stress-strain relationship used to model the prestressing strand. The yield strength, fpy, and corresponding strain of the strands were selected to be 261 ksi and 1%, respectively, to match the stress-strain curve obtained from testing. The modulus of elasticity, Eps, the ultimate strength, fpu, and the ultimate strain based on tensile testing were 28,500 ksi, 282 ksi, and 4.2%, respectively. Prestressing was introduced to pretensioned and post-tensioned strands as a predefined stress field.
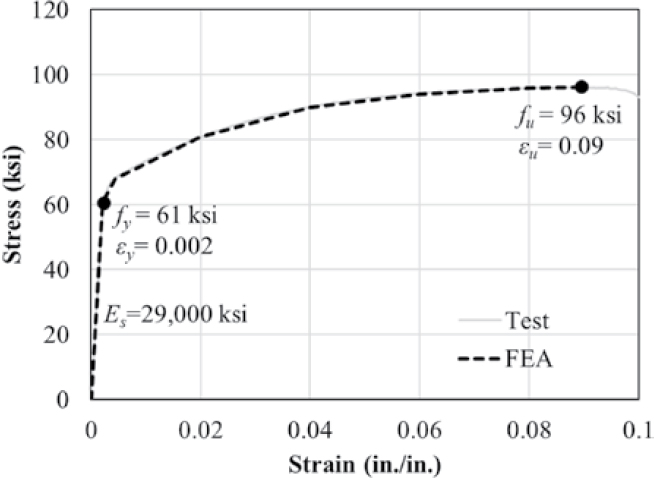
4.4.2.4 Mild Reinforcement
Figure 4.38 presents the multi-linear stress-strain relationship for nonprestressed mild reinforcement used for modeling stirrups. The yield strength, fy; yield strain, εy; ultimate strength, fu; and ultimate strain, εu, were taken as 61 ksi, 0.2%, 96 ksi, and 9%, respectively, based on the average values from stress-strain curves obtained from material testing in the experimental investigation. The modulus of elasticity, Es, was assumed to be 29,000 ksi.
4.4.3 Validation of Modeling Techniques for FEA
The FEA models for torsion were validated using test data from the experimental investigation on Specimens IU-9, IU-10/11, IBU-7, IBE-3, and IEU-3. Half the girder length was modeled applying symmetry boundary conditions at midspan, except for the models of Specimen IU-10/11 which had different stirrup details on each side of the applied loading. Test data used to validate the FEA models included the torque-rotation relationship and the maximum torque. Analysis inputs are provided in Table 4.13. When test data was not available, the effective stress (fpe) was assumed to be 140 ksi based on average strand stresses from the experimental program.
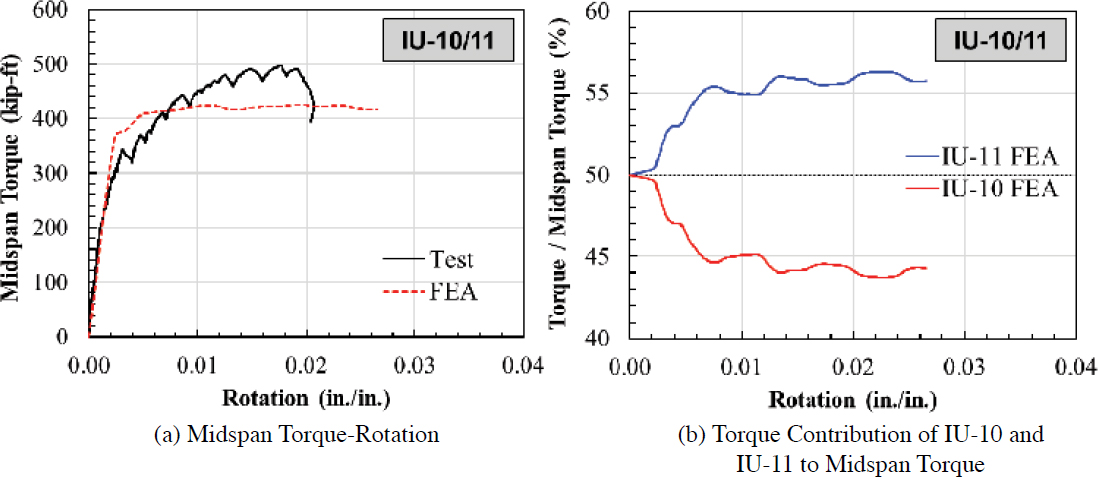
Specimen IU-10/11 was one girder that consisted of two specimens with varying stirrup areas on either side of midspan (Specimens IU-10 and IU-11). The experimental and FEA results are compared for this specimen in Figure 4.39(a) by plotting the applied midspan torque versus rotation. Figure 4.39(a) shows that the maximum applied torque predicted by FEA was 14% smaller than the maximum applied torque from testing. In addition, FEA can predict the fraction of the applied torque resisted by each specimen, IU-10 and IU-11, as shown in Figure 4.39(b). IU-11, which had a tighter stirrup spacing (#3 @ 4 in.), was stiffer than IU-10 (#3 @ 16 in.), resulting in that side of the girder resisting a higher percentage of the applied torsion. The FEA results showed that Specimen IU-11 resisted greater torque (56%) than Specimen IU-10 (44%) after torsional cracking.
The experimental torque-rotation curves for Specimens IU-9, IU-10, IU-11, IBU-7, IBE-3, and IEU-3 are compared to the FEA model results in Figure 4.40. The ratios of the maximum torque obtained from the FEA to the maximum torque from the tests, Tmax (FEA/Test), are also provided. Because FEA indicated that Specimen IU-11 resisted 56% of the applied torque and Specimen IU-10 resisted 44% of the applied torque following torsional cracking, the applied midspan torque
Table 4.13. Model inputs for validation cases.
| Specimen Number | Concrete | Grout | Prestressing Steel | Shear Reinf. | |||||||||||||||
|---|---|---|---|---|---|---|---|---|---|---|---|---|---|---|---|---|---|---|---|
| f′c (ksi) | E (ksi) | ft (psi) | f′c (ksi) | E (ksi) | ft (psi) | fpy (ksi) | Eps (ksi) | ɛpy (%) | ɛpu (%) | fpe | fy (ksi) | E (ksi) | ɛy (%) | ɛu (%) | |||||
| BF (ksi) | BW (ksi) | TW (ksi) | EX (ksi) | ||||||||||||||||
| IU-9 | Top flange | 10.8 | 6,090 | 624 | - | - | - | 261 | 28,500 | 1 | 4.2 | 143 | 140* | 125 | None | 61 | 29,000 | 0.2 | 9 |
| Webs | 10.8 | 6,090 | 624 | ||||||||||||||||
| Bottom flange | 10.2 | 5,974 | 606 | ||||||||||||||||
| IU-10/11 | Top flange | 8.2 | 5,562 | 544 | - | - | - | 261 | 28,500 | 1 | 4.2 | 132 | 142 | 140* | None | 61 | 29,000 | 0.2 | 9 |
| Webs | 8.2 | 5,562 | 544 | ||||||||||||||||
| Bottom flange | 7.4 | 5,372 | 517 | ||||||||||||||||
| IBU-7 | Top flange | 10.9 | 6,107 | 626 | 7.52 | 5,397 | 260 | 261 | 28,500 | 1 | 4.2 | 141 | 146 | 140* | None | 61 | 29,000 | 0.2 | 9 |
| Webs | 8.5 | 5,622 | 553 | ||||||||||||||||
| Bottom flange | 7.7 | 5,428 | 525 | ||||||||||||||||
| IBE-3 | Top flange | 10.9 | 6,107 | 626 | 7.52 | 5,397 | 260 | 261 | 28,500 | 1 | 4.2 | 141 | 141 | 140* | 139 | 61 | 29,000 | 0.2 | 9 |
| Webs | 8.5 | 5,622 | 553 | ||||||||||||||||
| Bottom flange | 7.7 | 5,428 | 525 | ||||||||||||||||
| IEU-3 | Top flange | 11.4 | 6,199 | 640 | - | - | - | 261 | 28,500 | 1 | 4.2 | 140* | 139 | 137 | 140 | 61 | 29,000 | 0.2 | 9 |
| Webs | 11.4 | 6,199 | 640 | ||||||||||||||||
| Bottom flange | 10.4 | 6,009 | 611 | ||||||||||||||||
Abbreviations: BF = Bottom flange strand, BW = Bottom web strand, TW = Top web strand, EX = External strand
*fpe assumed as 140 ksi
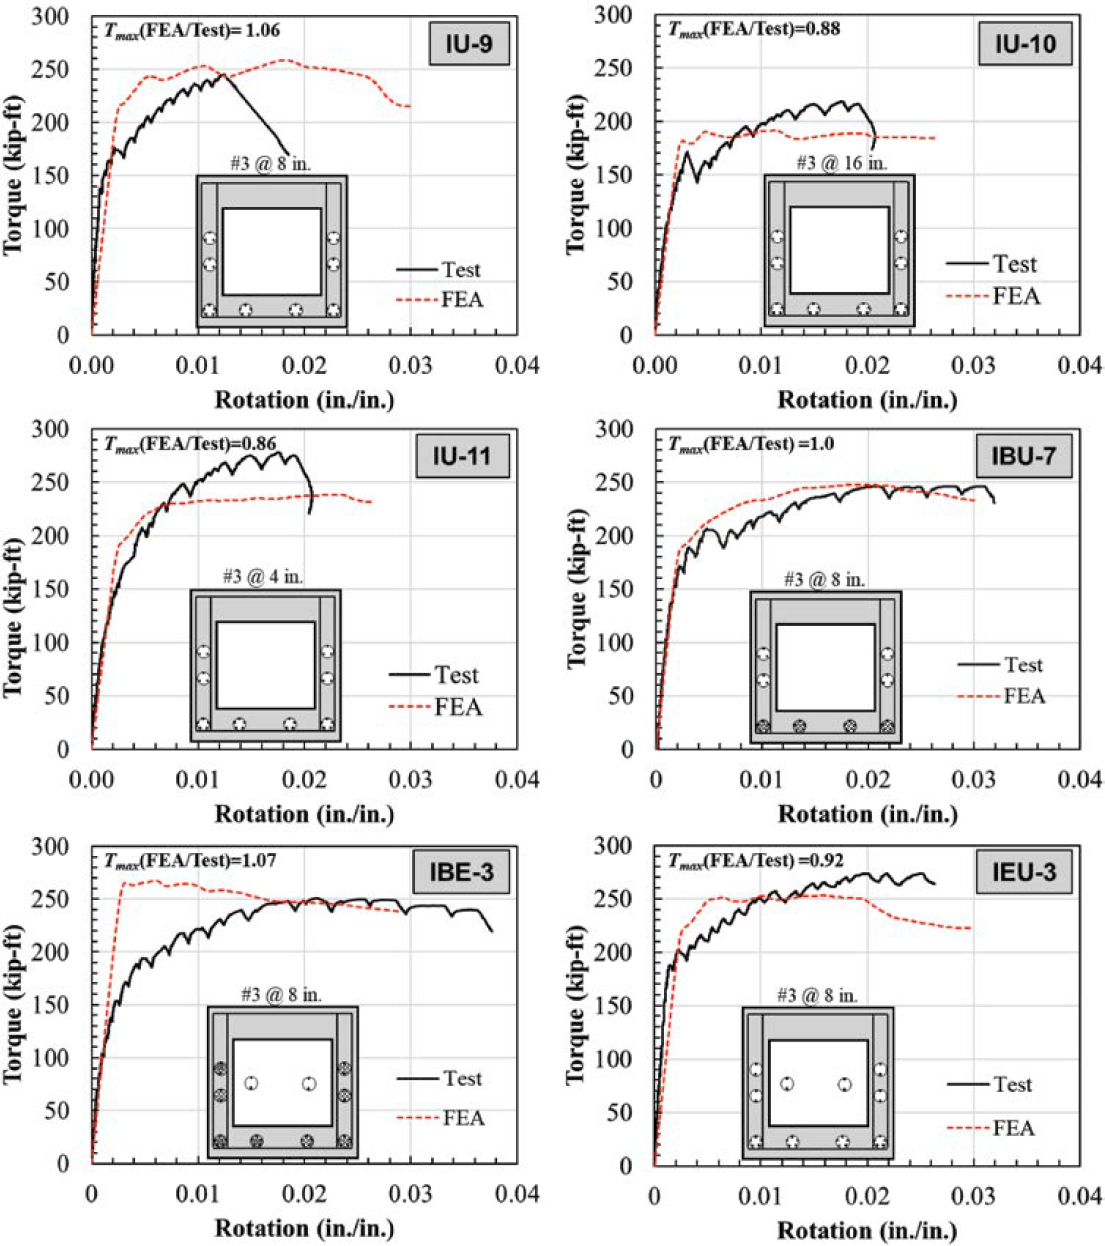
was distributed into torque resisted by IU-10 and IU-11 following torsional cracking using the same fraction (56% and 44%, respectively) in Figure 4.40. For all other specimens, applied midspan torque was distributed evenly (50/50) as both sides of the specimen had equal stiffness.
The average of the ratios, Tmax (FEA/Test), for all specimens was 0.96. In general, the FEA models predicted the initial stiffness and maximum torque reasonably well (except for Tmax for Specimens IU-10 and IU-11), but the rotation at the maximum torque and post-elastic stiffness predicted by FEA were not consistent with the test results.
4.4.4 Parametric Analysis
The FEA models were used to perform parametric analysis. The FEA model inputs along with the cross section, tendon layout, and shear reinforcement used for the parametric analyses were identical to those used for model validation (Table 4.13).
The parametric analysis matrix is provided in Table 4.14. Each group included a baseline model used for validation and an additional model for the parametric study. The additional model is denoted with “P” in Table 4.14. Parameters included the total number of strands for IU cases and the amount of web strands for IBU, IBE, and IEU cases. The total number of strands remained the same for all cases except for the IU case. The parameter receiving focus in each group is highlighted in green.
4.4.4.1 Torsion Analysis Results
Figure 4.41 compares the torque-rotation relationships of the analysis cases of the parametric study. Concrete stresses at the extreme top and bottom fiber of the girders due to prestressing are noted on each plot as σtop,prestressing and σbottom,prestressing. Tensile stresses are positive. For all cases, before the girders reached maximum torque, FEA predicted web cracking near the ducts, top flange cracking, and stirrup yielding near the top flange.
Decreasing the number of unbonded strands by 25% resulted in a 15% decrease in torsion capacity for the IU group. Decreasing the ratio of bonded strand area to total strand area increased the torsion capacity by 11% for the IBU group. The higher capacity is attributed to having a larger strand area in the web, creating a more uniform compression across the cross section. For the IBE and IBU groups, placing strands externally resulted in no change as compared to using internally
Table 4.14. Parametric analysis matrix for torsion.
| Group | Case | Aps,total (in.2) | Internal Flange Reinf. | Internal Web Reinf. | External Reinf. | Apsb/Atotal | ||
|---|---|---|---|---|---|---|---|---|
| No. of Strands | Strand Bond Type | No. of Strands | Strand Bond Type | No. of Strands | ||||
| IU | IU-9 | 5.344 | 20 | Unbonded | 12 | Unbonded | None | 0 |
| IU-9-P | 4.008 | 20 | Unbonded | 4 | Unbonded | None | 0 | |
| IBU | IBU-7 | 5.344 | 20 | Bonded | 12 | Unbonded | None | 0.63 |
| IBU-7-P | 5.344 | 12 | Bonded | 20 | Unbonded | None | 0.38 | |
| IBE | IBE-3 | 5.344 | 20 | Bonded | 8 | Bonded | 4 | 0.88 |
| IBE-3-P | 5.344 | 20 | Bonded | 4 | Bonded | 8 | 0.75 | |
| IEU | IEU-3 | 5.344 | 20 | Unbonded | 8 | Unbonded | 4 | 0.88* |
| IEU-3-P | 5.344 | 20 | Unbonded | 4 | Unbonded | 8 | 0.75* | |
Highlighted cells are parameters receiving focus in each group
*Ratio of internal unbonded strand area to total strand area
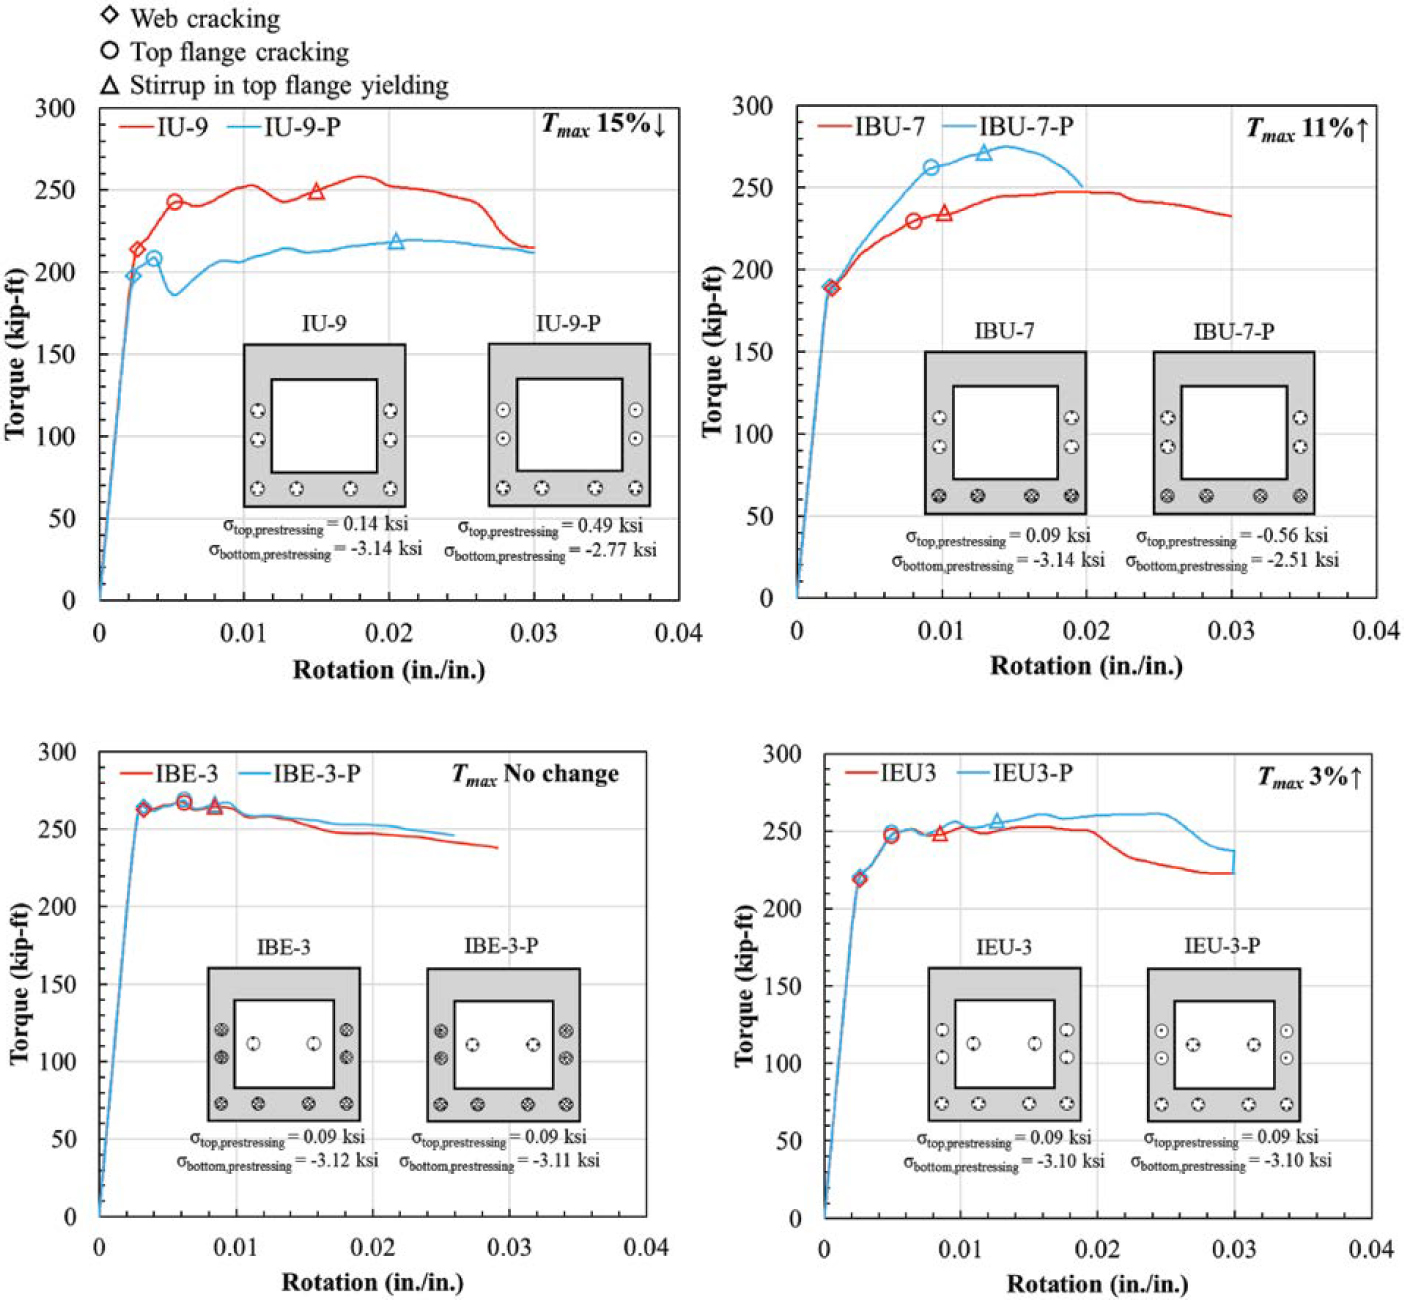
bonded or unbonded strands. These results indicate that limiting the tensile stress across the cross section through prestressing may be beneficial to torsional capacity.
4.4.4.2 Comparison of Torsional Analysis Results with the LRFD BDS
Figure 4.42 compares torsional capacities obtained from the FEA to the capacities calculated according to the LRFD BDS (AASHTO 2020) following Articles 5.7.3.4.2 and 5.7.3.6.2. The angle of diagonal compressive stresses was calculated based on the net tensile strain in the tension longitudinal reinforcement, εs, provided by Eq. 5.7.3.4.2-4 of the LRFD BDS. In this equation, Mu was taken as zero and Vu was calculated as Veff consisting of the factored shear force and applied torsional moment terms. The value of fpo was assumed to be 140 ksi. In calculating fpo by accounting for strands on the flexural tension side of the section, strands located at the centroid of the cross section were excluded. The nominal torsional capacity was calculated through iterations by solving LRFD BDS Eq. 5.7.3.4.2-4 and Eq. 5.7.3.6.2-1 together for Tu and Tn.
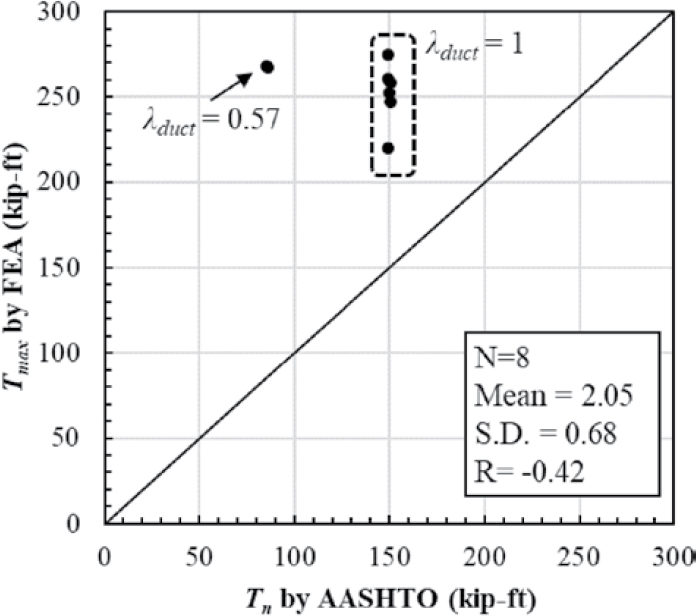
In Figure 4.42, the 45-degree line indicates perfect correlation between the predictions by the FEA and the LRFD BDS (AASHTO 2020). The number of analyses, mean of the ratio of predicted capacities to AASHTO calculated capacities, the SD of this ratio, and the correlation coefficient (R) are presented in the plots. The predictions by the LRFD BDS were conservative for all cases (above the 45-degree line). The use of λduct values smaller than 1.0 led to significant overprediction of capacity by the LRFD BDS.
4.4.4.3 Torsional Analysis Conclusions
The following are the conclusions from the analytical investigation for torsion:
- Analyses indicated that web cracking, top flange cracking, and stirrup yielding near the top flange occurred before the girders reached the torsional capacity.
- Having a higher bonded strand area to total strand area did not increase the torsional capacity. Instead, the capacity increased when prestressing limited tension at the extreme tension fiber.
- The LRFD BDS (AASHTO 2020) provided very conservative estimates of torsional capacity. Excessive conservatism was observed with the use of the λduct factor.


