Considerations for the Design and Construction of Bonded and Unbonded Post-Tensioned Concrete Bridge Elements (2025)
Chapter: 3 Experimental Investigations
CHAPTER 3
Experimental Investigations
3.1 Introduction
The experimental investigation included two test series conducted at Purdue University’s Bowen Laboratory. The first test series (Test Series 1) consisted of 38 tests on girder specimens of moderate scale. The results of these tests were analyzed to develop an understanding of the behavior, strengths, and mechanics of bridge elements with unbonded tendons, a combination of unbonded and bonded internal tendons, or a combination of unbonded or bonded internal tendons and unbonded external tendons. The second test series (Test Series 2) consisted of four tests on full-scale girder specimens to ensure that the observations from the first test series were consistent with the behavior of members representative of bridge girders in the field.
3.2 Materials
3.2.1 Concrete
The concrete mixture design used for all specimens in Test Series 1 and Test Series 2 is provided in Table 3.1. The concrete was a self-consolidating mixture with a target compressive strength of 8 ksi, a desired spread of 26 in. ± 5.5 in., and a design water-to-concrete ratio of 0.33. The high-range water reducer and water content were adjusted to achieve the desired spread. The total quantity of concrete produced was 4,024 lbs, with a volume of 27.0 ft3.
Sets of three 4 in. × 8 in. cylinders were used to determine the compressive and splitting tensile strength of the concrete. Testing was conducted in accordance with ASTM C39 (ASTM n.d.-e).
3.2.2 Grout
Specimens with bonded tendons were required to be grouted. BASF Masterflow 1205, a prepackaged grout product that meets ASTM C1107 (ASTM n.d.-i), was selected to grout the bonded tendons. Material testing in accordance with ASTM C939 (ASTM n.d.-g) as modified by PTI M55.1-19 Section 4.4.7, ASTM C942, and ASTM C109 was used to determine the wet properties and the compressive strength of the grout.
3.2.3 Prestressing Steel
Three types of ASTM A416 (ASTM n.d.-b) prestressing steel were used throughout the experimental program. Specimens designed to be tested in flexure were reinforced with 0.5 in. prestressing strand. Specimens in Test Series 1 that were designed to be tested in shear and torsion were reinforced with 0.5 in. special prestressing strand. For Test Series 2, the specimens consisted of 0.6 in. pre-tensioned strand in the bottom flanges and 0.5 in. special strand in the
Table 3.1. Concrete mix design material quantities.
| Materials | Type | S.G.* | Quantity (lbs) | Volume (ft3) |
|---|---|---|---|---|
| Cement | Type 1 | 3.15 | 940 | 4.78 |
| Coarse Aggregate | 3/8” Pea Gravel | 2.67 | 1,442 | 8.66 |
| Fine Aggregate | Natural Sand | 2.65 | 1,332 | 8.06 |
| Water | Water | 1.00 | 310 | 4.97 |
| High-Range Water Reducer | MasterGlenium 7511 | - | 11 oz/cwt | 0.00 |
| Viscosity Modifier | MasterMatrix VMA 358 | - | 4 oz/cwt | 0.00 |
| Air | Entrapped | - | - | 0.54 |
*Specific gravity
post-tensioned web tendons. All strands of a given size were obtained from the same spool and heat of steel.
Material testing was performed on samples of the prestressing strand in accordance with ASTM A1061 and consistent with ASTM A416 to determine the stress-strain behavior of the prestressing strand. Digital image correlation (DIC) was used to measure the strain in the samples as they were loaded to failure. A summary of the material properties of the three strand sizes is provided in Table 3.2, and a representative stress-strain relationship for each strand size is shown in Figure 3.1.
Table 3.2. Prestressing strand properties.
| Strand | Type | Modulus of Elasticity (ksi) | Yield Stress (ksi) | Ultimate Stress (ksi) | Ultimate Strain (%) |
|---|---|---|---|---|---|
| ½” | ASTM A416 | 29,000 | 253 | 281 | 4.0 |
| ½” Special | ASTM A416 | 29,000 | 253 | 282 | 3.7 |
| 0.6” | ASTM A416 | 29,000 | 251 | 279 | 4.2 |
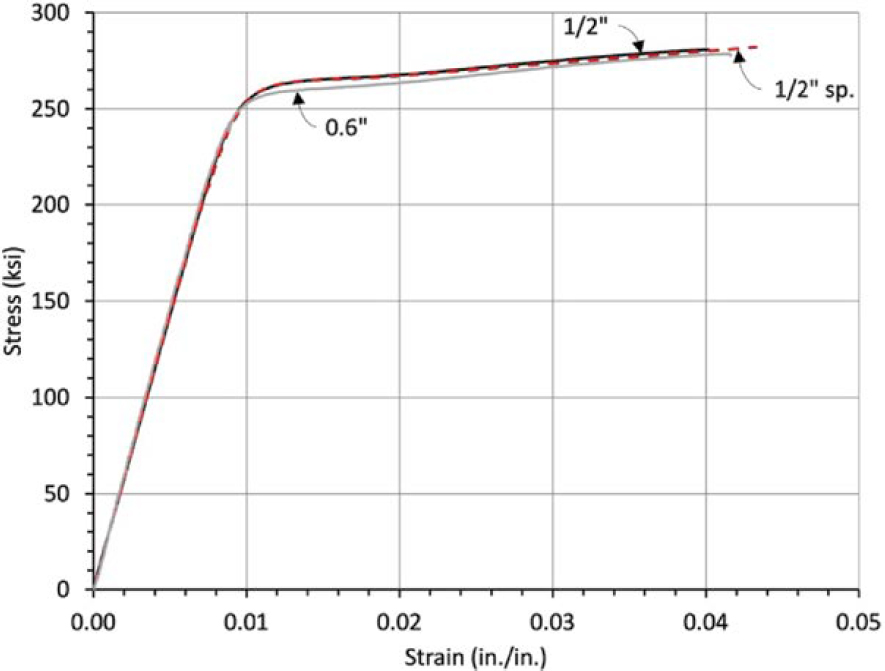
Table 3.3. Ramberg-Osgood Approximations for Strands.
| Equation: | ||
| Coefficients | ½” and ½” Special | 0.6” |
| A | 0.025 | 0.024 |
| B | 112 | 113 |
| C | 10 | 11 |
| Modulus of Elasticity, E | 29,000 | 29,000 |
The stress-strain relationship for each of the prestressing strands was approximated using the Ramberg-Osgood function. The equation and coefficients corresponding to each of the strand types are shown in Table 3.3.
3.2.4 Mild Reinforcement
Multiple orders of ASTM A615 Grade 60 steel were used to cast the specimens. Table 3.4 indicates which group of steel corresponds with each specimen. Each reinforcing bar size within a group was manufactured from the same heat of steel. Tensile tests were performed to determine the stress-strain behavior of the reinforcing steel located in the typical sections of the experimental specimens. Material testing was performed on samples of reinforcing bars in accordance with ASTM A370 and consistent with ASTM A615 to determine the stress-strain behavior of the prestressing strand. DIC was used to measure the strain in the samples as they were loaded to failure. A summary of the yield and failure stresses for each bar type is provided in Table 3.5. Representative stress-strain curves for all reinforcing bars are presented in Figure 3.2 through Figure 3.5.
3.2.5 Post-tensioning Ducts
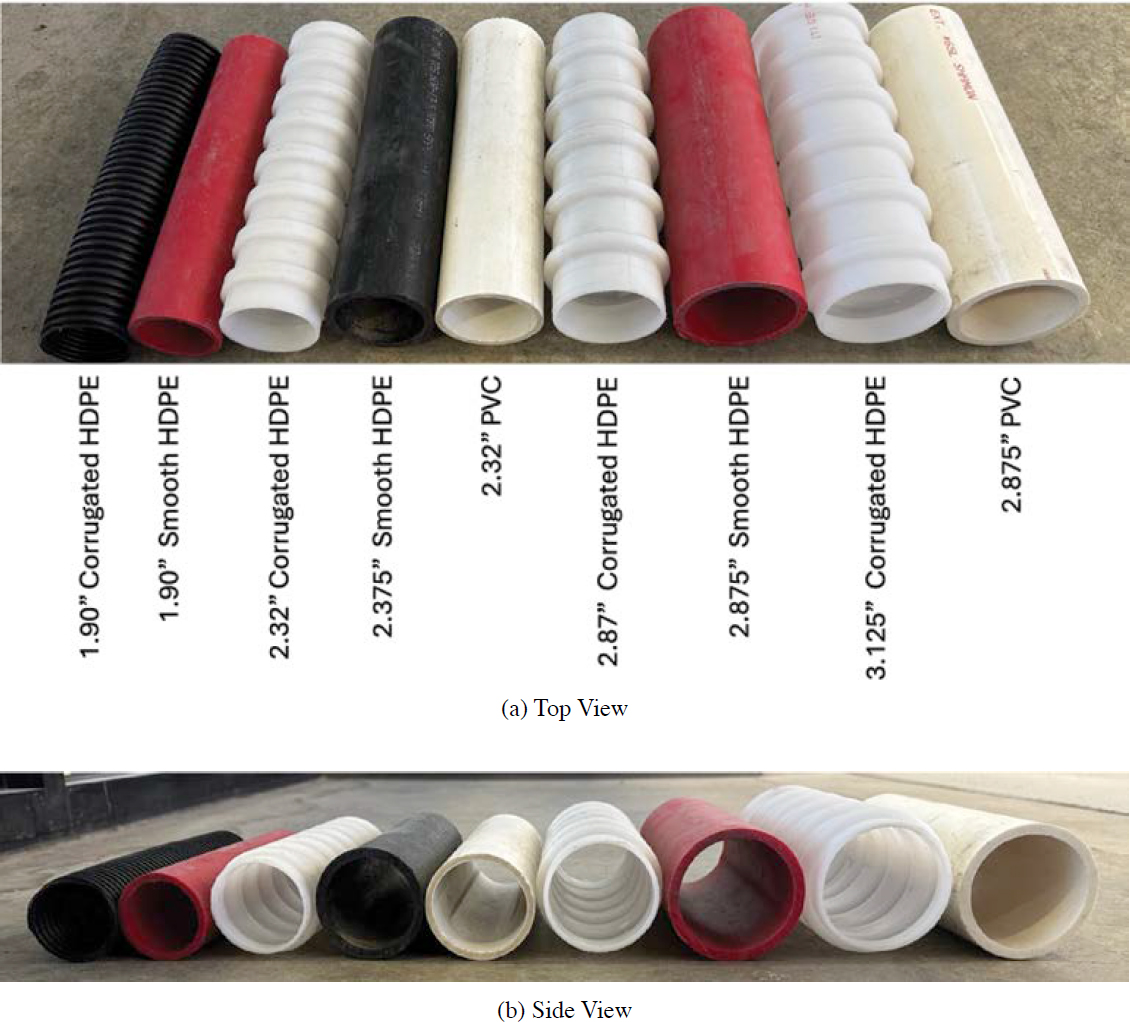
Various duct sizes and materials were selected to achieve the desired duct diameter to web width ratios and replicate the materials used in the post-tensioning industry if the size required was available. Table 3.6 lists the duct sizes and materials used for the experimental investigation and Figure 3.6 shows a sample of each duct type and size. For Test Series 1 (TS1), smooth ducts were used for unbonded tendons, and corrugated ducts were used for bonded tendons. For Test Series 2 (TS2), smooth ducts were used for unbonded tendons, and corrugated ducts were used in the girder that was first tested as an unbonded case, later grouted, and subsequently tested as a bonded specimen.
Table 3.4. Heats of steel and corresponding specimens.
| Order 1 #3, #4, #5 bars | Order 2 #3, #4, #5 bars | Order 3 #3, #4 bars | Order 4 #3, #4, #5, #6 bars | |||
|---|---|---|---|---|---|---|
| IU-0 | IB-0 | IU-4/5 | IBU-2 | IBE-1 | IU-9 | B-3-12 |
| IU-1/2 | IB-2 | IU-6 | IBU-1/3 | IBE-2 | IU-10/11 | U-3-12 |
| IU-3 | IB-1/3 | IU-7 | IBU-4/5 | IBE-4 | IBE-7 | U-3-24 |
| IBU-8 | IB-4/5 | IU-8 | IBU-6 | IEU-1 | IBE-3 | U-4-24 |
| IEU-2 | IU-12 | IBU-8 | IEU-4 | IEU-3 | ||
| IU-13 | IBU-9 | |||||
| IBU-10 | ||||||
Table 3.5. Material properties of reinforcing bars.
| Material | Type | Yield Strength (ksi) | Tensile Strength (ksi) | |
|---|---|---|---|---|
| #3 | Order 1 | ASTM A615 Grade 60 | 76.4 | 95.3 |
| Order 2 | ASTM A615 Grade 60 | 63.3 | 81.9 | |
| Order 3 | ASTM A615 Grade 60 | 68.0 | 96.1 | |
| Order 4 | ASTM A615 Grade 60 | 69.2 | 103.2 | |
| #4 | Order 1 | ASTM A615 Grade 60 | 66.5 | 101.3 |
| Order 2 | ASTM A615 Grade 60 | 68.1 | 103.3 | |
| Order 3 | ASTM A615 Grade 60 | 68.8 | 106.3 | |
| Order 4 | ASTM A615 Grade 60 | 79.5 | 98.0 | |
| #5 | Order 1 | ASTM A615 Grade 60 | 66.8 | 101.9 |
| Order 2 | ASTM A615 Grade 60 | 67.0 | 103.4 | |
| #6 | Order 4 | ASTM A615 Grade 60 | 81.3 | 101.1 |
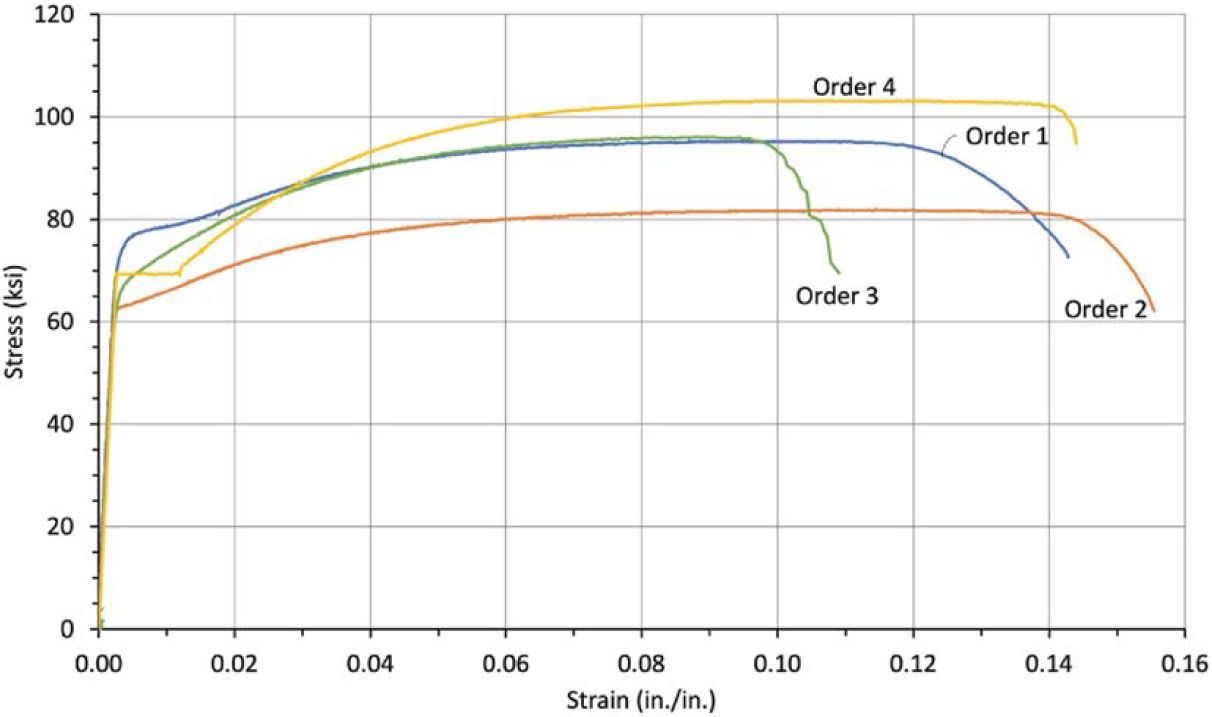
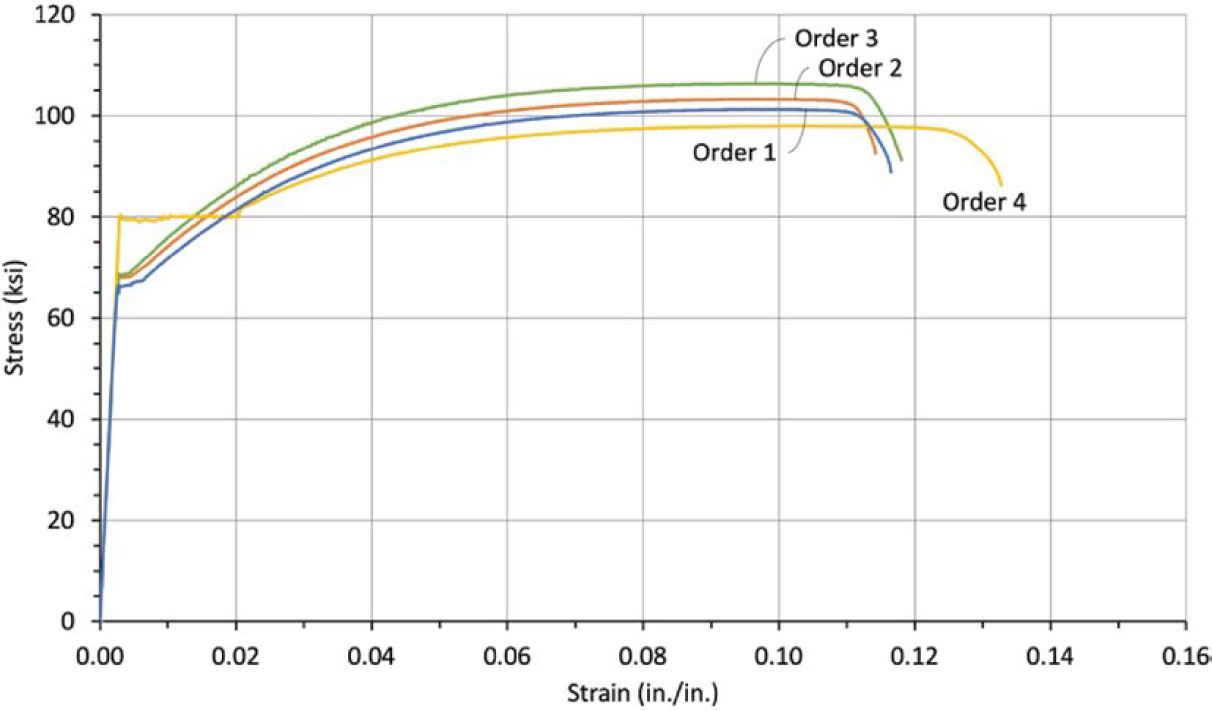
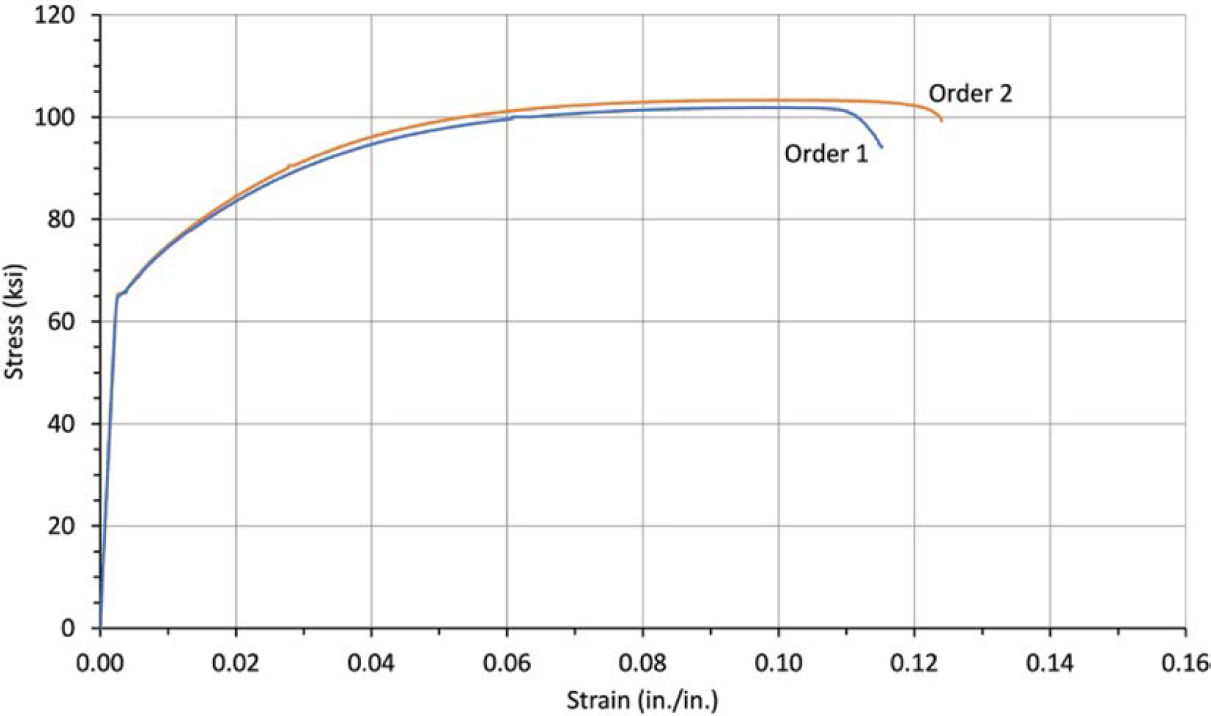

Table 3.6. Duct sizes and materials.
| Duct Type | Outside Diameter (in.) | Material | Use Case |
|---|---|---|---|
| Smooth | 1.900 | High-density polyethylene (HDPE) standard dimension ratio (SDR)-13.5 | TS1 – small web ducts |
| 2.375 | HDPE SDR-13.5 | TS1 – medium web ducts TS1 – bottom flange ducts | |
| 2.875 | HDPE schedule (SCH)-40 | TS1 – large web ducts TS1 – external ducts | |
| 2.375 | Polyvinyl chloride (PVC) drainage, waste, and venting (DWV) Foam Core | TS1 – external ducts | |
| 2.875 | PVC SCH-40 | TS2 – web ducts | |
| Corrugated | 1.900 | HDPE | TS1 – small web ducts |
| 2.32 | HDPE | TS1 – medium web ducts TS1 – bottom flange ducts | |
| 2.87 | HDPE | TS1 – large web ducts | |
| 3.125 | HDPE | TS2 – web ducts |
3.3 Test Series 1
The experimental investigation included flexural, shear, and torsion tests on the beam specimens. The specimens were designed to produce the desired failure mechanism and included the following variables:
- Tendon bond (bonded or unbonded)
- Tendon location (internal or external)
- Member type (bulb tee girder or box girder)
- Transverse reinforcement ratio, ρv
- Duct diameter to web-width ratio, ϕduct/bw
- Number of ducts located in a member web (no ducts to three ducts)
- Ratio of bonded to total prestressed reinforcement for flexural specimens
- Level of prestressing force for flexural specimens
- Ratio of internal to external prestressed reinforcement for shear specimens
3.3.1 Specimen Design
The girder specimens in the first test series (Test Series I) were 28 in. deep with varied lengths. The specimens consisted of two member types: I-shaped girders and box girders. The typical cross-sections of the two types of members are shown in Figure 3.7. The cross section of the I-shaped girders is based on a general shape of a bulb tee bridge girder. The top flange is relatively thicker than a typical precast bulb tee girder to model the effects of a deck cast on the beams and to provide sufficient flexural capacity. The box girder specimens were designed to have a simple cross section that leads to behaviors representative of typical hollow beam sections used in bridge construction. The location of prestressed reinforcement varied between the specimens, but all strand and tendon profiles for the Test Series 1 specimens were straight. Straight strands and tendons were selected so that the influence on shear performance can be clearly understood. The specimens were divided into five distinct groups: IB (Internal Bonded), IU (Internal Unbonded), IBU (Internal Bonded and Internal Unbonded), IBE (Internal Bonded and External Unbonded), IEU (Internal Unbonded and External Unbonded). The general details for each test specimen are provided in Table 3.7. The design drawings for each specimen are included in Appendix A, which
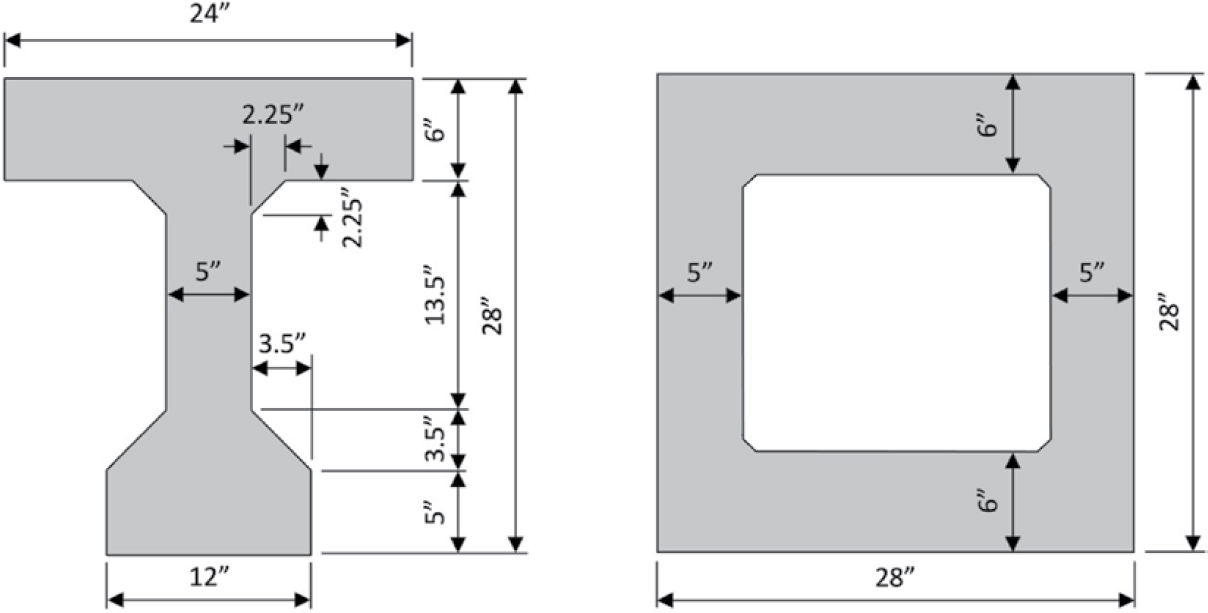
Table 3.7. Test matrix for Test Series 1.
| Specimen | Test Type | Member Type | Transverse Reinf. Ratio | Duct Diameter to Web Width Ratio | Internal Strand Bond Type, Bottom Flange | Internal Strand Bond Type, Web | External Strand Bond Type |
|---|---|---|---|---|---|---|---|
| IB-0 | V | I-shape | None | None | B | - | - |
| IB-1 | V | I-shape | 0.55 | 0.38 | B | B | - |
| IB-2 | V | I-shape | 0.55 | 0.47 | B | B | - |
| IB-3 | V | I-shape | 0.55 | 0.58 | B | B | - |
| IB-4 | V | I-shape | 0.275 | 0.47 | B | B | - |
| IB-5 | V | I-shape | 1.1 | 0.47 | B | B | - |
| IU-0 | V | I-shape | None | None | U | U | - |
| IU-1 | V | I-shape | 0.55 | 0.38 | U | U | - |
| IU-2 | V | I-shape | 0.55 | 0.47 | U | U | - |
| IU-3 | V | I-shape | 0.55 | 0.58 | U | U | - |
| IU-4 | V | I-shape | 0.275 | 0.47 | U | U | - |
| IU-5 | V | I-shape | 1.1 | 0.47 | U | U | - |
| IU-6 | V | I-shape | 0.55 | 0.47 | U | U | - |
| IU-7 | V | I-shape | 0.55 | 0.47 | U | U | - |
| IU-8 | V | I-shape | 0.55 | 0.47 | U | U | - |
| IU-9 | T | Box | 0.55 | 0.47 | U | U | - |
| IU-10 | T | Box | 0.275 | 0.47 | U | U | - |
| IU-11 | T | Box | 1.1 | 0.47 | U | U | - |
| IU-12 | M | I-shape | N/A | None | U | - | - |
| IU-13 | M | I-shape | N/A | None | U | - | - |
| IBU-1 | V | I-shape | 0.55 | 0.38 | B | U | - |
| IBU-2 | V | I-shape | 0.55 | 0.47 | B | U | - |
| IBU-3 | V | I-shape | 0.55 | 0.58 | B | U | - |
| IBU-4 | V | I-shape | 0.275 | 0.47 | B | U | - |
| IBU-5 | V | I-shape | 1.1 | 0.47 | B | U | - |
| IBU-6 | V | Box | 0.55 | 0.528 | B | U | - |
| IBU-7 | T | Box | 0.55 | 0.546 | B | U | - |
| IBU-8 | M | I-shape | N/A | None | B and U | - | - |
| IBU-9 | M | I-shape | N/A | None | B and U | - | - |
| IBU-10 | M | I-shape | N/A | None | B and U | - | - |
| IBE-1 | V | Box | 0.55 | 0.47 | B | B | U |
| IBE-2 | V | Box | 0.55 | 0.47 | B | B | U |
| IBE-3 | T | Box | 0.55 | 0.47 | B | B | U |
| IBE-4 | M | Box | N/A | None | B | - | U |
| IEU-1 | V | Box | 0.55 | 0.47 | U | U | U |
| IEU-2 | V | Box | 0.55 | 0.47 | U | U | U |
| IEU-3 | T | Box | 0.55 | 0.47 | U | U | U |
| IEU-4 | M | Box | N/A | None | U | - | U |
Test Type: V = Shear, M = Flexure, T = Torsion
Bond Type: B = Bonded, U = Unbonded
Specimen Nomenclature: IB (Internal Bonded), IU (Internal Unbonded), IBU (Internal Bonded and Internal Unbonded), IBE (Internal Bonded and External Unbonded), IEU (Internal Unbonded and External Unbonded)
can be found on the National Academies Press website (nap.nationalacademies.org) by searching for NCHRP Web-Only Document 417: Background and Resources for the Design and Construction of Bonded and Unbonded Post-Tensioned Concrete Bridge Elements.
3.3.2 Specimen Construction
Each specimen was fabricated at Purdue University’s Bowen Laboratory. For specimens with only post-tensioned strands, steel reinforcing cages were constructed in a staging area shown in Figure 3.8 for the I-shaped and box-shaped specimens. Foam was used to create the void in the box section. High-density overlay plywood sheets and dimensional lumber were used to
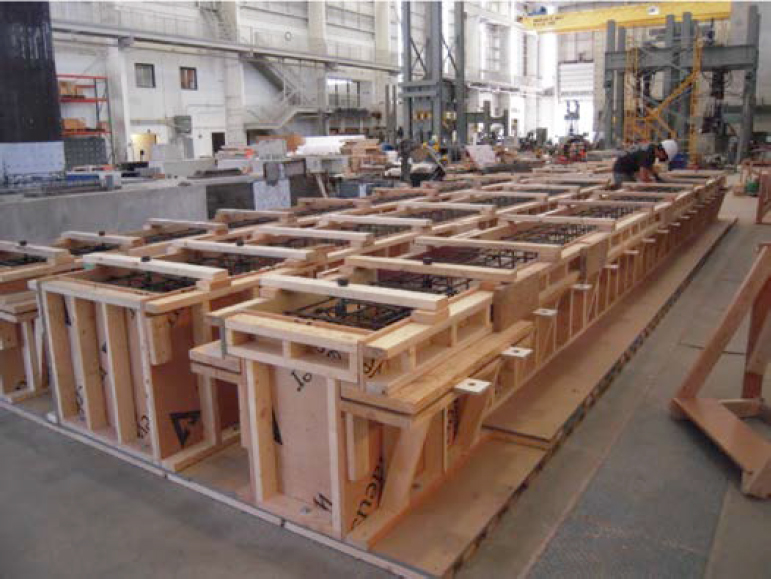
construct the formwork for each cross section. After the reinforcing cages were complete, the formwork was installed, and the concrete was cast.
For specimens with pretensioned strands, the beams were constructed in a prestressing bed. Following construction of the reinforcing cage and installation of the strands, the formwork was assembled. The pretensioned strands were subsequently stressed before casting. The completed reinforcing cage and formwork assembly for a pretensioned specimen are shown in Figure 3.9. The pretensioned strands were torch-cut approximately 7 days after casting the specimens and after the concrete had a compressive strength of approximately 8 ksi.
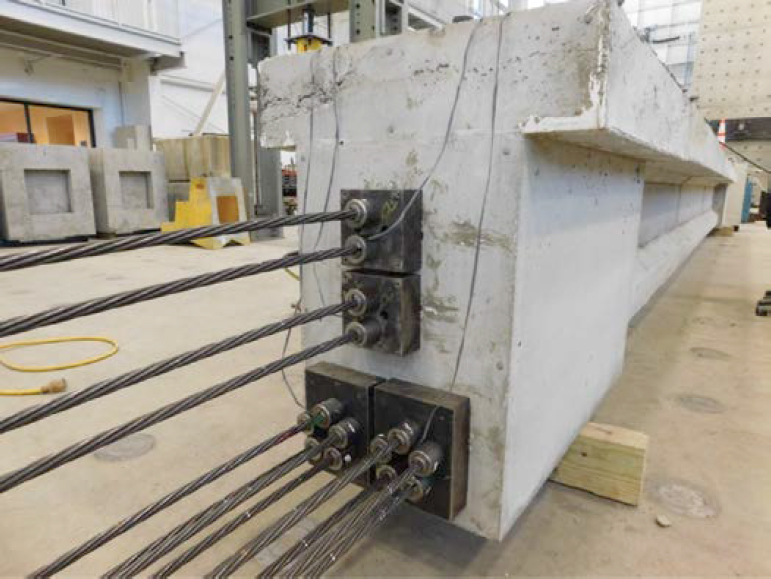
Following the removal of formwork, the specimens were prepared for post-tensioning. Strands were fed through the post-tensioning ducts and secured with anchor plates and single-use post-tensioning chucks. The typical anchorage assembly is shown in Figure 3.10. The strands were stressed using a monostrand post-tensioning jack.

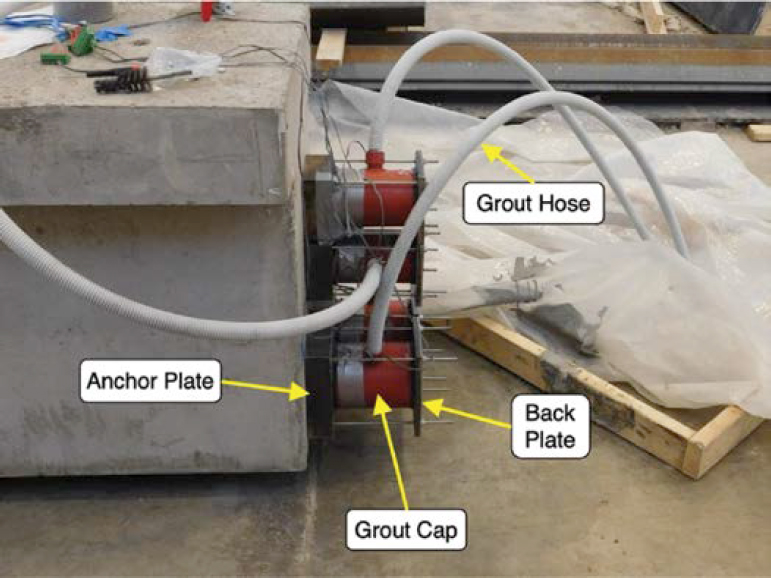
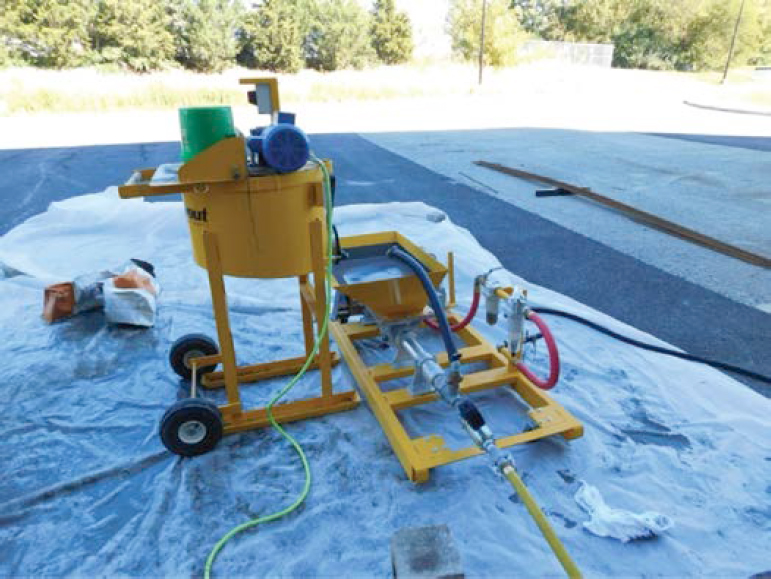
The anchorages were prepared for grouting after the post-tensioning operation was complete for specimens with bonded post-tensioned tendons. The typical grout assembly is shown in Figure 3.11. The excess strand was removed from the dead and live ends of the specimen to allow for the installation of the grout cap and inlets/outlets. Grout was mixed in a grout paddle mixer and was pumped using a progressive cavity grout pump (Figure 3.12). Grout was injected through the inlet on one end of the post-tensioned tendon and allowed to flow out of the outlet on the opposite end. After grout had flowed through the outlet, the valves were closed. This process continued until all tendons had been grouted.
3.3.3 Flexure
Seven specimens were designed and tested in flexure. This section describes the details and results of the tests.
3.3.3.1 Specimen Design
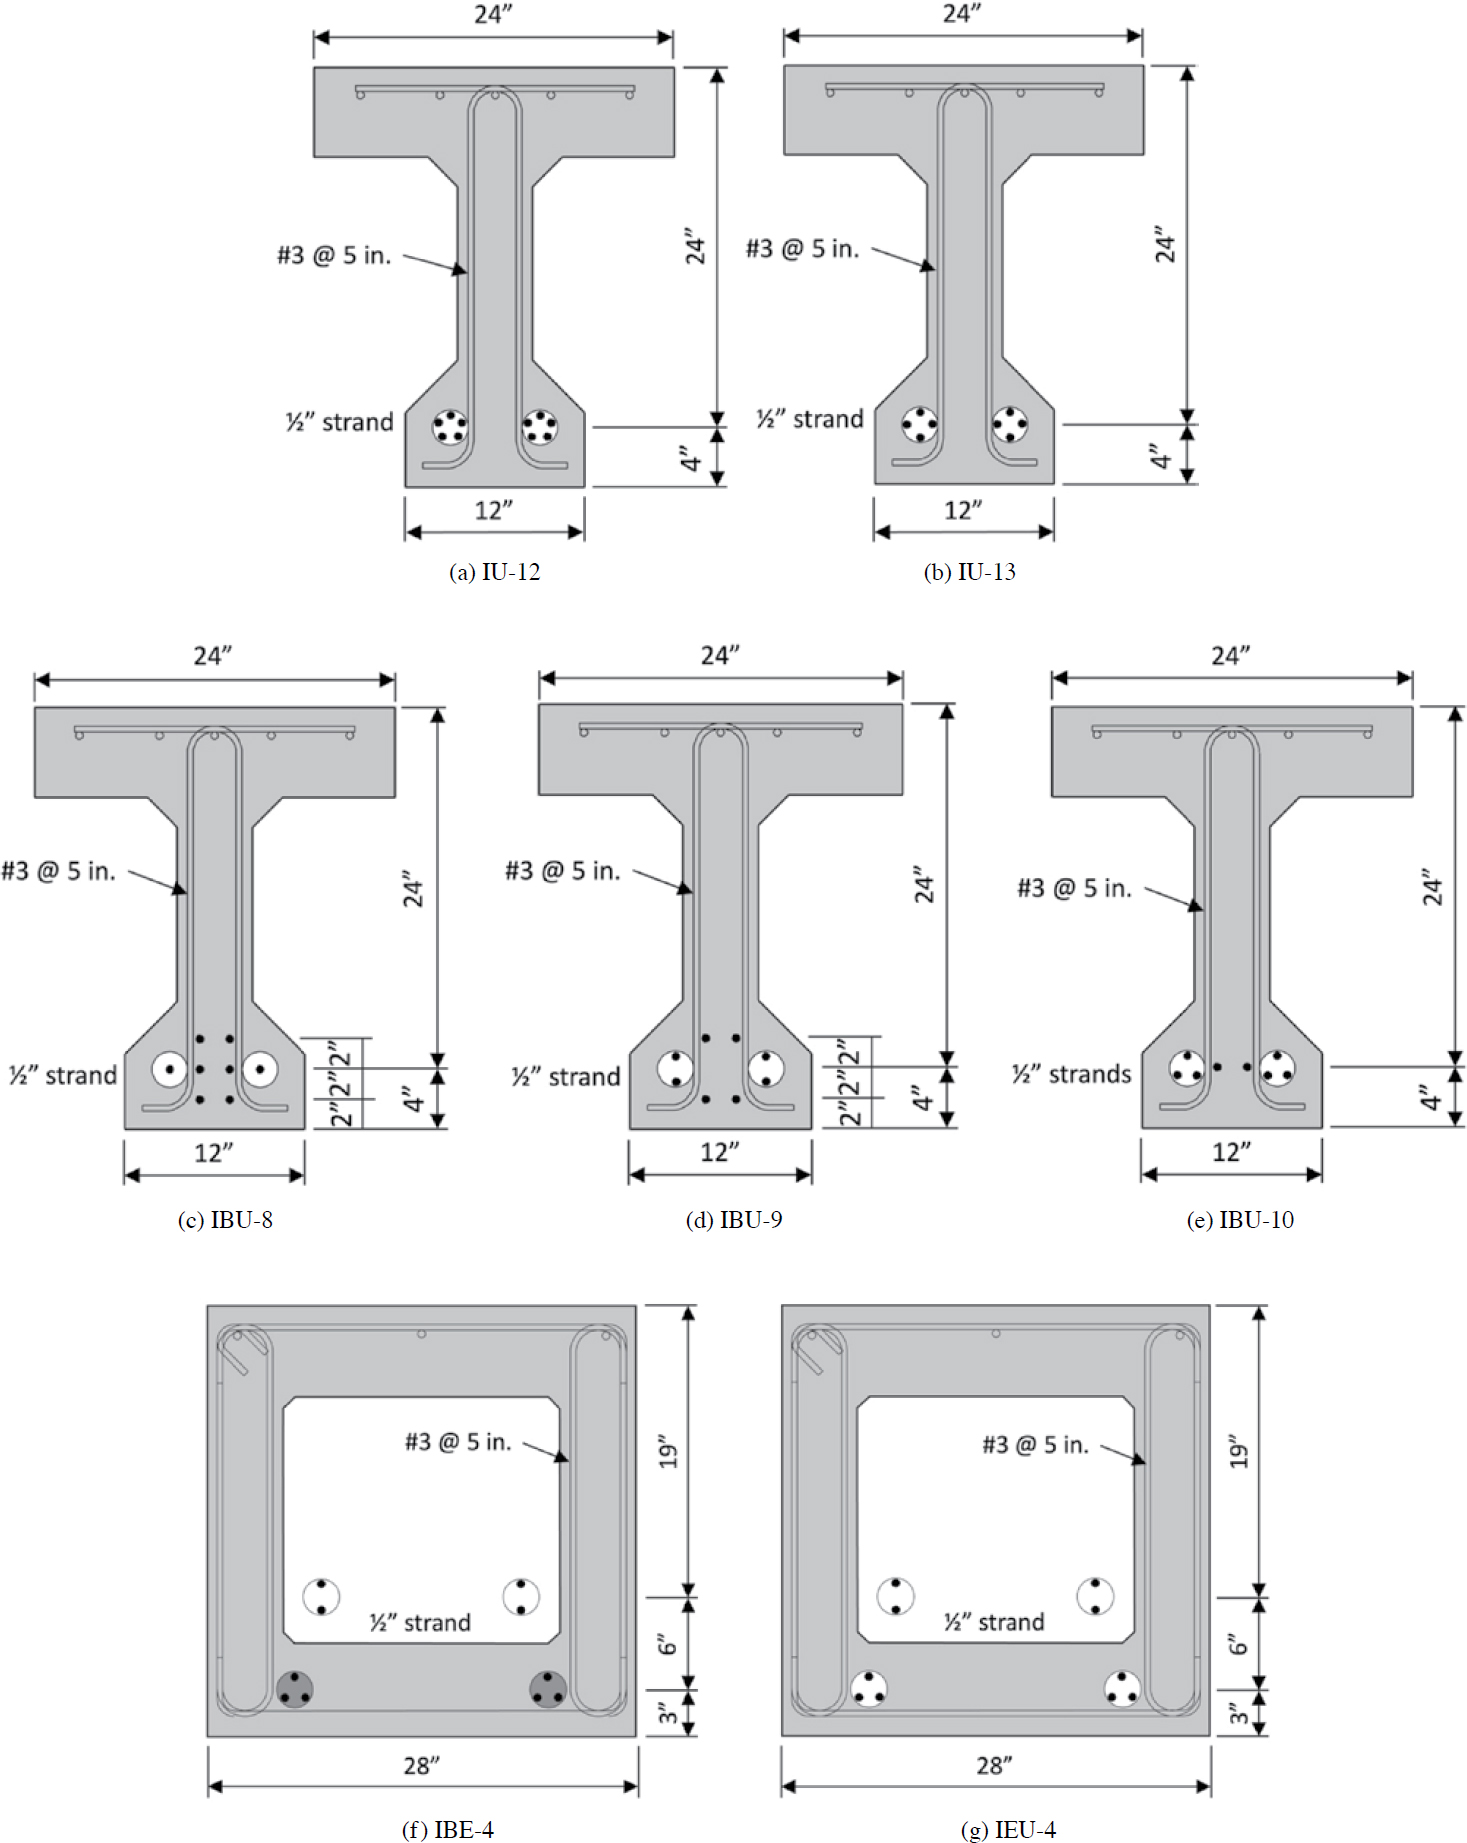
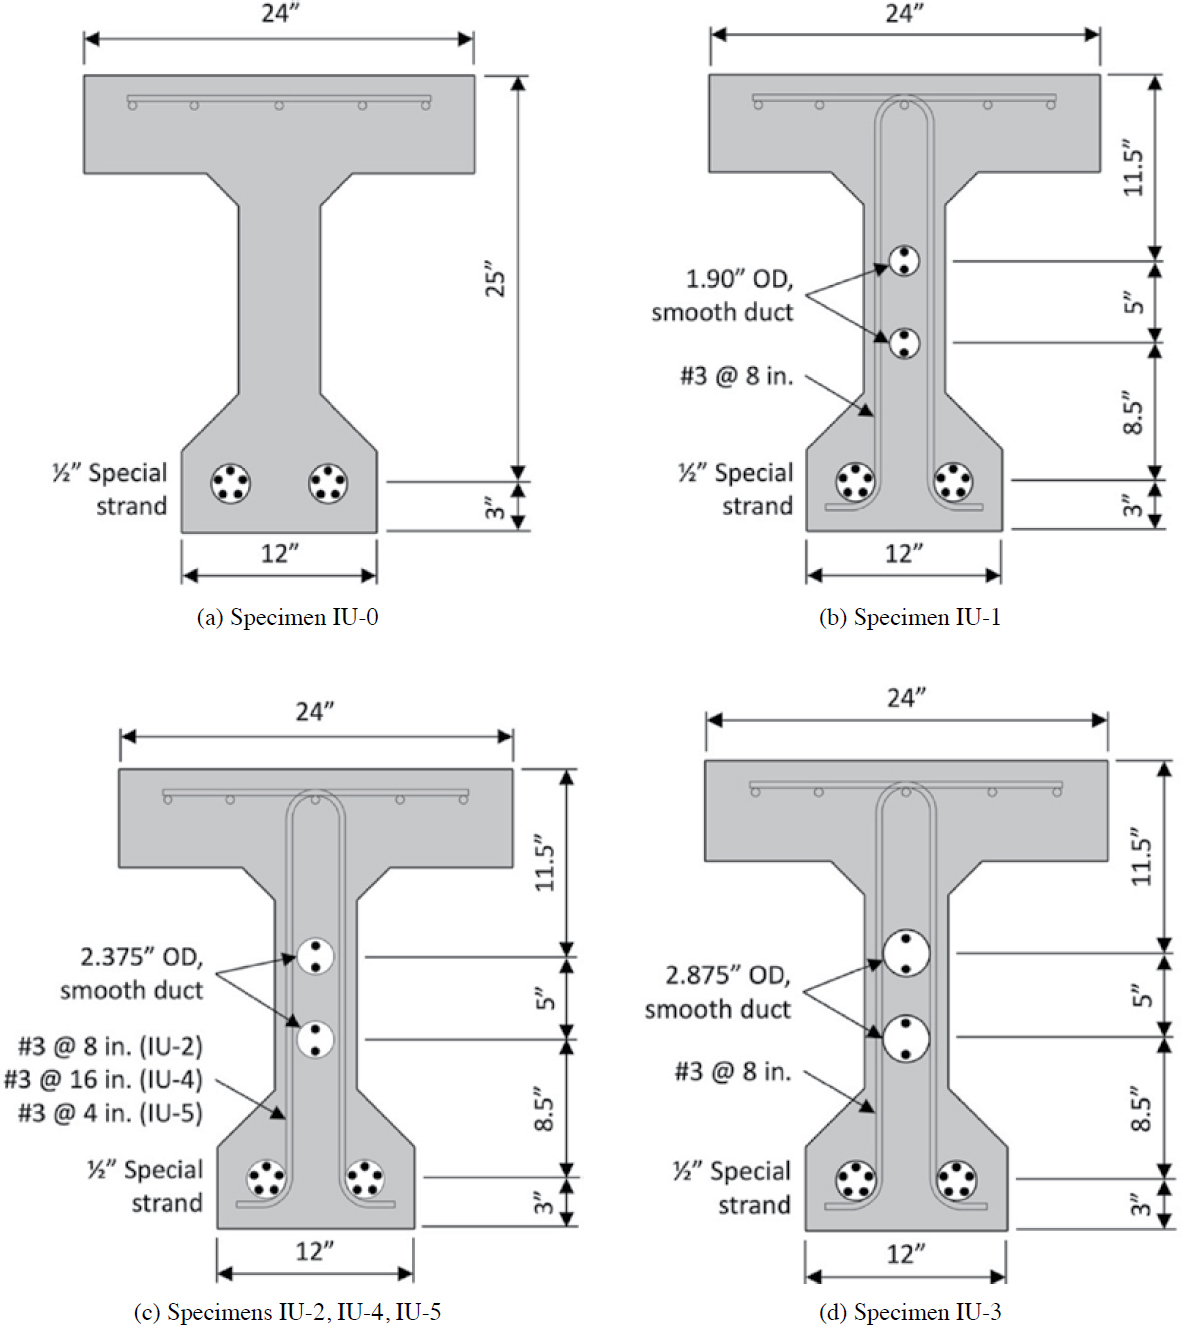
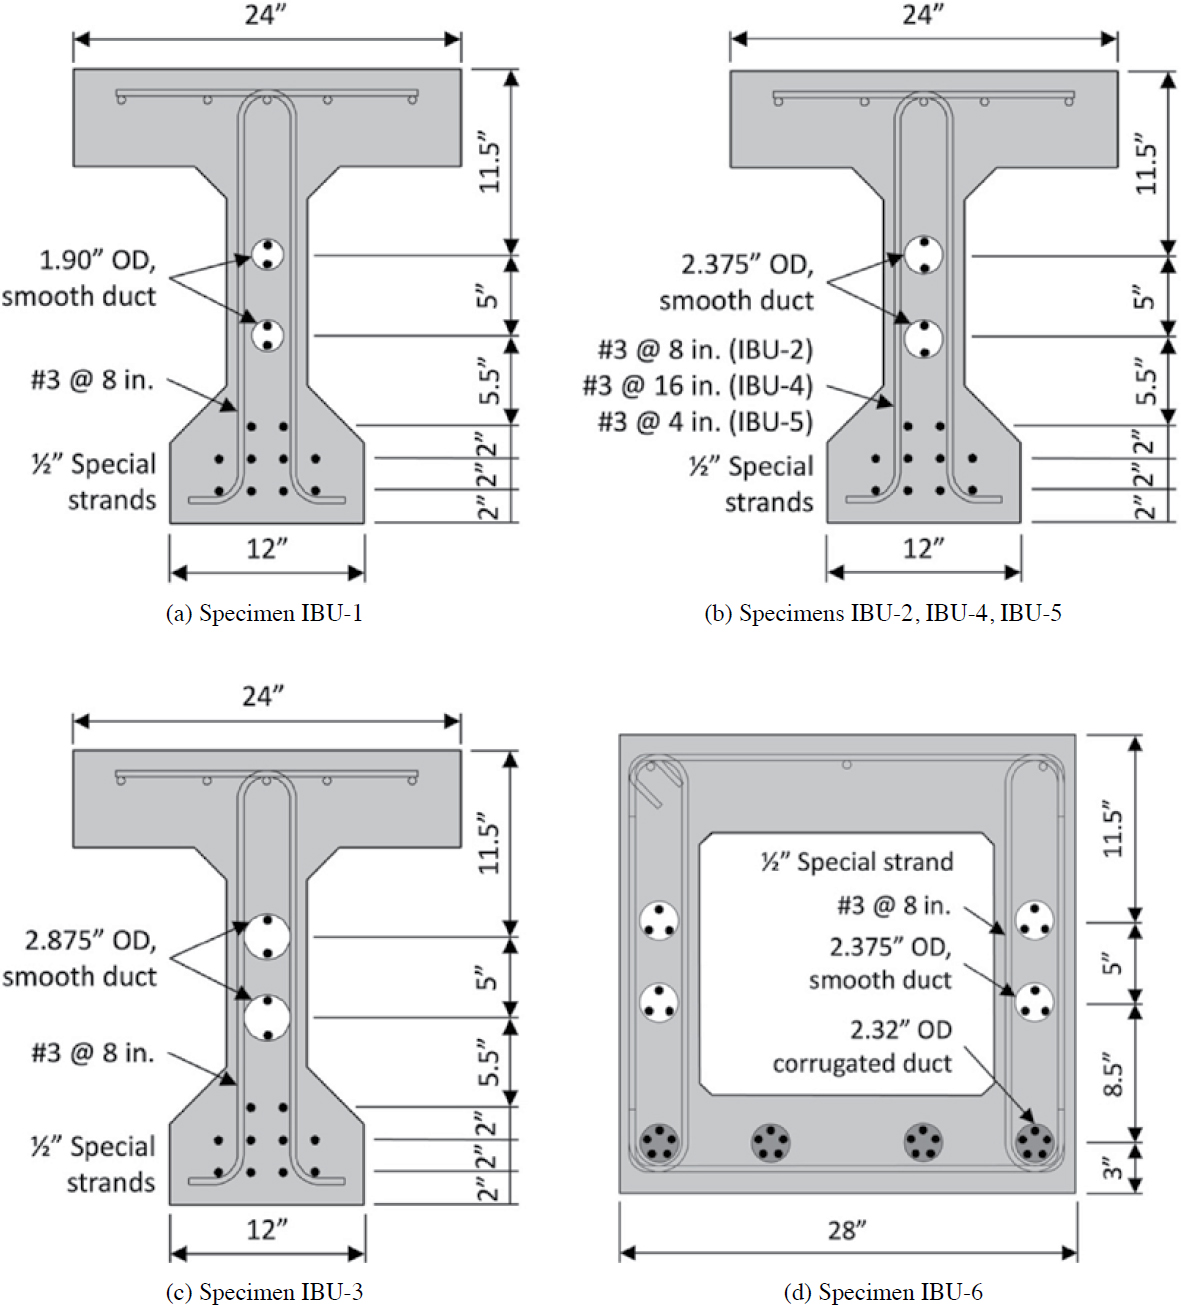
Table 3.8 provides the test matrix for the flexure specimens, including general details of each specimen. The specimens included both I-shaped and box-shaped specimens. As the focus of these tests was flexure, solid webs were provided, and transverse reinforcement consisting of No. 3 bars spaced at 5 in. was provided to prevent shear failure during testing. The cross sections of the flexure specimens are illustrated in Figure 3.13.
Two specimens with unbonded post-tensioned tendons (IU-12 and IU-13) were tested in flexure. Specimens IU-12 and IU-13 were designed without bonded longitudinal reinforcement in the bottom flange to investigate the behavior of a fully unbonded girder. Each specimen contained two ducts in the bottom flange, and the total area of prestressed reinforcement was varied between the two specimens. To investigate the use of pretensioned strands with unbonded post-tensioned tendons, three specimens (IBU-8, IBU-9, and IBU-10) were designed with varying ratios of bonded pretensioned strands to unbonded post-tensioned strands. The pretensioned strands were located between two ducts in the bottom flanges of the specimens. Specimen IBE-4 and IEU-4 were box-shaped specimens with two post-tensioned ducts in the bottom flange and two unbonded post-tensioned tendons in the void near the bottom. IBE-4 contained bonded post-tensioned tendons in the bottom flange, while IEU-4 contained unbonded post-tensioned tendons in the bottom flange.
Table 3.8. Test matrix for flexure tests.
| Specimen | Member Type | No. of Internal Bonded Strands, Bottom Flange | No. of Internal Unbonded Post-Tensioned Strands, Bottom Flange | No. of External Unbonded Post-Tensioned Strands | Strand Dia. | Transverse Reinf. | Øduct, Bonded (in.) | Øduct, Unbonded, (in.) | |
|---|---|---|---|---|---|---|---|---|---|
| Pretensioned | Post-Tensioned | ||||||||
| IU-12 | I-shape | - | - | 10 | - | ½” | #3 @ 5” | - | 2.375 |
| IU-13 | I-shape | - | - | 8 | - | ½” | #3 @ 5” | - | 2.375 |
| IBU-8 | I-shape | 2 | - | 6 | - | ½” | #3 @ 5” | - | 2.375 |
| IBU-9 | I-shape | 4 | - | 4 | - | ½” | #3 @ 5” | - | 2.375 |
| IBU-10 | I-shape | 6 | - | 2 | - | ½” | #3 @ 5” | - | 2.375 |
| IBE-4 | Box | - | 6 | - | 4 | ½” | #3 @ 5” | 2.32 | 2.375 |
| IEU-4 | Box | - | - | 6 | 4 | ½” | #3 @ 5” | - | 2.375 |
All flexure specimens were constructed with ½ in. prestressing strands. The centroid of the prestressing strand in the I-shaped flexure tests was constant. Similarly, the centroid of the prestressing strands for the two box-shaped specimens was constant. The I-shaped flexure specimens and box-shaped flexure specimens contained No. 3 stirrups spaced at 5 in.
3.3.3.2 Test Setup and Instrumentation
3.3.3.2.1 Test Setup
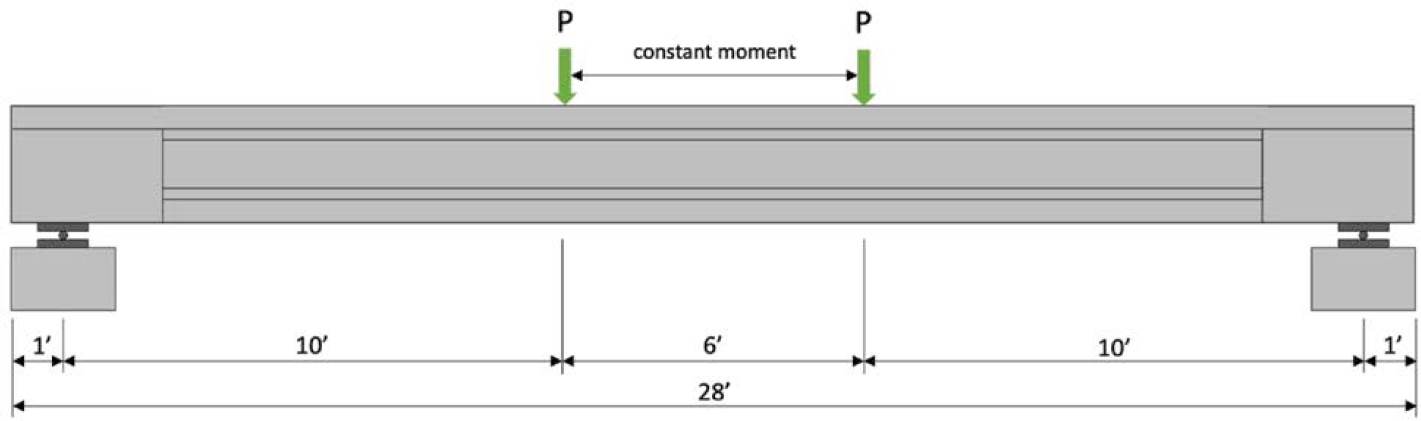
Figure 3.14 illustrates the flexure test setup which provides a 6-ft constant moment region. Rollers were used at each of the two supports, and the specimens were supported in the end block region. A load cell was installed in-line with each hydraulic cylinder to measure the force applied to the specimen, and string potentiometers measured the displacement under each load point and at midspan. Figure 3.15 shows a specimen in the test setup before testing.
3.3.3.2.2 Instrumentation
Figure 3.16 and Figure 3.17 show the typical placement of strain gauges for the flexure specimens. For specimens with pretensioned strands (Figure 3.16), strain gauges were installed at both load points along the same strand. For Specimens IBU-8 and IBU-9, strain gauges were installed

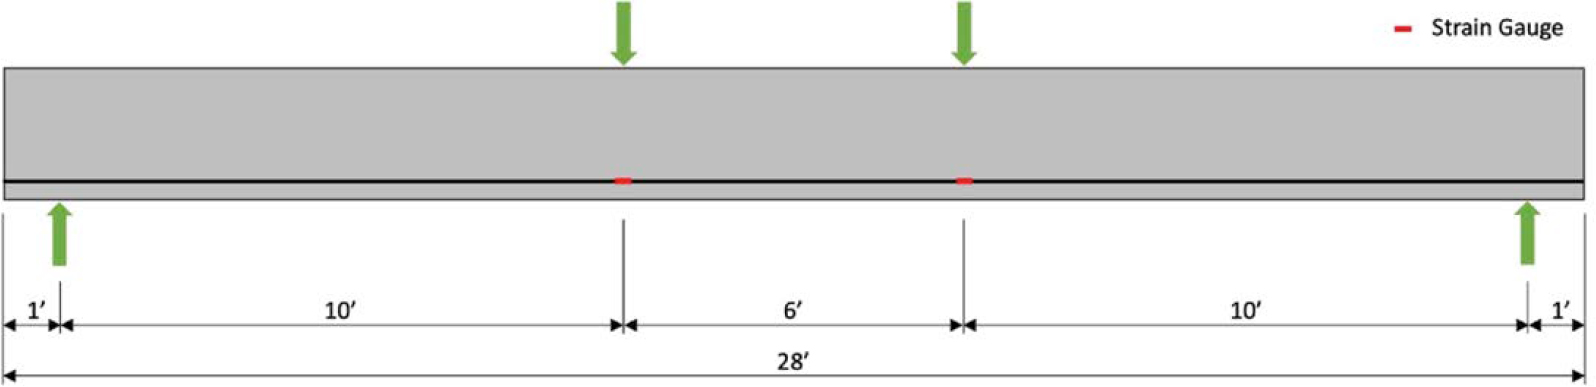
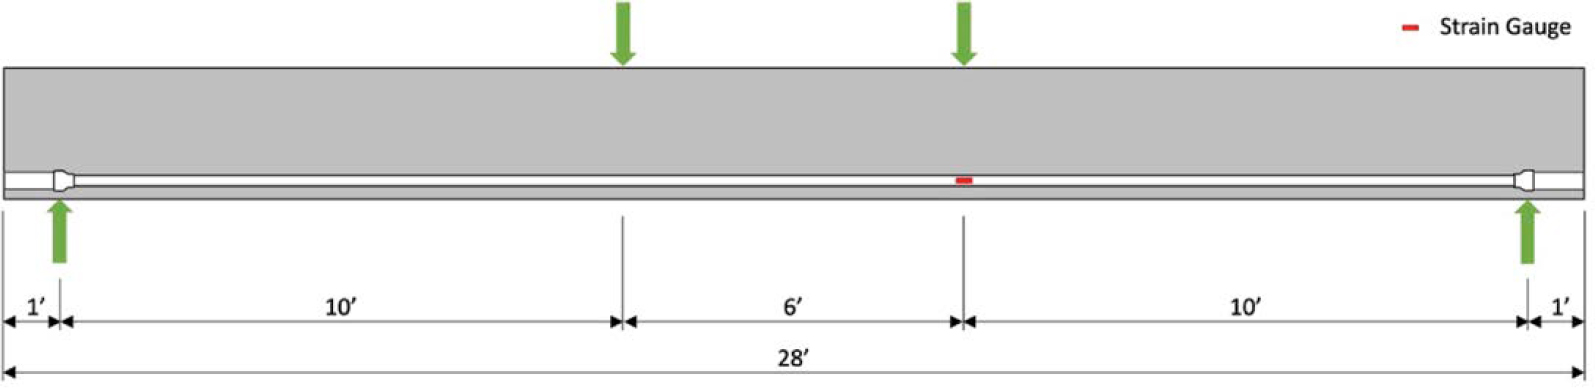
along a strand in the top and bottom layer of the pretensioned strands. For Specimen IBU-10, strain gauges were installed along both pretensioned strands. For the specimens with post-tensioned strands (Figure 3.17), strain gauges were installed at the location of one load point. Specimens IU-12, IU-13, IBU-8, IBU-9, and IBU-10 contained strain gauges in both post-tensioned tendons. Specimens IBE-4 and IEU-4 contained one strain gauge in one of the internal tendons and one strain gauge in one of the external tendons.
3.3.3.3 Results
A summary of details for the flexure specimens, including the compressive and tensile strengths (fc, ft) of the concrete, compressive strength of the grout (fc), and effective stresses (fpe) of the prestressed strands, is included in Table 3.9. A summary of the loads corresponding to
Table 3.9. Summary of flexure specimen details.
| Specimen | Concrete fc (psi) | Concrete ft (psi) | Grout fc (psi) | Pretensioned Strands | Internal Bonded PT Strands | Internal Unbonded PT Strands | External Unbonded Strands | ||||||||
|---|---|---|---|---|---|---|---|---|---|---|---|---|---|---|---|
| Aps (in.2) | dps (in.) | fpe (ksi) | Aps (in.2) | dps (in.) | fpe (ksi) | Aps (in.2) | dps (in.) | fpe (ksi) | Aps (in.2) | dps (in.) | fpe (ksi) | ||||
| IU-12 | 10,670 | 940 | - | - | - | - | - | - | - | 1.530 | 24 | 155 | - | - | - |
| IU-13 | 10,520 | 940 | - | - | - | - | - | - | - | 1.224 | 24 | 163 | - | - | - |
| IBU-8 | 9,040 | 690 | - | 0.918 | 24 | 175 | - | - | - | 0.306 | 24 | 152 | - | - | - |
| IBU-9 | 10,640 | 780 | - | 0.612 | 24 | 157 | - | - | - | 0.612 | 24 | 172 | - | - | - |
| IBU-10 | 9,390 | 830 | - | 0.306 | 24 | 159 | - | - | - | 0.918 | 24 | 152 | - | - | - |
| IBE-4 | 9,240 | 780 | 6,810 | - | - | - | 0.918 | 25 | 144 | - | - | - | 0.612 | 19 | 149 |
| IEU-4 | 9,230 | 790 | - | - | - | - | - | - | - | 0.918 | 25 | 142 | 0.612 | 19 | 165 |
Notes: fc = compressive strength; ft = tensile strength; Aps = area of prestressing strand; fpe = effective stress of prestressed strands; PT = post-tensioned; dps = distance from extreme compression fiber to the centroid of the prestressing strands
Table 3.10. Flexure test results summary.
| Specimen | Cracking Load Pcr (kips) | Failure Load Pmax, (kips) | fps (ksi) | Failure Mechanism | |
|---|---|---|---|---|---|
| Internal Posttensioning | External Posttensioning | ||||
| IU-12 | 39 | 65 | * | - | Wire fracture |
| IU-13 | 34 | 55 | 250 | - | Wire fracture |
| IBU-8 | 37 | 60 | 230 | - | Wire fracture |
| IBU-9 | 38 | 59 | 243 | - | Wire fracture |
| IBU-10 | 37 | 59 | 234 | - | Pretensioned strand fracture |
| IBE-4 | 35 | 71 | 266 | 232 | Wire fracture |
| IEU-4 | 38 | 63 | 229 | 223 | Top flange crushing |
*Gauge lost
first flexural cracking, ultimate capacity, strand stresses at failure, and the failure mechanism for each specimen is provided in Table 3.10. The ultimate stresses for the instrumented pretensioned strands are not reported because the gauges were unreliable after initiation of flexural cracking.
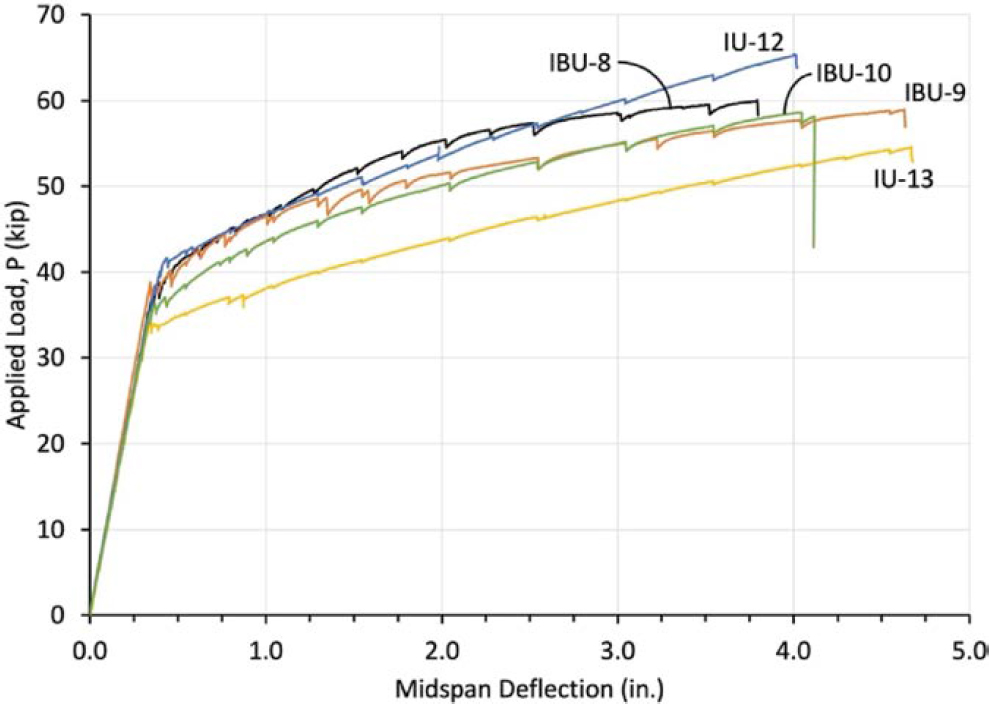
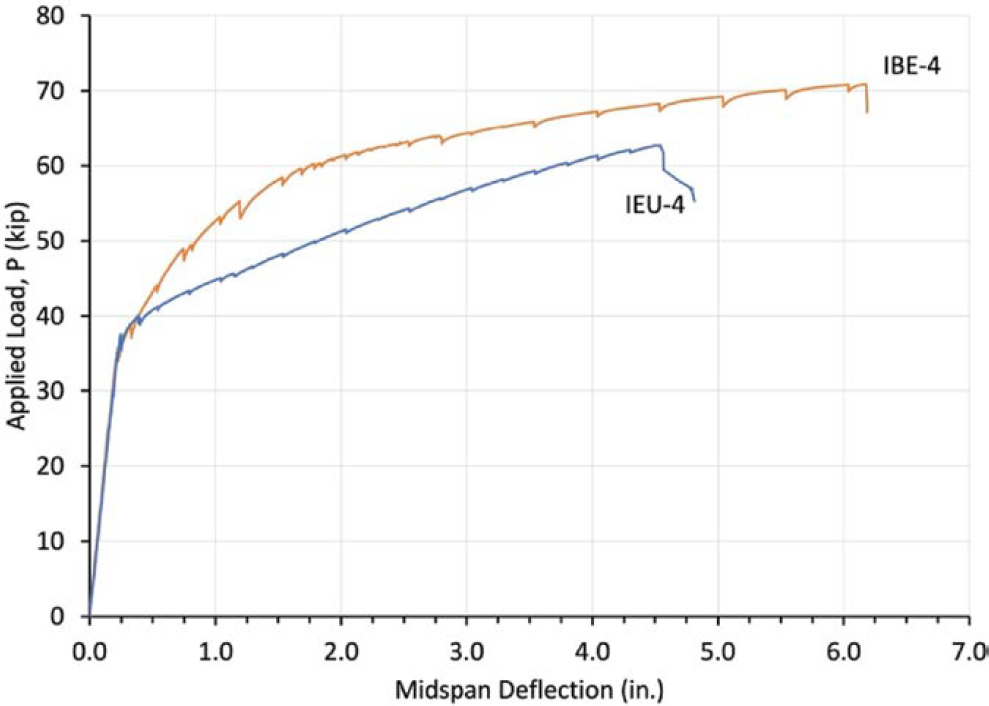
For the flexure specimens, load was applied to the girder using the two hydraulic rams in the test setup. The load (P) was increased in 5-kip increments until flexural cracking was observed. After flexural cracking, the load was incrementally increased to provide approximately 0.25-in. increments of midspan deflection. The behavior of the flexure specimens was similar. The initial stiffness of each specimen was essentially identical, as shown by the load displacement relationships in Figure 3.18 for the I-shaped specimens and Figure 3.19 for the box-shaped specimens. Following first flexural cracking, a decrease in stiffness was observed. Specimens with bonded strands experienced a reduced stiffness immediately after developing the first flexural cracks to a lesser extent than the specimens containing only unbonded tendons. Each specimen developed an initial flexural crack near one of the load points or at midspan. This crack was closely followed by two additional flexural cracks such that there was a total of three cracks located near both load points and at midspan. As additional load was applied, the bonded specimens (IBU-8, IBU-9, IBU10, and IBE-4) developed flexural cracks outside the constant moment region.
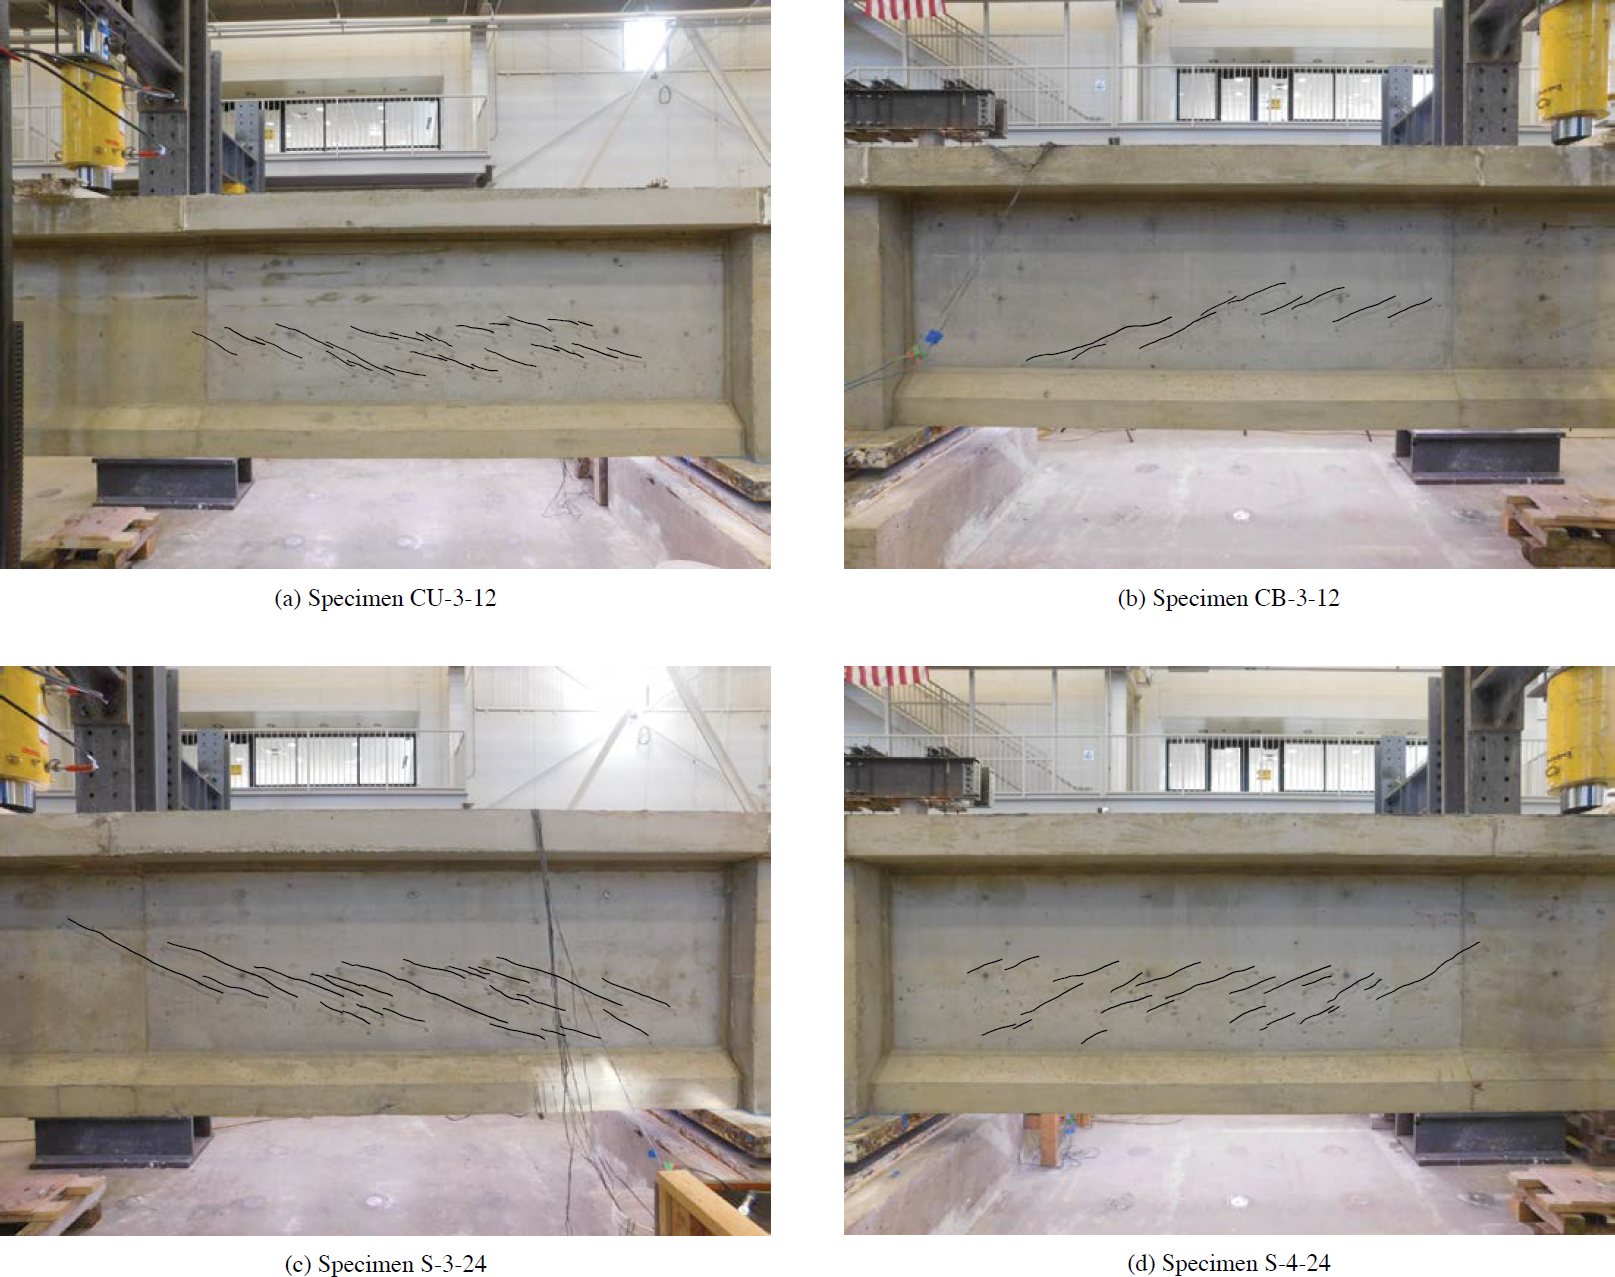
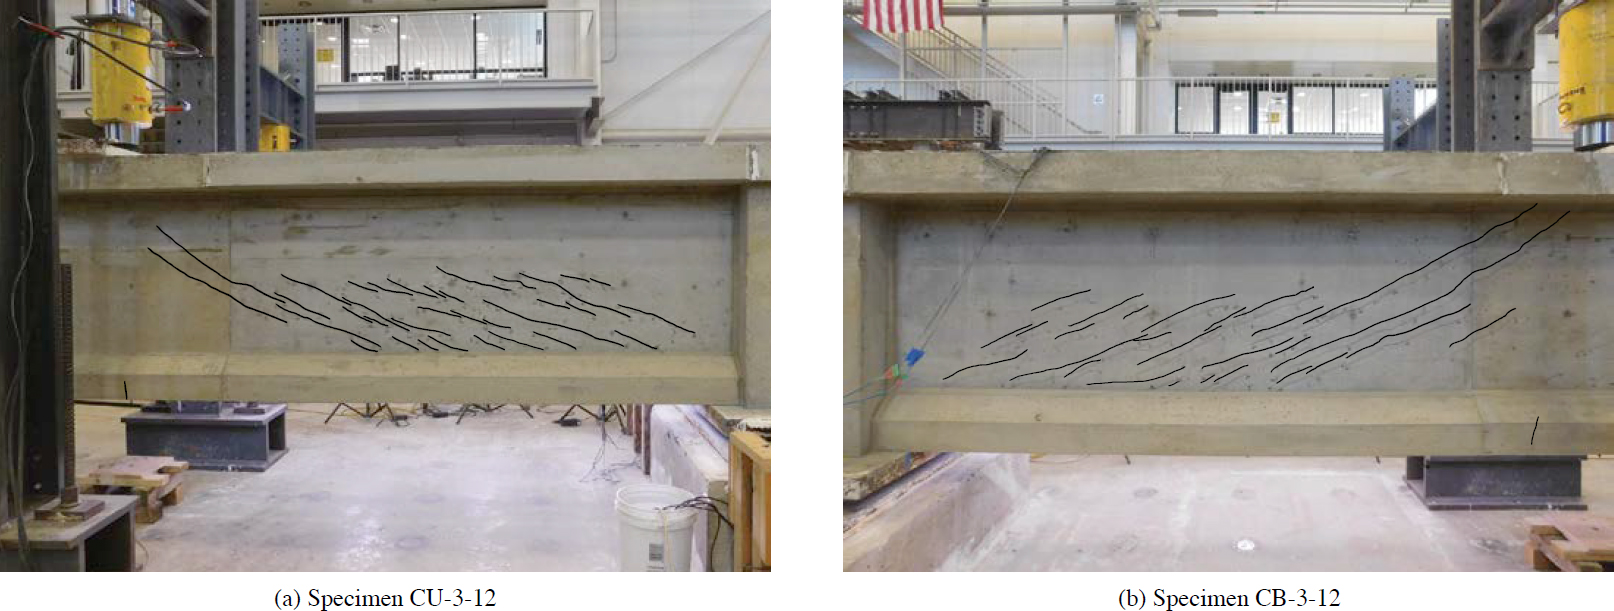
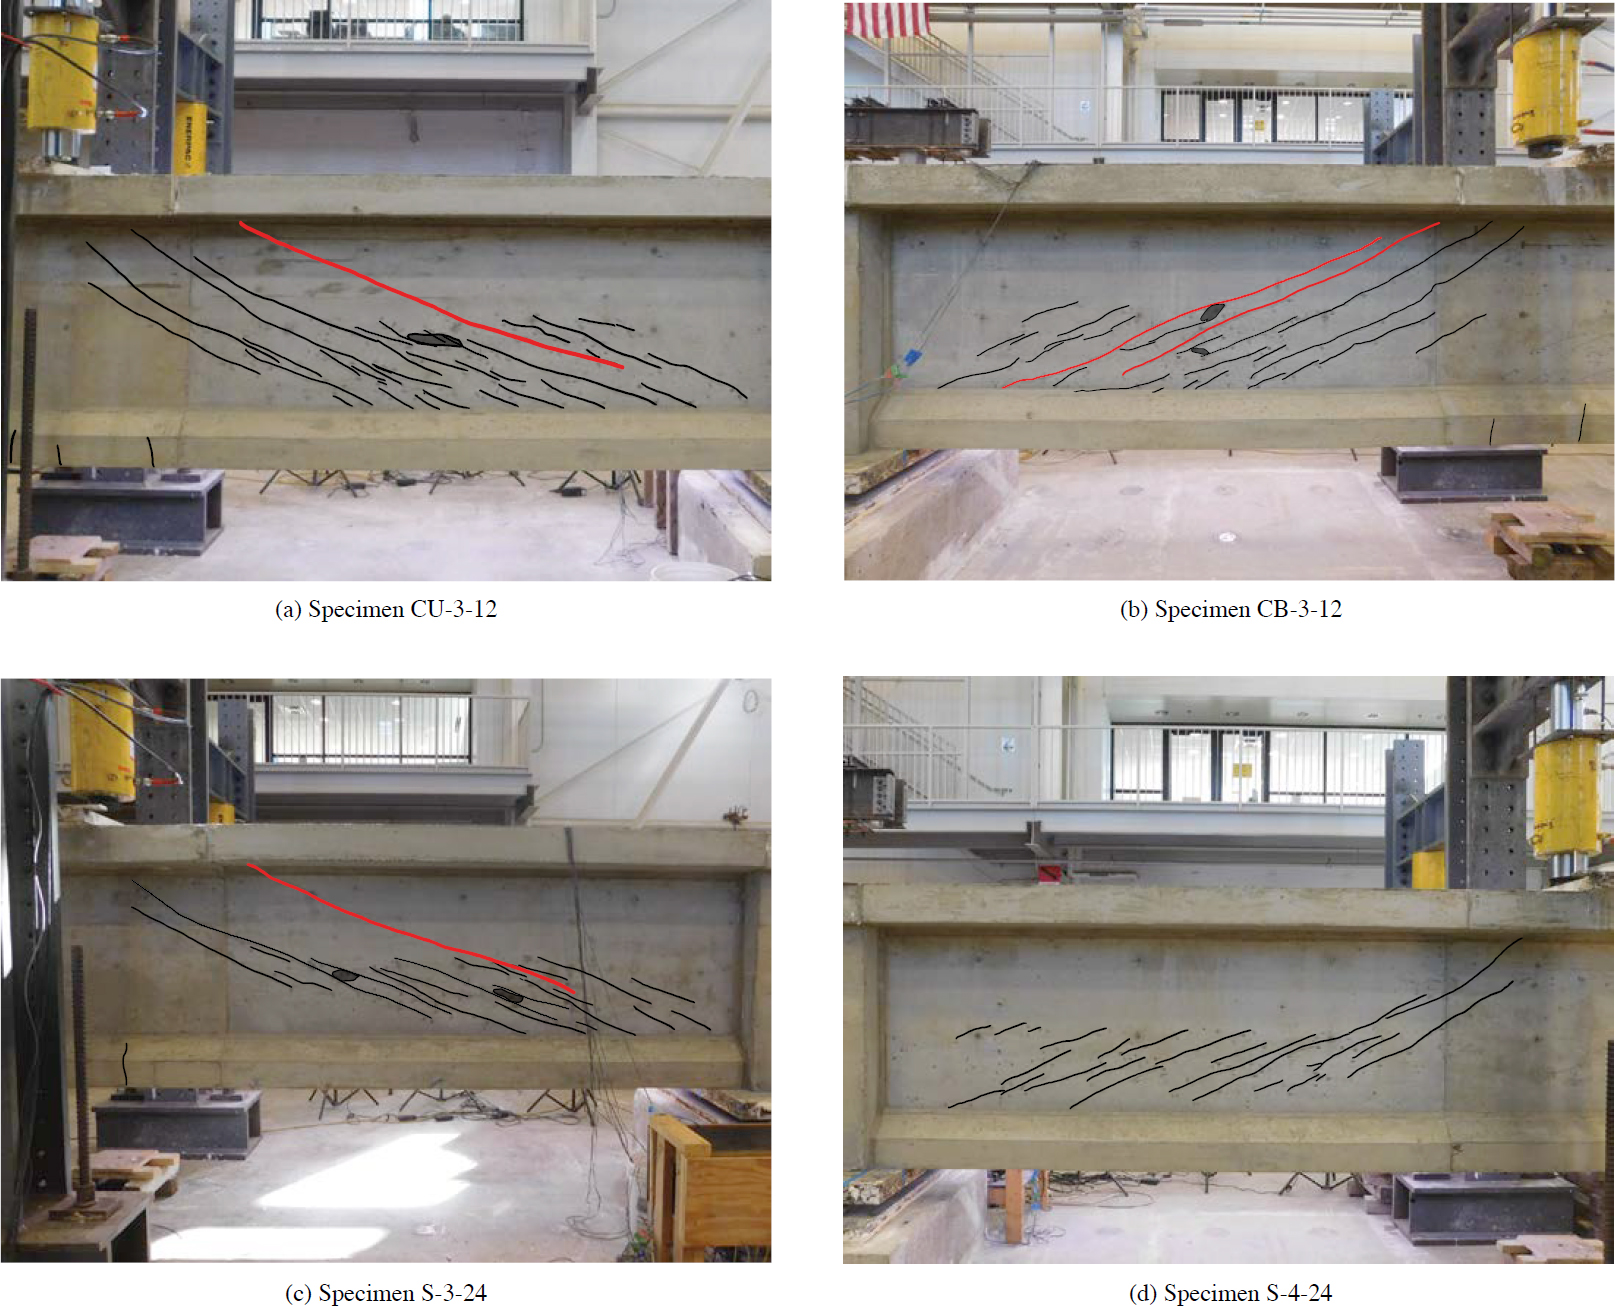
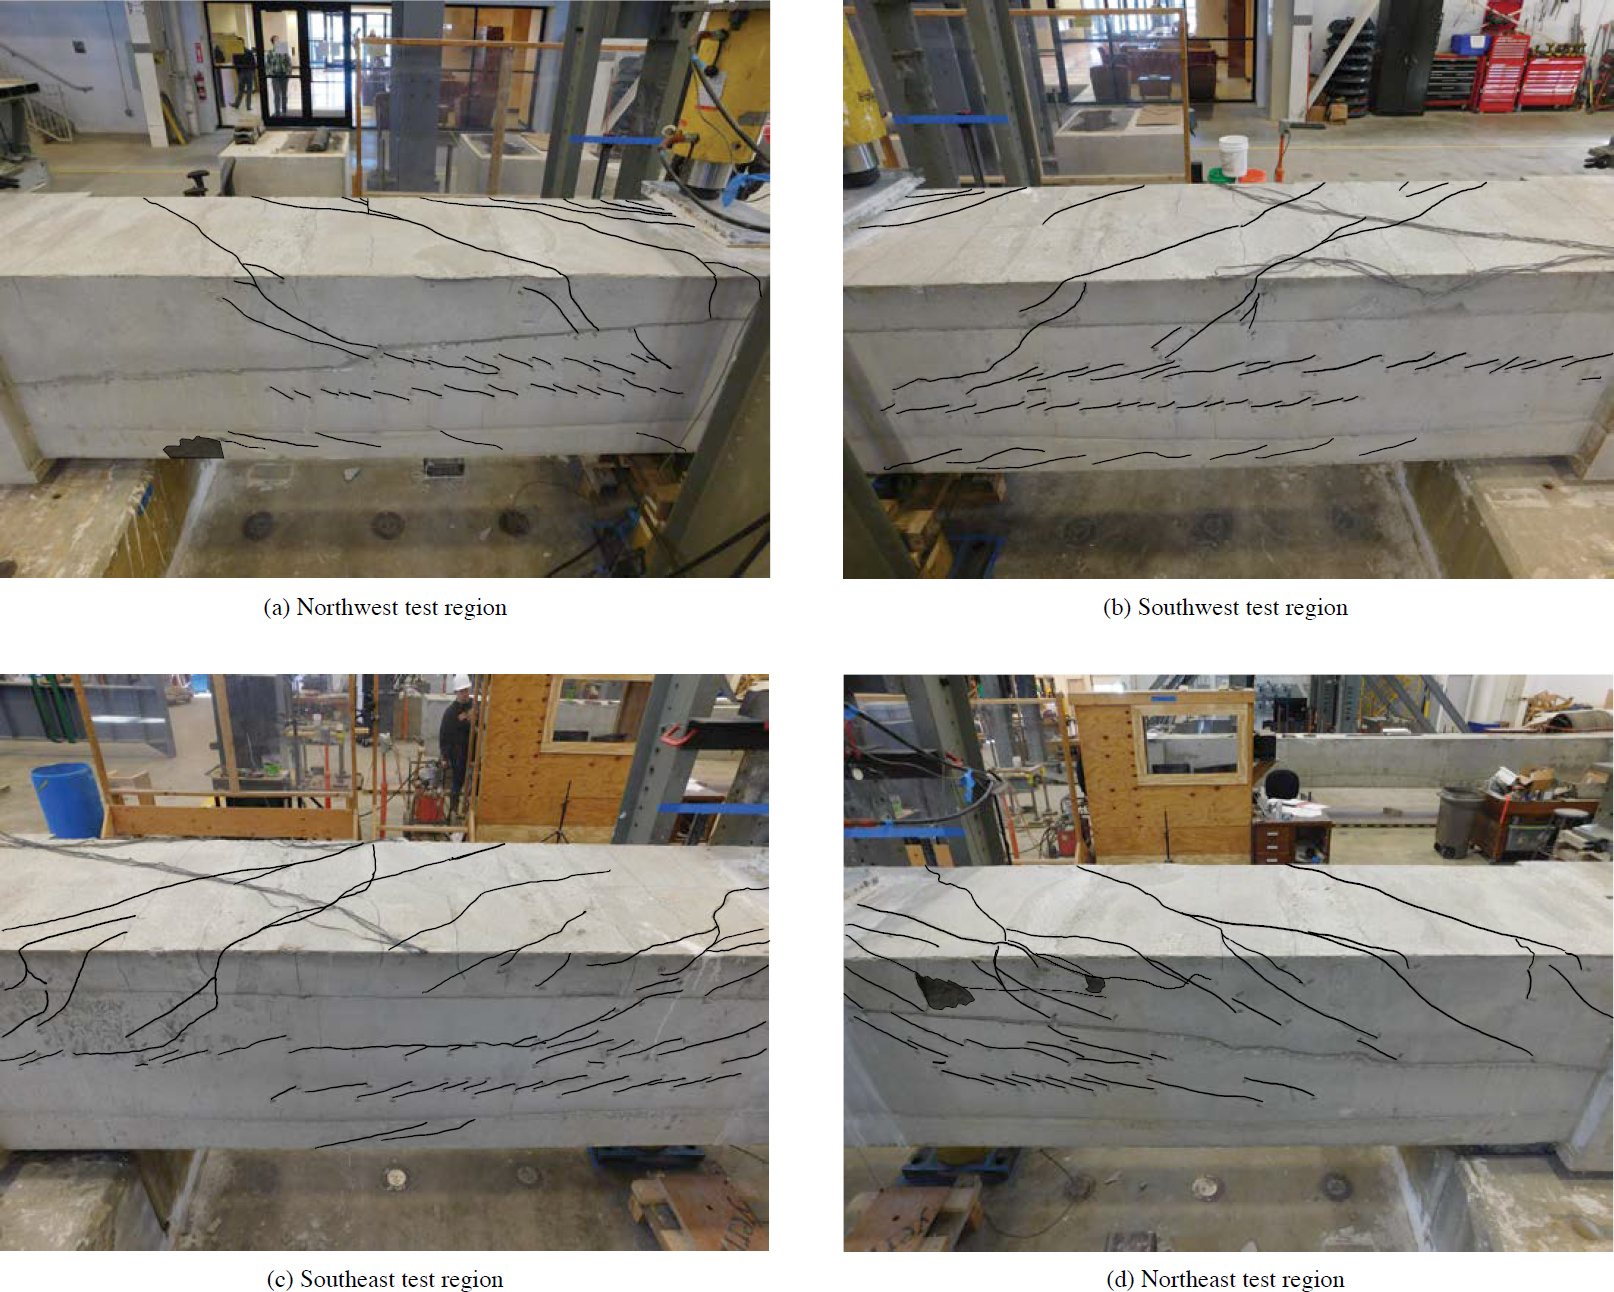
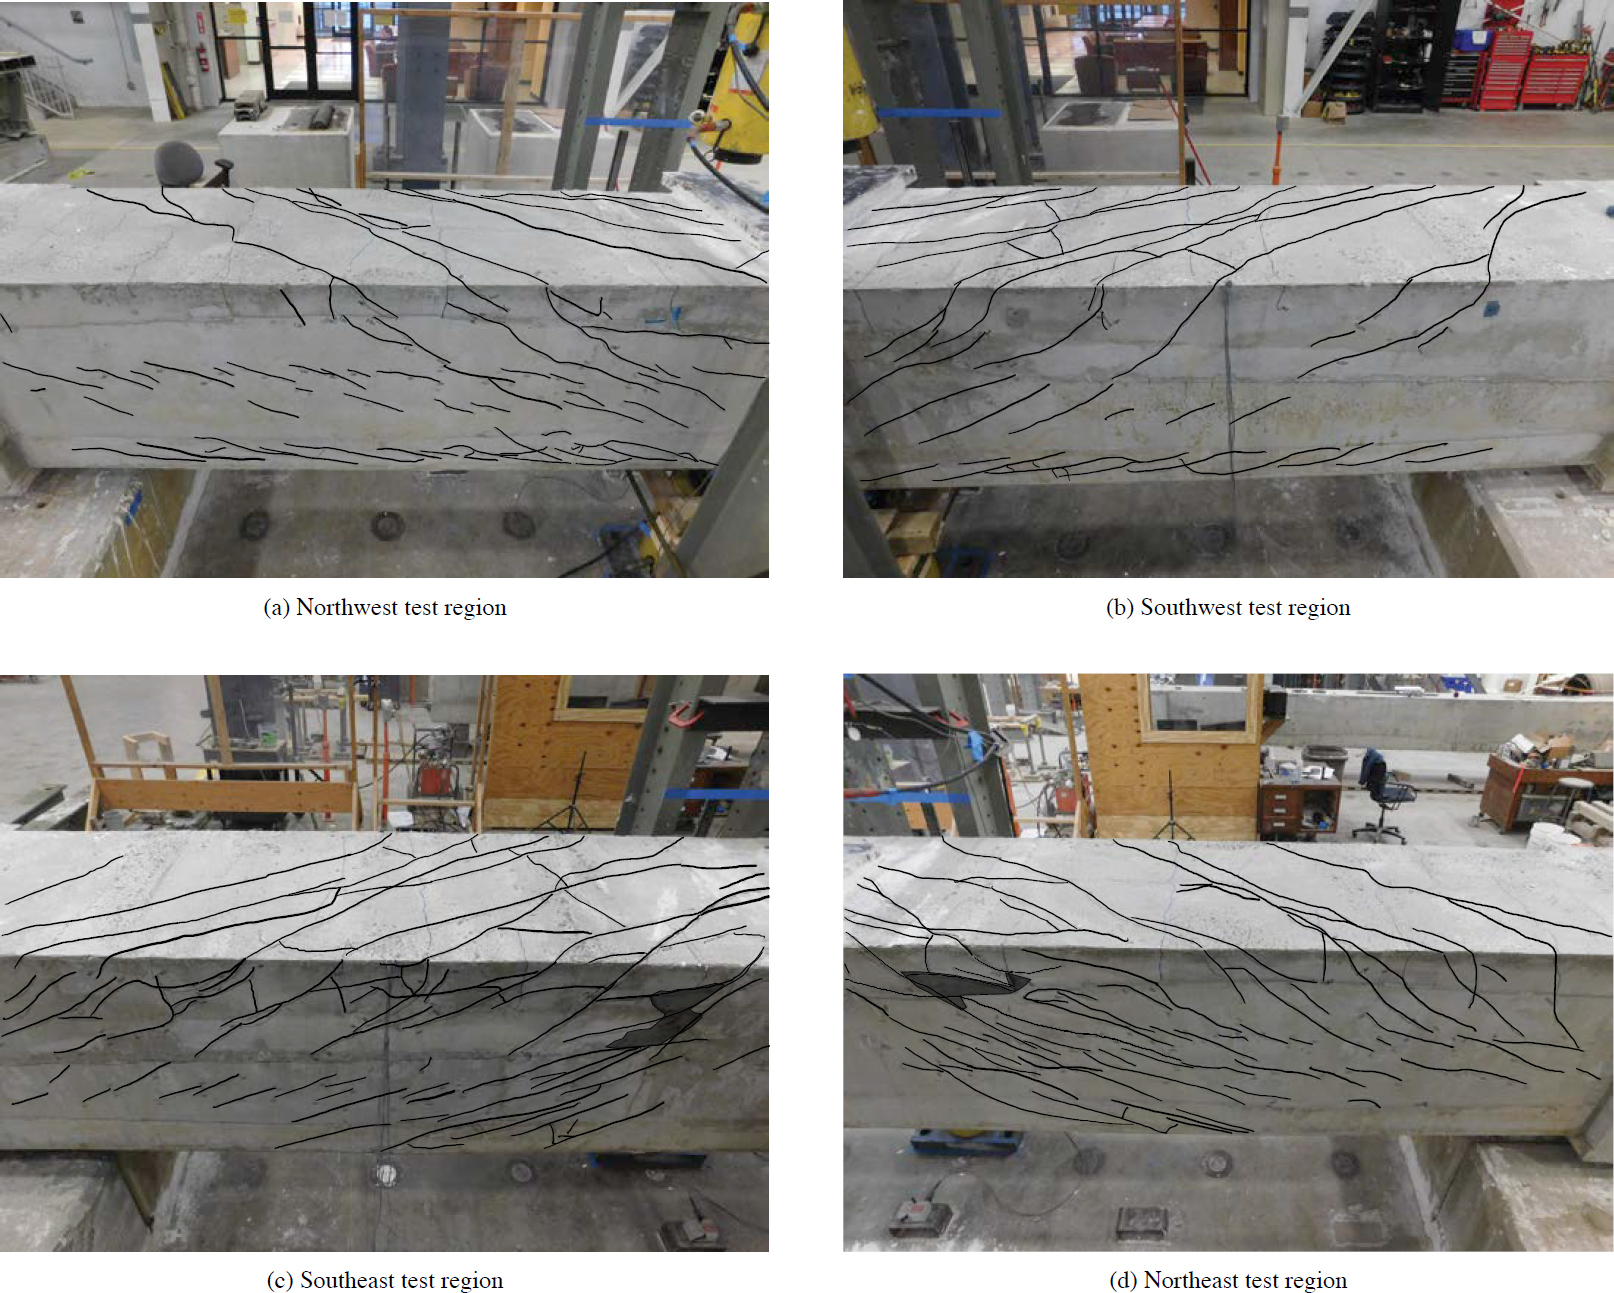
The girders at failure, showing the cracks that developed during testing, are presented in Figure 3.20 and Figure 3.21.
Three different failure mechanisms were observed for the flexure specimens: (1) wire fracture in an unbonded post-tensioned strand, (2) fracture of a pretensioned strand, and (3) crushing in the top flange. Specimens IU-12, IU-13, IBU-8, IBU-9, and IBE-4 failed due to wire fracture in an unbonded post-tensioned strand. The wire fracture occurred at the location of the post-tensioning chuck and resulted in a decrease in the load-carrying capacity, which was considered failure. Specimen IBU-10 failed due to the fracture of both pretensioned strands at the location of a load point. The fracture caused a significant loss of load-carrying capacity and resulted in the other flexural cracks closing slightly. The behavior of Specimen IBU-10 can be compared to Specimens IBU-8 and IBU-9, which had higher ratios of bonded to unbonded strands and failed due to wire fracture in an unbonded post-tensioned strand. Specimen IBU-10 developed higher stresses in the bottom flange that caused the pretensioned strands to fracture before a wire could fracture in the unbonded post-tensioned strands.
Specimen IEU-4 failed due to crushing in the top flange. Specimen IEU-4 can be compared to Specimen IBE-4, as the two specimens were identical in shape and tendon layout. The specimens differ in that Specimen IEU-4 contained only unbonded tendons while Specimen IBE-4 contained internal bonded tendons and external unbonded tendons. The failure behaviors of these box-shaped specimens are different because the fully unbonded specimen had a different stress distribution through the section due to the difference in the bond type of the internal tendons.
3.3.3.3.1 Influence of Bond
The prestressing strands bond type (bonded, unbonded, or combination bonded/unbonded) influenced the cracking behavior. Table 3.11 presents the crack widths for each of the flexure specimens after cracking, before failure, and after failure, and Figure 3.22 shows the crack sizes compared to midspan deflection during testing. The crack widths were very small immediately after cracking. After cracking, specimens with only unbonded strands produced fewer and larger cracks than the specimens that contained some amount of bonded prestressed reinforcement.
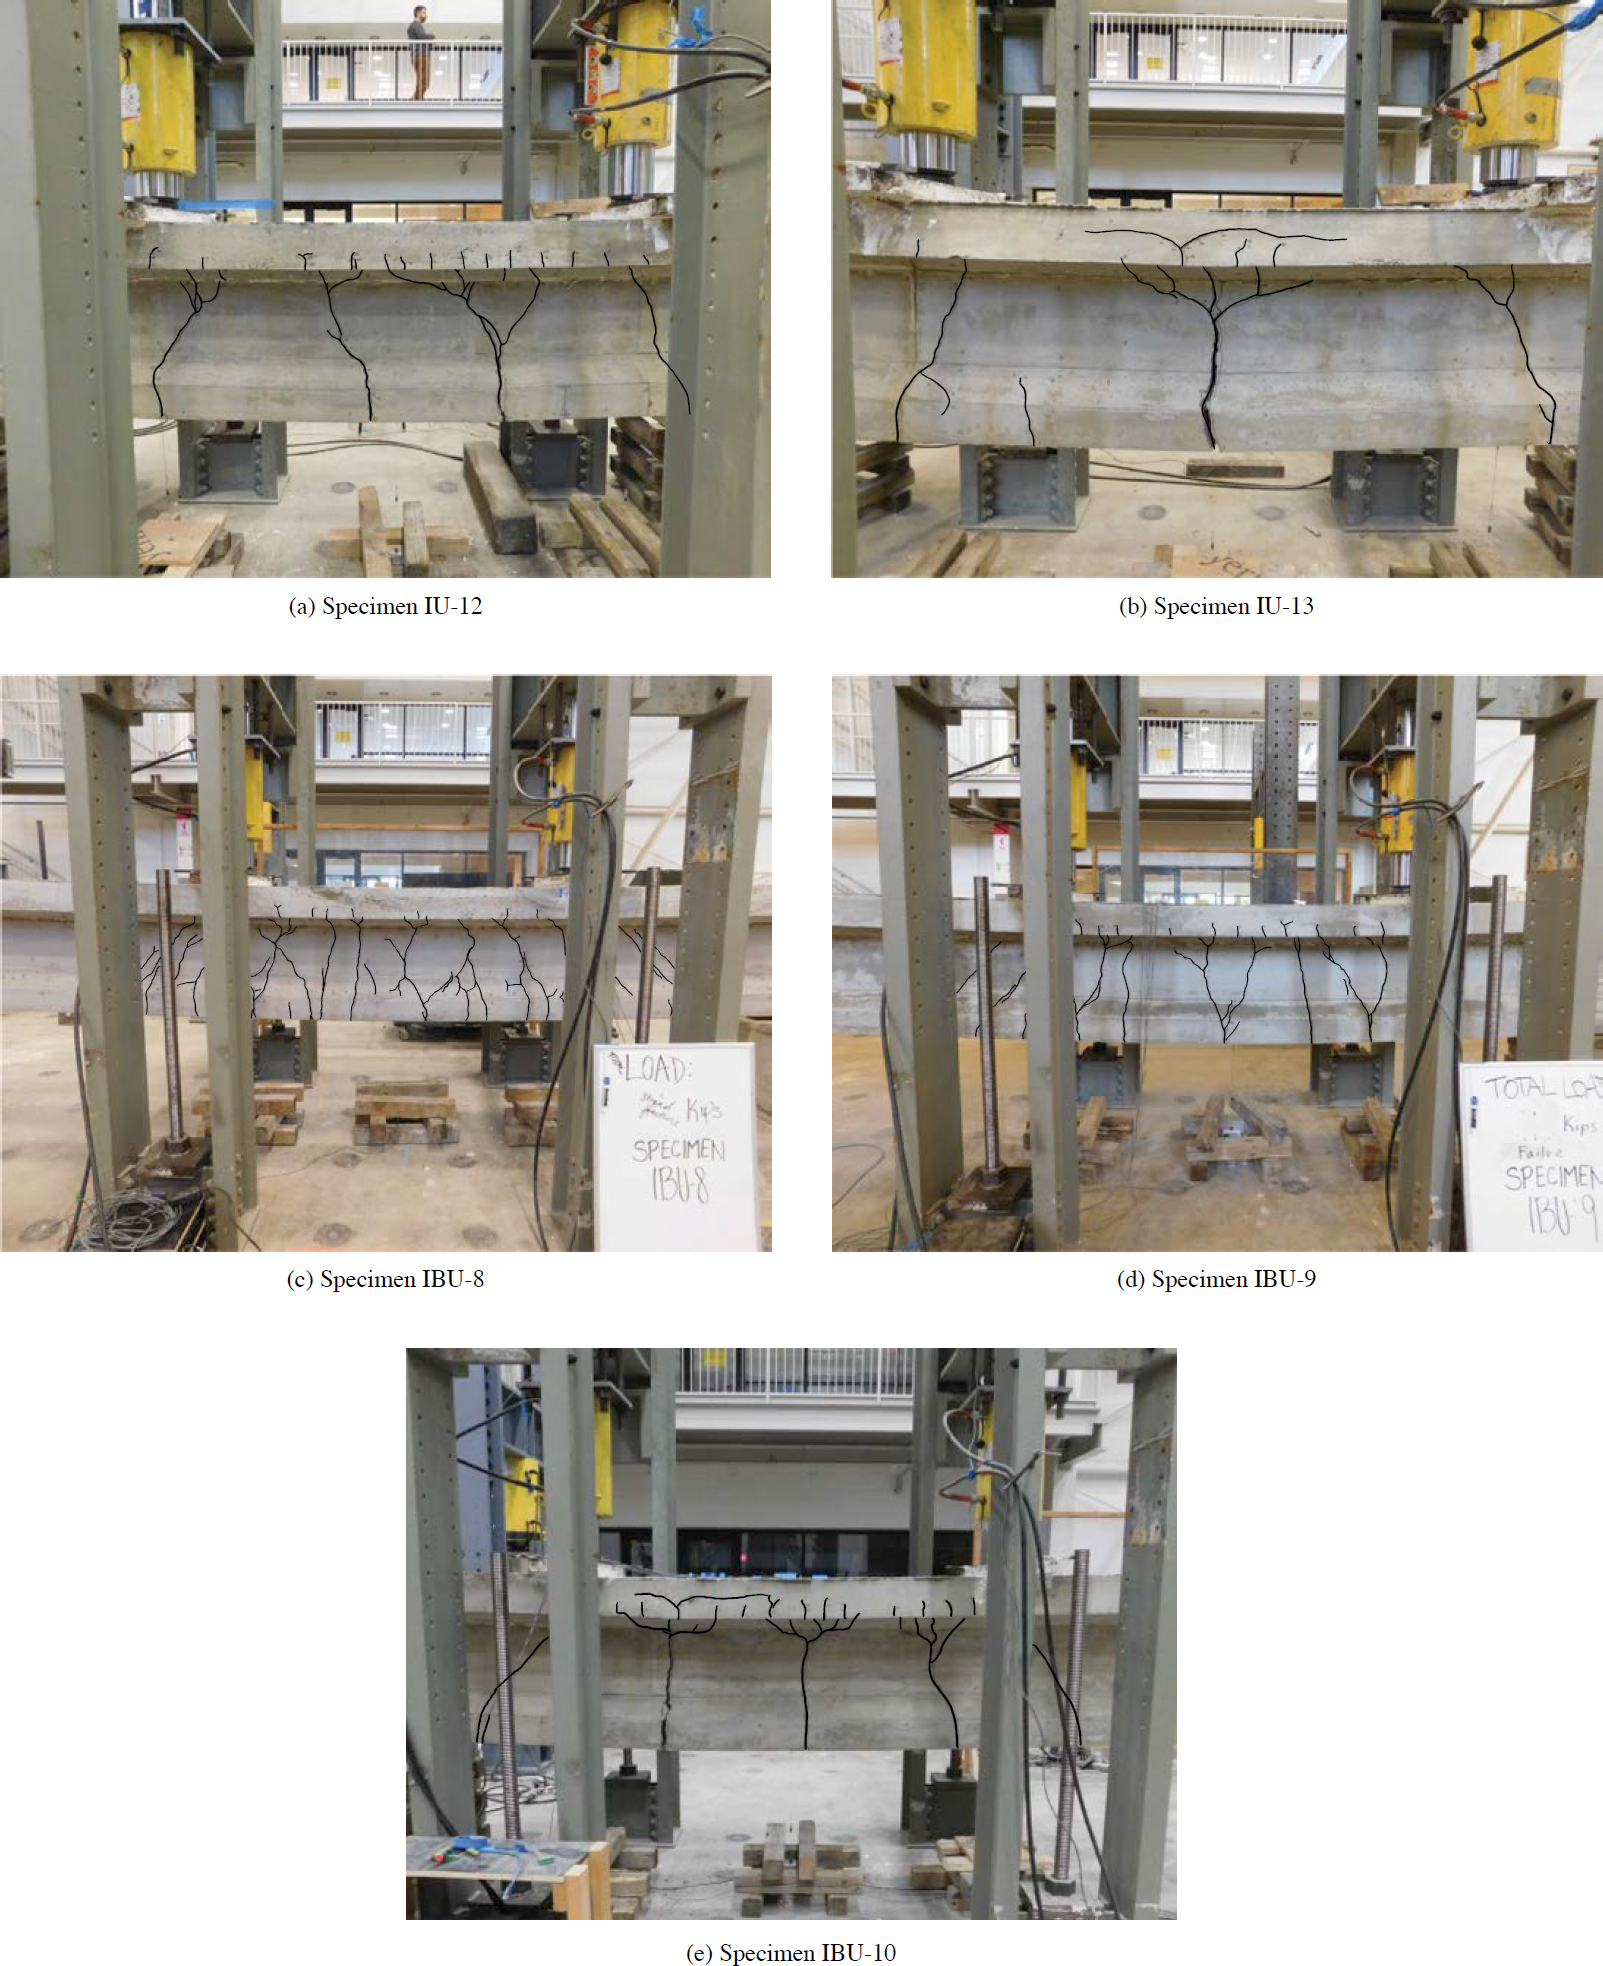
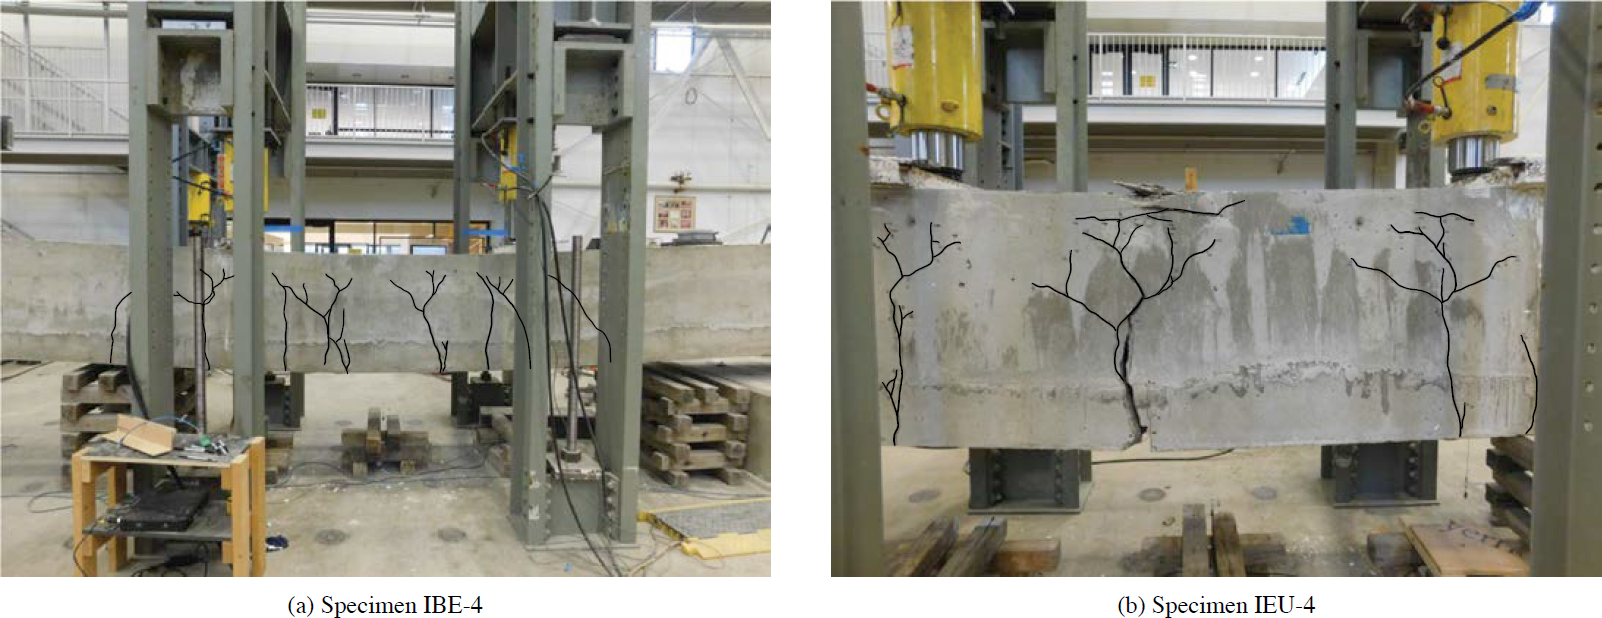
Table 3.11. Crack widths for flexure tests, at location of dominant crack.
| Specimen | Ratio of Bonded to Total Strands | Crack Width (in.) | ||
|---|---|---|---|---|
| After Cracking | Before Failure | After Failure | ||
| IU-12 | 0% | 0.040 | 0.50 | 0.50 |
| IU-13 | 0% | 0.003 | 0.38 | 1.13 |
| IBU-8 | 75% | 0.008 | 0.08 | 0.25 |
| IBU-9 | 50% | 0.012 | 0.25 | 0.50 |
| IBU-10 | 25% | 0.003 | 0.44 | 0.88 |
| IBE-4 | 60% | 0.008 | 0.07 | 0.50 |
| IEU-4 | 0% | 0.035 | 0.22 | 2.50 |

With increasing loading, the crack widths for the unbonded specimens were extremely large with cracks widths reaching 2.5 in. for Specimen IEU-4. The bonded prestressed reinforcement provides strain compatibility between the concrete and reinforcement and allows tensile strains to develop in the concrete resulting in a better distribution of cracking throughout the girder and smaller crack widths.
The cracking behavior of specimens with a combination of bonded and unbonded strands varied as shown in Figure 3.20 and Figure 3.21. Specimen IBU-8, with a bonded strand to total strand ratio of 75% had well-distributed cracks and smaller crack widths than specimens with a ratio of 50% and 25%. Specimen IBU-10, with a bonded strand to total strand ratio of 25%, had more distributed cracks than specimens without bonded reinforcement, but less distributed cracks compared to specimens with ratios of 50% and 75%. Specimen IBU-9, with a bonded strand to total strand ratio of 50%, had crack distributions and crack widths between that of the specimens with 25% and 75% ratios. The overall behavior of these specimens shows that specimens with lower bonded strands to total strands ratios (i.e., more unbonded strands and fewer bonded strands) resulted in large, concentrated flexural cracking.
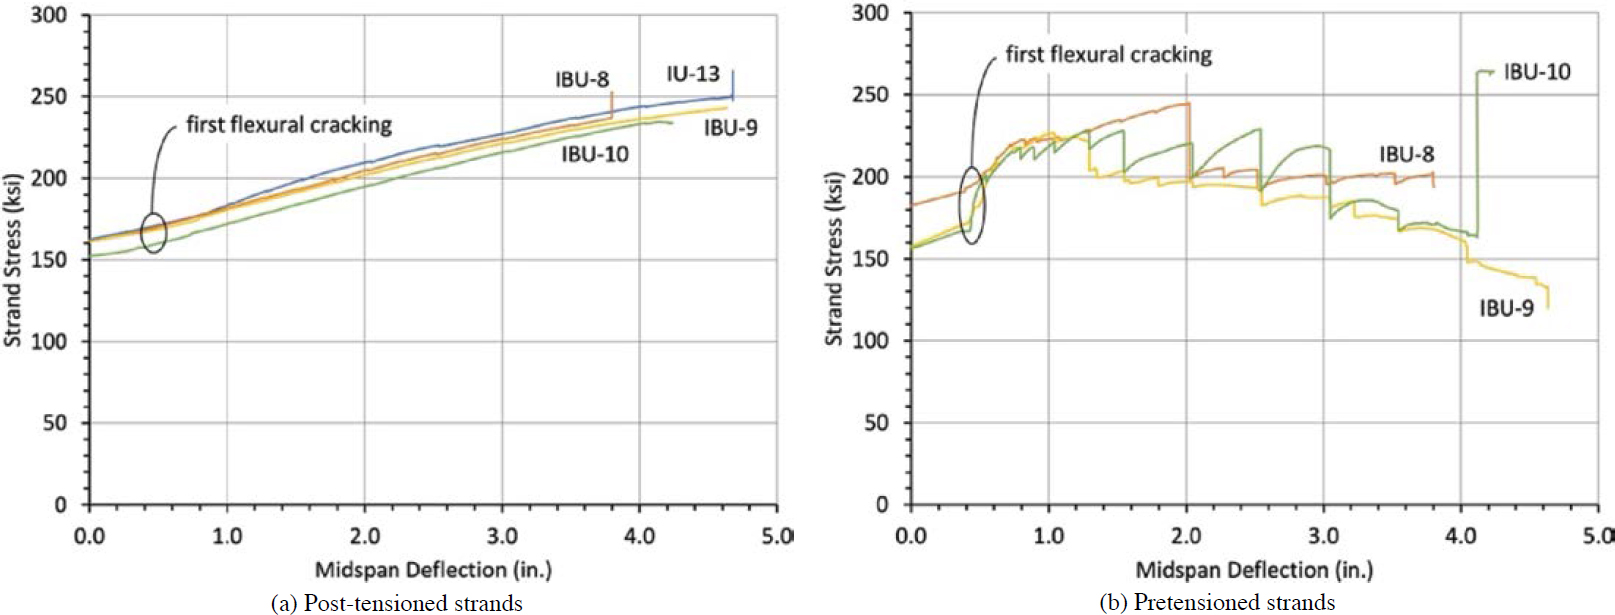
The bond type of prestressing strands also influenced strand stress development. As shown in Figure 3.23(a) for the unbonded strands, the stresses developed at essentially at the same rate as the deflection increased. Stress development was independent of the combination of unbonded with bonded strands. Stress development for unbonded strands is observed to be a function of structural geometry as the increase in stresses is approximately linear with deflection. As shown in Figure 3.23(b) for bonded strands, the stresses jumped significantly at the cracking load as expected for bonded strands where stress development is based on strain compatibility. It should be noted that the jagged nature and apparent reduction of stress at larger displacements (greater than 1.25 in. to 2 in.) is commonly observed in strain gauge measurements of bonded reinforcement as the gauges are installed at specific locations along the length of the strand. As cracks form, jumps in strains are observed as the gauge may be located at or between cracks. Cracking relieves stresses at certain locations and increases stresses at others along the strands and stain gauge damage can also occur due to cracking. Therefore, measured stresses at these larger displacements are not representative of the nominal strand stress for the bonded strand. The entire measured response, however, is provided here for completeness which also illustrates the difference in behavior between the bonded and unbonded strand. As seen in Figure 3.23(a) with the smooth response, the measured unbonded strand stresses were unaffected by flexural cracking.
3.3.3.4 Flexure Conclusions
The following are the conclusions from the experimental investigation for flexure:
- Flexural cracking behavior was dependent on the bond type (bonded, unbonded, or combination bonded/unbonded) of the prestressing strands. Specimens with only unbonded strands experienced very few, but extremely wide, cracks. The behavior of specimens with a combination of bonded and unbonded prestressing strands was dependent on the ratio of bonded strands to total strands. Specimens with larger ratios of bonded strands to total strands exhibited flexural cracks that were small and well distributed. Specimens with smaller ratios of bonded strands to total strands exhibited flexural cracks that were wider and concentrated.
- Strand stress development was also influenced by the bond type of the prestressing strands. For unbonded strands, stresses developed at approximately the same rate as deflection increased and were unaffected by flexural cracking. For bonded strands, stresses increased significantly at the cracking load as stress development is based on strain compatibility.
3.3.4 Shear
Twenty-five shear specimens were designed and tested. This section describes the details and results of the tests.
3.3.4.1 ρv = Av/bws Specimen Design
Table 3.12 shows the test matrix for the shear specimens, including the general details of each specimen. Each specimen, except Specimens IB-0 and IU-0, contained web tendons and transverse reinforcement. All shear specimens were constructed with ½″ special prestressing strands. The I-shaped shear specimens contained the same number of prestressing strands (14 except Specimens IB-0 and IU-0 which included 10 due to the absence of the web tendons) to achieve the same initial prestress force in the members. In general, 10 strands were placed in each bottom flange, and four strands were distributed in the web tendons. The box-shaped specimens also included an equal number of prestressing strands (32) to achieve the same initial prestress force in these members. Twenty strands were placed in each bottom flange, and 12 strands were distributed in the web region (internally and externally). The area of prestressed reinforcement used for each specimen was expected to provide sufficient flexure strength to produce a shear failure before flexural failure. The typical section designs for the IB, IU, IBU, IBE, and IEU groups are illustrated in Figure 3.24 through Figure 3.28.
The shear reinforcement ratio (i.e., transverse reinforcement ratio, ρv = Av/bws where Av is the area of a transverse reinforcement within area s, bw is the web width, and s is the spacing of transverse reinforcement) and the duct diameter to web width ratio, Øduct/bw, were primary variables in the experimental program. The three transverse reinforcement ratios were 0.275%, 0.55%, and 1.10% and were achieved using two-legged No. 3 stirrups spaced at 16 in., 8 in., and 4 in., respectively. The 16 in. stirrup spacing was selected to correspond with the maximum allowable spacing for transverse reinforcement specified by Equation 5.7.2.6-1 in the LRFD BDS (AASHTO 2020). The three values for the duct diameter to web width ratio, Øduct/bw, were 0.38, 0.47, and 0.58, where the duct diameter is taken as the outside diameter of the ducts used in the test specimens. These specific ratios were achieved using ducts with outside diameters of 1.90 in., 2.375 in., and 2.875 in., respectively. The number of tendons in each duct and the distribution of internal and external tendons were also investigated.
Specimens in the IB group contained bonded internal post-tensioned tendons located in the bottom flange and web of the members. Specimens in the IU group contained unbonded internal post-tensioned tendons located in the bottom flange and web of the members. The first specimen
Table 3.12. Test matrix for shear tests.
| Specimen | Member Type | No. of Tendons, Bottom Flange | No. of Internal Strands, Bottom Flange | No. of Tendons, Web | No. Internal Strands, Webs | No. of External Unbonded PT Strands | Strand Dia. | Transverse Reinf. | Øduct, Flange, (in.) | Øduct, Web, (in.) | |||
|---|---|---|---|---|---|---|---|---|---|---|---|---|---|
| Pret. | Bonded PT | Unbonded PT | Bonded PT | Unbonded PT | |||||||||
| IB-0 | I-shape | 2 | - | 10 | - | - | - | - | - | ½” Sp. | - | 2.32 | - |
| IB-1 | I-shape | 2 | - | 10 | - | 2 | 4 | - | - | ½” Sp. | #3 @ 8” | 2.32 | 1.90 |
| IB-2 | I-shape | 2 | - | 10 | - | 2 | 4 | - | - | ½” Sp. | #3 @ 8” | 2.32 | 2.32 |
| IB-3 | I-shape | 2 | - | 10 | - | 2 | 4 | - | - | ½” Sp. | #3 @ 8” | 2.32 | 2.87 |
| IB-4 | I-shape | 2 | - | 10 | - | 2 | 4 | - | - | ½” Sp. | #3 @ 16” | 2.32 | 2.32 |
| IB-5 | I-shape | 2 | - | 10 | - | 2 | 4 | - | - | ½” Sp. | #3 @ 4” | 2.32 | 2.32 |
| IU-0 | I-shape | 2 | - | - | 10 | - | - | - | - | ½” Sp. | - | 2.375 | - |
| IU-1 | I-shape | 2 | - | - | 10 | 2 | - | 4 | - | ½” Sp. | #3 @ 8” | 2.375 | 1.90 |
| IU-2 | I-shape | 2 | - | - | 10 | 2 | - | 4 | - | ½” Sp. | #3 @ 8” | 2.375 | 2.375 |
| IU-3 | I-shape | 2 | - | - | 10 | 2 | - | 4 | - | ½” Sp. | #3 @ 8” | 2.375 | 2.875 |
| IU-4 | I-shape | 2 | - | - | 10 | 2 | - | 4 | - | ½” Sp. | #3 @ 16” | 2.375 | 2.375 |
| IU-5 | I-shape | 2 | - | - | 10 | 2 | - | 4 | - | ½” Sp. | #3 @ 4” | 2.375 | 2.375 |
| IU-6 | I-shape | 2 | - | - | 10 | 1 | - | 4 | - | ½” Sp. | #3 @ 8” | 2.375 | 2.375 |
| IU-7 | I-shape | 2 | - | - | 10 | 3 | - | 4 | - | ½” Sp. | #3 @ 8” | 2.375 | 2.375 |
| IU-8 | I-shape | 2 | - | - | 10 | 2 | - | 4 | - | ½” Sp. | #3 @ 8” | 2.375 | 2.375 |
| IBU-1 | I-shape | - | 10 | - | - | 2 | - | 4 | - | ½” Sp. | #3 @ 8” | - | 1.90 |
| IBU-2 | I-shape | - | 10 | - | - | 2 | - | 4 | - | ½” Sp. | #3 @ 8” | - | 2.375 |
| IBU-3 | I-shape | - | 10 | - | - | 2 | - | 4 | - | ½” Sp. | #3 @ 8” | - | 2.875 |
| IBU-4 | I-shape | - | 10 | - | - | 2 | - | 4 | - | ½” Sp. | #3 @ 16” | - | 2.375 |
| IBU-5 | I-shape | - | 10 | - | - | 2 | - | 4 | - | ½” Sp. | #3 @ 4” | - | 2.375 |
| IBU-6 | Box | 4 | - | 20 | - | 2 | - | 12 | - | ½” Sp. | #3 @ 8” | 2.32 | 2.375 |
| IBE-1 | Box | 4 | - | 20 | - | 2 | - | 8 | 4 | ½” Sp. | #3 @ 8” | 2.32 | 2.32 |
| IBE-2 | Box | 4 | - | 20 | - | 1 | - | 4 | 8 | ½” Sp. | #3 @ 8” | 2.32 | 2.32 |
| IEU-1 | Box | 4 | - | - | 20 | 2 | - | 8 | 4 | ½” Sp. | #3 @ 8” | 2.375 | 2.375 |
| IEU-2 | Box | 4 | - | - | 20 | 1 | - | 4 | 8 | ½” Sp. | #3 @ 8” | 2.375 | 2.375 |
Notes: PT = Post-Tensioned; Pret. = Pretensioned
in each group (Specimens IB-0 and IU-0) was constructed with only post-tensioned tendons in the bottom flange and without web tendons and transverse reinforcement. Specimens IB-0 and IU-0 directly compare the shear behavior of members with bonded or unbonded strands and evaluate the shear strength provided by the concrete without the influence of web ducts. Specimens in the IBU group contained pretensioned strands in the bottom flange and unbonded internal tendons in the web of the members. Specimens 1 through 5 in each IB, IU, and IBU group have the same details, except for the variation of bonded tendons, unbonded tendons, and pretensioned strands. For example, Specimens IB-1, IU-1, and IBU-1 are identical but contain different bond types (bonded, unbonded, and combination bonded/unbonded).
Specimens IU-2, IU-6, and IU-7 investigated the impact of the number of tendons in the web of a member. Specimen IU-2 contained two unbonded internal post-tensioned tendons in the web. Specimen IU-6 contained a single unbonded internal post-tensioned tendon in the web. Specimen IU-7 contained three unbonded internal post-tensioned tendons in the web. These specimens contained the same number of prestressing strands, and the tendons and strands were placed so that the centroid remained constant for the three specimens.
Specimen IU-8 was identical to Specimen IU-2 with respect to the locations of the unbonded post-tensioned tendons in the bottom flange and the web of the member. While Specimen IU-2 contained no bonded reinforcement, Specimen IU-8 contained two No. 4 longitudinal reinforcing bars in the bottom flange to investigate the influence of a nominal amount of mild reinforcement.


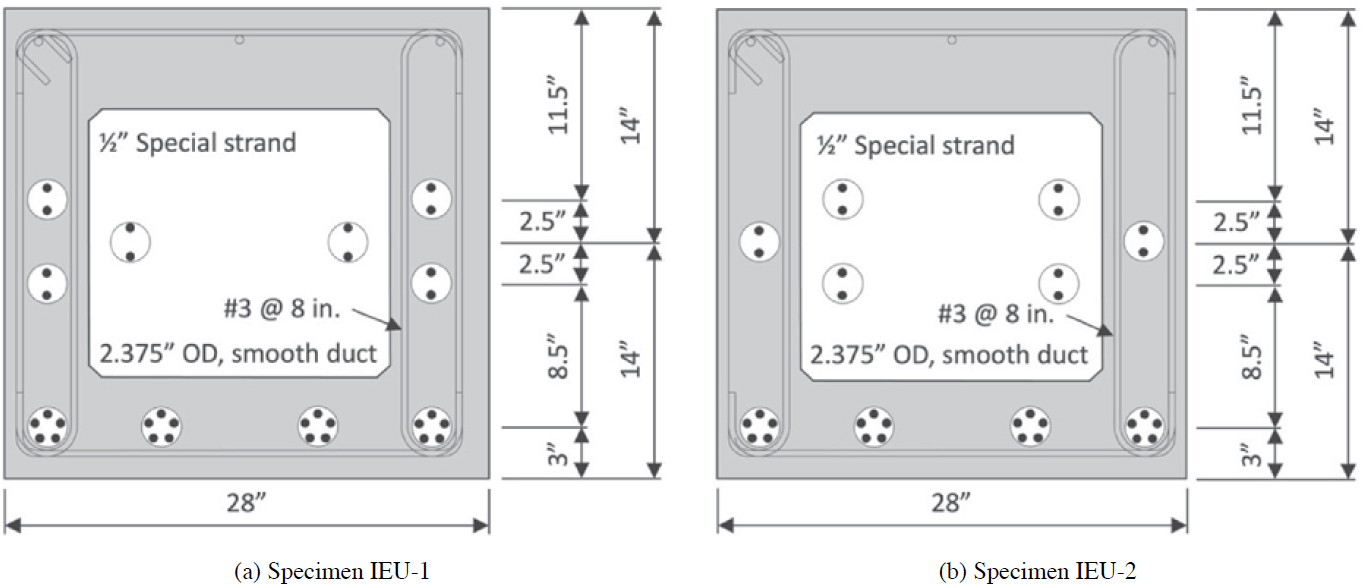
The box-shaped specimens (IBU-6, IBE-1, IBE-2, IEU-1, and IEU-2) contained a constant area of post-tensioning steel (32 – ½″ Special strands), a constant transverse reinforcement ratio (0.55%), and a constant duct diameter to web width ratio (0.48). Furthermore, the centroid of post-tensioning was maintained constant with the only variation being the distribution of prestressing steel provided between the web and external ducts. Specimen IBU-6 contained internal bonded post-tensioned tendons in the bottom flange and internal unbonded tendons in the web of the girder. Specimens IBE-1 and IBE-2 contained bonded internal post-tensioning in the bottom flange and web with external unbonded tendons in the void. Specimens IEU-1 and IEU-2 contained internal unbonded tendons in the bottom flange and web with external unbonded tendons in the void. Specimens IBU-6, IBE-1, and IEU-1 contained two ducts in each web of the member and were designed to evaluate the influence of the tendon bond type on the shear behavior of box-shaped specimens. Specimens IBE-2 and IEU-2 contained one duct in each of the webs and were also designed to evaluate the influence on tendon bond type and, through comparisons with Specimens IBE-1 and IEU-2, the influence on the variations in the distribution of internal and external tendons.
3.3.4.2 Test Setup and Instrumentation
3.3.4.2.1 Test Setup
Figure 3.29 illustrates the shear test setup, which provides a 6.5-ft constant shear region. Rollers were used at each of the two supports. The specimens were supported in the typical section to

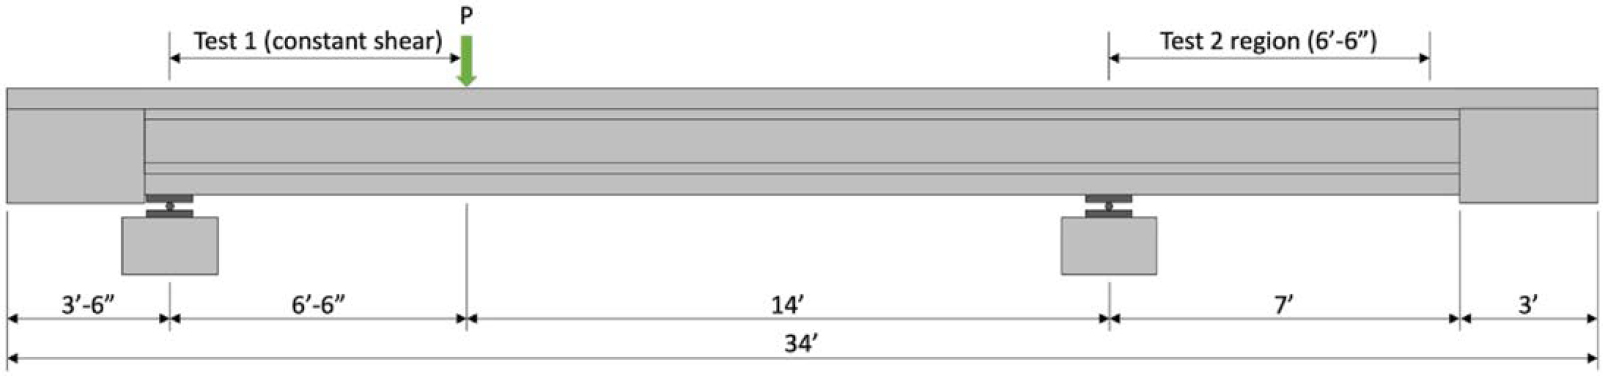
evaluate the shear behavior of the typical cross section, avoiding any influence from the end block regions. A load cell was installed in-line with the hydraulic cylinder to measure the force applied to the specimen, and a string potentiometer measured the displacement under the load point.
Most girders were designed for a single test; however, several girders were designed to facilitate two shear tests on a single beam. The girders designed for two tests were longer than the girders intended for a single test to allow the region of the second test to not be subjected to shear from the first test. The second test region cantilevered past the backspan support. The cantilever overhang then became the shear span for the second test. Figure 3.30 illustrates the test setup for a girder facilitating two shear tests. Figure 3.31 shows a specimen in the test setup before testing.
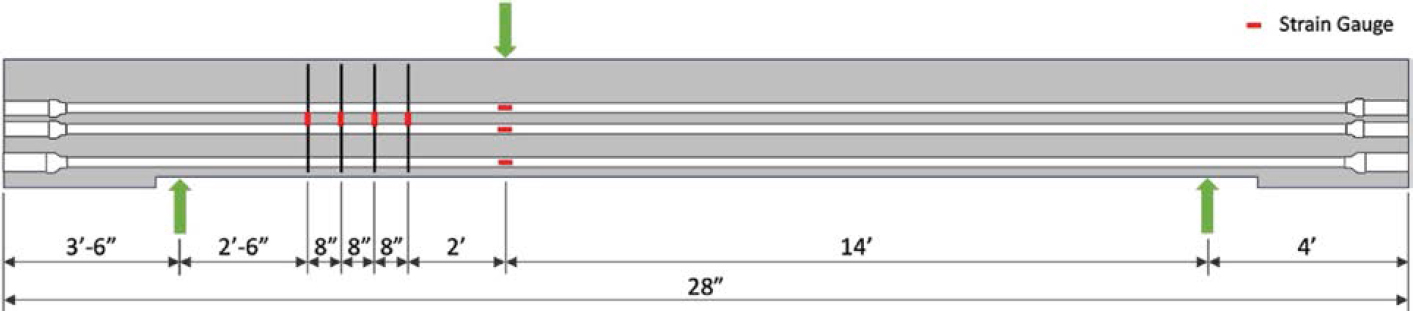
3.3.4.2.2 Instrumentation
Figure 3.32 shows the typical placement of strain gauges for the shear specimens. Strain gauges were installed on the legs of four stirrups in the test region and on prestressing strands at the load point. For the I-shaped specimens, strain gauges were installed on one strand in each post-tensioned tendon. For girders with pretensioned strands, a strain gauge was installed on two strands in the bottom layer of prestressing strands. If a girder was designed to facilitate two shear tests, a strain gauge was installed at the location of the applied load for each test along the same strand. For the box-shaped specimens, strain gauges were installed on one strand in two of the bottom flange tendons and in one tendon at each level of internal web tendons and external tendons.

3.3.4.3 Results
A summary of the details for the shear specimens, including the compressive and tensile strengths (fc, ft) of the concrete, compressive strength of the grout, and effective stresses (fpe) of the prestressed strands, is included in Table 3.13. A summary of the applied shears corresponding to first shear cracking, first flexural cracking, ultimate capacity, strand stresses at failure, and failure mechanism for each specimen is provided in Table 3.14.
For the shear specimens, load was applied to the girder using a hydraulic ram. For I-shaped specimens, the applied load was increased in 10-kip increments, and for box-shaped specimens, it was increased in 20-kip increments. Between load steps, the specimens were examined for the development and propagation of cracks.
For specimens with ducts in the web, the first observed cracking during testing was hairline cracks at the level of one or more of the web ducts. As the load increased, additional hairline cracks were observed along other web ducts, if present, until the shear cracks propagated through the depth of the web. Figure 3.33 shows typical first shear cracking observed at the level of one or more web ducts.
Flexural cracking developed during all of the shear tests. For specimens without bonded strands or mild reinforcement in the bottom flange, a single flexural crack developed at the location of the load point. For specimens with bonded strands or mild reinforcement in the bottom flange, the bonded reinforcement allowed for tensile strains to develop in the concrete along the bottom flange, and additional flexural cracks formed following the development of the first flexural crack under the load point.
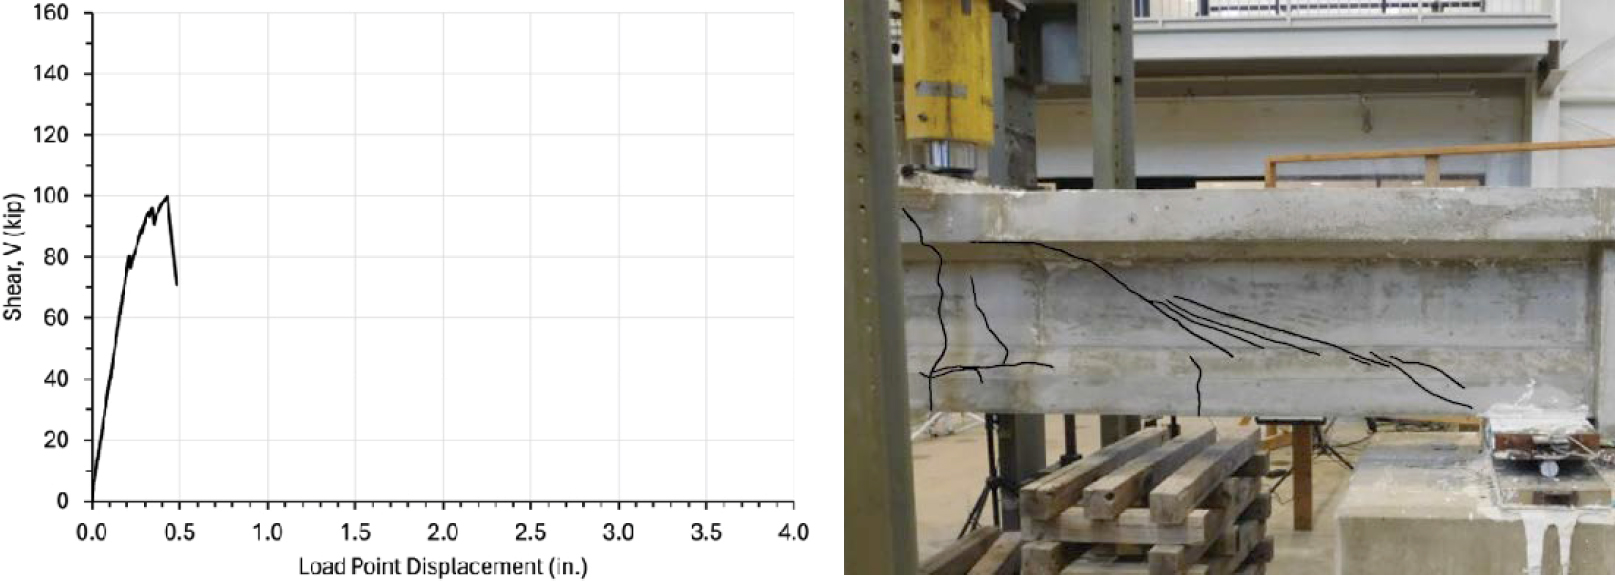
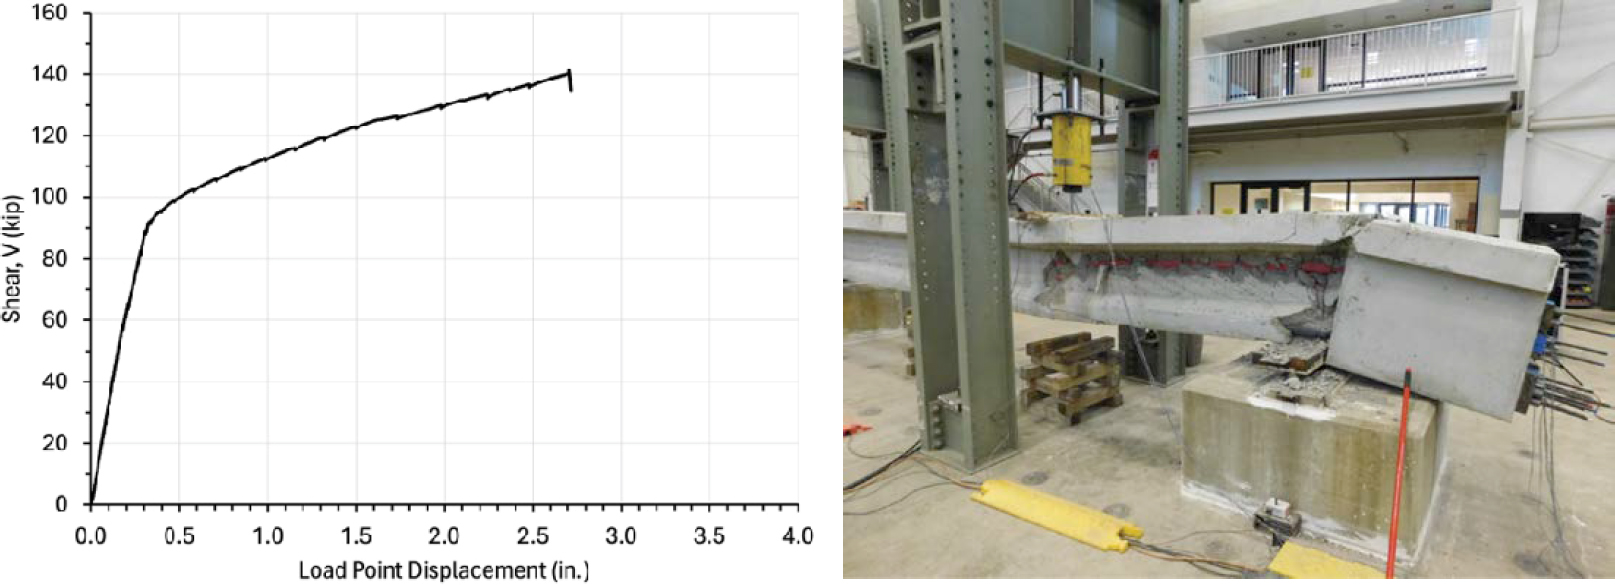
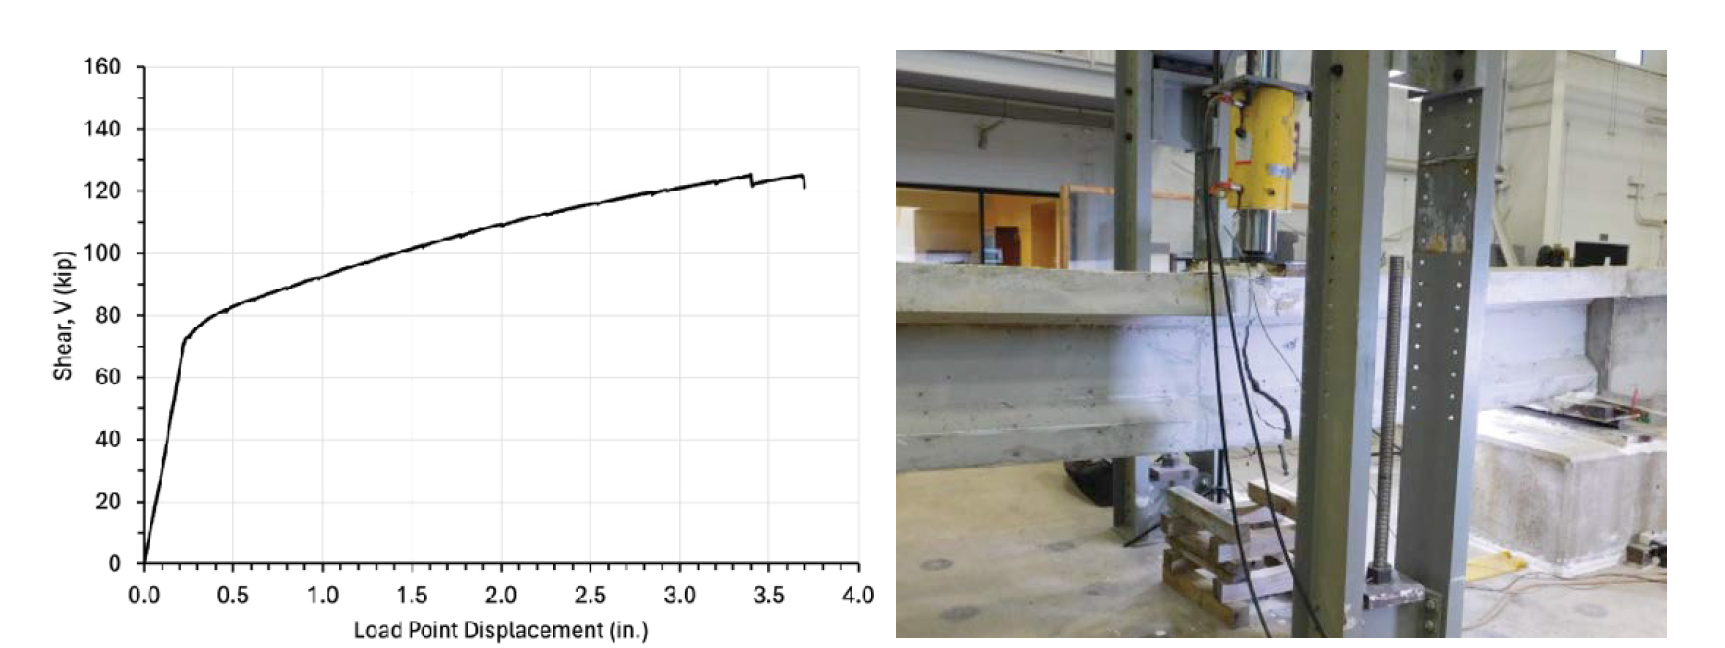
Table 3.14 lists the failure mechanisms for the shear specimens. In general, the following failure behaviors were observed: (1) flexure-shear, (2) web shear with concrete crushing at the level of the web duct(s), (3) compression flange crushing followed by explosive failure with crushing at the level of the web ducts, (3a) compression flange crushing was observed, and the test was discontinued to avoid an explosive failure of the web to preserve the second test region of the girder, (4) crushing and sliding along the level of the top web duct in box-shaped specimens, (5) flexural failure characterized by wire fracture in a strand, and (6) flexural failure characterized by concrete crushing in the top flange at the load point with a significant decrease in load-carrying capacity. A characteristic load deflection plot and photo for each failure mechanism are presented in Figure 3.34 through Figure 3.40. The load-deflection plots and photo of the failure of each specimen are provided in Appendix B.
3.3.4.3.1 Influence of Bond
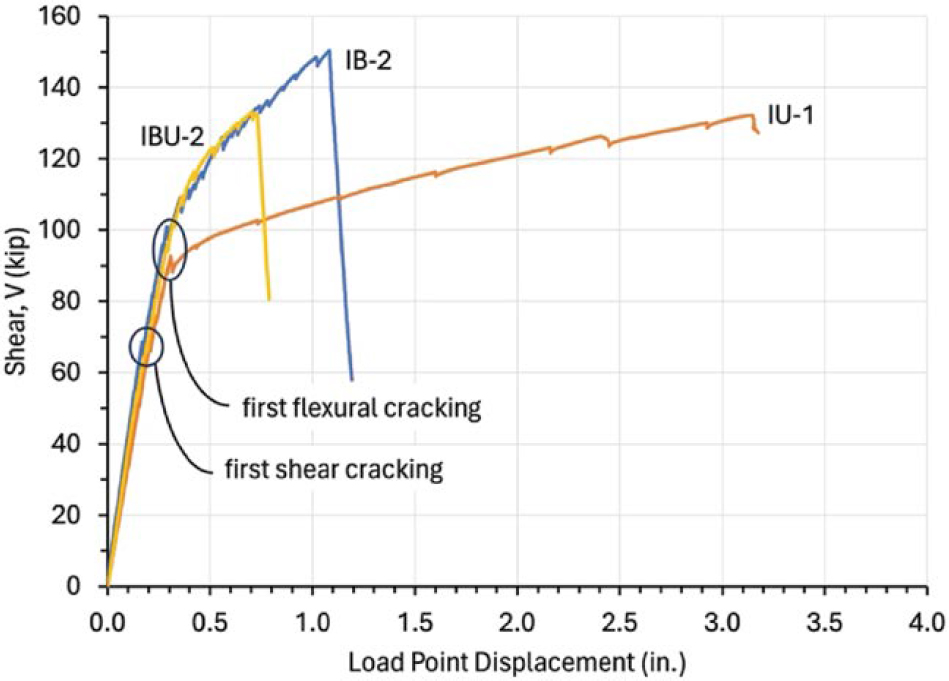
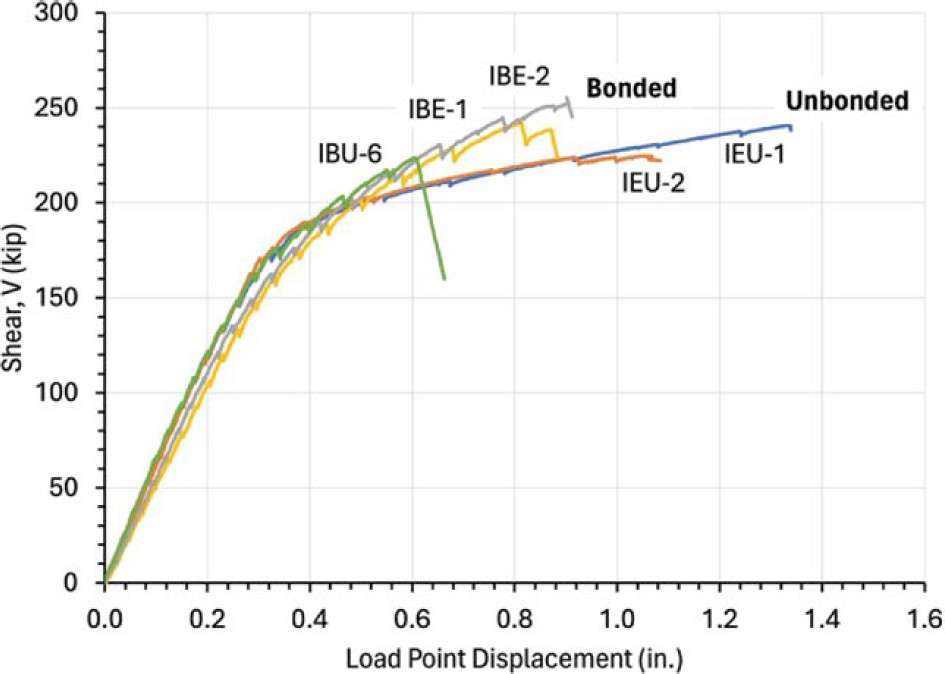
The load-deflection response for specimens with different combinations of unbonded and bonded strands is shown in Figure 3.41. Before first flexural cracking, similar behavior was observed. Except for Specimens IB-0 and IU-0 (specimens without web ducts), first observed cracking during the shear tests was hairline cracks at the level of one or more web ducts.
Table 3.13. Summary of shear specimen details.
| Specimen | Concrete fc (psi) | Concrete ft (psi) | Grout fc (psi) | Pretensioned Strands | Internal Bonded PT | Internal Unbonded PT | External Unbonded PT | ||||||||||||||
|---|---|---|---|---|---|---|---|---|---|---|---|---|---|---|---|---|---|---|---|---|---|
| Bottom Flange | Web | Bottom Flange | Web | ||||||||||||||||||
| Aps (in.2) | dps (in.) | fpe (ksi) | Aps (in.2) | dps (in.) | fpe (ksi) | Aps (in.2) | dps (in.) | fpe (ksi) | Aps (in.2) | dps (in.) | fpe (ksi) | Aps (in.2) | dps (in.) | fpe (ksi) | Aps (in.2) | dps (in.) | fpe (ksi) | ||||
| IB-0 | 10,780 | 890 | 7,380 | 1.67 | 25 | 156 | - | - | - | ||||||||||||
| IB-1 | 9,820 | 880 | 6,910 | 1.67 | 25 | * | 0.334 | 11.5 | 145 | ||||||||||||
| 0.334 | 16.5 | 156 | |||||||||||||||||||
| IB-2 | 11,000 | 860 | 8,590 | 1.67 | 25 | * | 0.334 | 11.5 | 142 | ||||||||||||
| 0.334 | 16.5 | 139 | |||||||||||||||||||
| IB-3 | 9,820 | 880 | 6,910 | 1.67 | 25 | * | 0.334 | 11.5 | * | ||||||||||||
| 0.334 | 16.5 | * | |||||||||||||||||||
| IB-4 | 10,730 | 960 | 8,640 | 1.67 | 25 | 145 | 0.334 | 11.5 | 156 | ||||||||||||
| 0.334 | 16.5 | 136 | |||||||||||||||||||
| IB-5 | 10,520 | 910 | 8,640 | 1.67 | 25 | * | 0.334 | 11.5 | 140 | ||||||||||||
| 0.334 | 16.5 | * | |||||||||||||||||||
| IU-0 | 9,360 | 740 | - | 1.67 | 25 | 153 | - | - | - | ||||||||||||
| IU-1 | 9,360 | 810 | - | 1.67 | 25 | 151 | 0.334 | 11.5 | 135 | ||||||||||||
| 0.334 | 16.5 | 131 | |||||||||||||||||||
| IU-2 | 9,360 | 810 | - | 1.67 | 25 | 160 | 0.334 | 11.5 | 136 | ||||||||||||
| 0.334 | 16.5 | 132 | |||||||||||||||||||
| IU-3 | 9,600 | 700 | - | 1.67 | 25 | 142 | 0.334 | 11.5 | 144 | ||||||||||||
| 0.334 | 16.5 | 140 | |||||||||||||||||||
| IU-4 | 9,040 | 800 | - | 1.67 | 25 | 140 | 0.334 | 11.5 | 144 | ||||||||||||
| 0.334 | 16.5 | 135 | |||||||||||||||||||
| IU-5 | 9,040 | 800 | - | 1.67 | 25 | 139 | 0.334 | 11.5 | 144 | ||||||||||||
| 0.334 | 16.5 | 135 | |||||||||||||||||||
| IU-6 | 9,400 | 730 | - | 1.67 | 25 | * | 0.668 | 14 | * | ||||||||||||
| IU-7 | 8,880 | 730 | - | 1.67 | 25 | 130 | 0.167 | 9 | 152 | ||||||||||||
| 0.334 | 14 | 125* | |||||||||||||||||||
| 0.167 | 19 | ||||||||||||||||||||
| IU-8 | 9,660 | 720 | - | 1.67 | 25 | * | 0.334 | 11.5 | 142 | ||||||||||||
| 0.334 | 16.5 | 142 | |||||||||||||||||||
| IBU-1 | 10,450 | 820 | - | 1.67 | 24.4 | 147 | - | - | - | 0.334 | 11.5 | 154 | |||||||||
| 0.334 | 16.5 | 145 | |||||||||||||||||||
| IBU-2 | 11,020 | 910 | - | 1.67 | 24.4 | 159 | - | - | - | 0.334 | 11.5 | 118 | |||||||||
| 0.334 | 16.5 | 142 | |||||||||||||||||||
| IBU-3 | 10,570 | 880 | - | 1.67 | 24.4 | 140 | - | - | - | 0.334 | 11.5 | 155 | |||||||||
| 0.334 | 16.5 | 150 | |||||||||||||||||||
| IBU-4 | 11,110 | 1,020 | - | 1.67 | 24.4 | 140 | - | - | - | 0.334 | 11.5 | 146 | |||||||||
| 0.334 | 16.5 | 147 | |||||||||||||||||||
| IBU-5 | 11,300 | 900 | - | 1.67 | 24.4 | 159 | - | - | - | 0.334 | 11.5 | 144 | |||||||||
| 0.334 | 16.5 | 147 | |||||||||||||||||||
| IBU-6 | 10,700 | 880 | 7,510 | - | - | - | 3.34 | 25 | 140 | 1.002 | 11.5 | * | |||||||||
| 1.002 | 16.5 | 143 | |||||||||||||||||||
| IBE-1 | 10,720 | 860 | 7,920 | 3.34 | 25 | * | 0.334 | 11.51 | 136 | 0.334 | 14 | 147 | |||||||||
| 0.334 | 6.5 | 137 | |||||||||||||||||||
| IBE-2 | 8,730 | 670 | 6,250 | 3.34 | 25 | * | 0.334 | 14 | * | 0.334 | 11.5 | * | |||||||||
| 0.334 | 16.5 | * | |||||||||||||||||||
| IEU-1 | 9,440 | 690 | - | 3.34 | 25 | * | 0.334 | 11.5 | * | 0.334 | 14 | 142 | |||||||||
| 0.334 | 16.5 | * | |||||||||||||||||||
| IEU-2 | 8,920 | 710 | - | 3.34 | 25 | 165 | 0.334 | 14 | 143 | 0.334 | 11.5 | * | |||||||||
| 0.334 | 16.5 | 131 | |||||||||||||||||||
Notes: PT = post-tensioned
*Gauge lost
Table 3.14. Shear test results summary.
| Specimen | First Shear Cracking Shear (kip) | First Flexural Cracking Shear (kip) | Top Flange Crushing Shear (kip) | Ultimate Shear Capacity (kip) | fps (ksi) | Failure Mechanism† | |||
|---|---|---|---|---|---|---|---|---|---|
| Bottom Flange | Bottom Web/External | Top Web/External | Middle Web/External | ||||||
| IB-0 | - | 80 | - | 100 | * | - | - | - | FV |
| IB-1 | 75 | 96 | - | 156 | * | 196 | 152 | - | WV |
| IB-2 | 70 | 103 | - | 150 | * | 202 | 149 | - | WV |
| IB-3 | 53 | 96 | - | 133 | * | * | * | - | WV |
| IB-4 | 74 | 97 | - | 134 | 209 | 165 | 167 | - | WV |
| IB-5 | 61 | 102 | - | 181 | * | * | 251 | - | CF-E |
| IU-0 | - | 72 | 109 | 125 | 241 | - | - | - | FW |
| IU-1 | 69 | 98 | 119 | 135 | 211 | 173 | 162 | - | CF-E |
| IU-2 | 70 | 96 | 126 | 129 | 212 | 163 | 155 | - | CF |
| IU-3 | 58 | 89 | 126 | 140 | 214 | 183 | 172 | - | CF-E |
| IU-4 | 55 | 82 | - | 102 | 160 | 146 | 151 | - | WV |
| IU-5 | 59 | 82 | - | 113 | 174 | 155 | 155 | - | CF |
| IU-6 | 68 | 87 | 119 | 131 | * | - | - | * | CF-E |
| IU-7 | 63 | 84 | 112 | 133 | * | 151 | 157 | 167 | CF-E |
| IU-8 | 61 | 96 | - | 135 | * | 172 | 157 | - | CF-E |
| IBU-1 | 68 | 82 | - | 135 | 240 | 153 | 161 | - | WV |
| IBU-2 | 55 | 99 | - | 134 | 214 | 151 | 120 | - | WV |
| IBU-3 | 44 | 81 | - | 126 | 222 | 157 | 161 | - | WV |
| IBU-4 | 60 | 96 | - | 115 | 178 | 152 | 148 | - | WV |
| IBU-5 | 55 | 96 | - | 157 | * | 166 | 157 | - | CF-E |
| IBU-6 | 70 | 181 | - | 230 | 148 | * | 150 | - | CS |
| IBE-1 | 127 | 164 | - | 245 | * | 152 | 142 | 148 | CS |
| IBE-2 | 112 | 126 | - | 260 | * | * | * | * | FC |
| IEU-1 | 96 | 174 | - | 242 | * | * | * | 156 | FC |
| IEU-2 | 119 | 170 | - | 225 | * | 137 | * | 150 | FC |
*Gauge lost
† FV = flexure-shear; WV = web shear with web crushing; CF-E = compression flange crushing followed by explosive failure with crushing at the level of web ducts; CF = compression flange crushing, test discontinued to avoid explosive failure of web; CS = crushing and sliding along web duct; FW = flexural failure due to wire fracture; FC = flexural failure due to top flange crushing

Cracks were generally observed throughout the depth of the web before flexural cracking. Initial cracking in the web resulted in a slight decrease in the stiffness of the members, but the behavior was independent of the bond type.
Behavior of the specimens after first flexural cracking depended on the unbonded or bonded condition of the prestressing strands. The stiffness of the girders decreased after first flexural cracking, as shown in Figure 3.41. The specimens with bonded strands in the bottom flange and webs experienced a decrease in post-flexural cracking stiffness as would be expected. The specimens with unbonded strands in the bottom flange and web, however, experienced a significantly reduced stiffness after flexural cracking. This stiffness was much lower than that of the bonded case. Finally, specimens with bonded prestressing strands in the bottom flange and unbonded strands in the web experienced essentially identical stiffnesses to those with bonded bottom flange and web tendons. The difference in stiffness after flexural cracking was directly influenced by the bond of the strands and was not influenced by other test variables included in the study.


The failure behavior of the specimens varied depending on whether the prestressed reinforcement in the bottom flange was bonded or unbonded. I-shaped specimens with bonded prestressing strands in the bottom flange (except for Specimens IB-0, IB-5, and IBU-5) had failures characterized by concrete crushing in the web at the location of one or more web ducts. Specimens in the IB group (bonded bottom flange and web tendons) had slightly greater shear strengths than specimens in the IBU group (bonded bottom flange tendons and unbonded web tendons). The presence of grout in the bonded web ducts contributed to the overall strength of the member.
Specimens with unbonded strands in the bottom flange and web failed at or near the ultimate flexural capacity of the girders with the exception of Specimen IU-4. Overall, the capacity of the girders in the IU group was significantly less than that of the ultimate capacity of specimens in the IB and IU groups. Concrete crushing was observed during the tests of the IU specimens in the top flange at the location of the load point. For most specimens, the load continued to be increased until the concrete suddenly crushed at the location of the top web duct in the test region, accompanied by a sudden loss in load-carrying capacity. Specimen IU-4 did not fail in this manner because it contained the lowest transverse reinforcement ratio. The low transverse reinforcement ratio decreased the contribution of the transverse steel to a level that changed the failure mechanism from a sudden crushing at the level of the top duct seen in other IU specimens to crushing at the level of the top duct that was not accompanied by such a sudden loss in load-carrying capacity. The failure of Specimen IU-4 was similar to the failures of specimens in the IB and IBU groups than the other specimens in the IU group.
3.3.4.3.2 Influence of Duct Diameter to Web Width Ratio
The duct diameter to web width ratio influenced the initial cracking behavior of the test specimens. The first shear cracking observed for specimens with the smallest duct diameter to web width ratio of 0.38 (Specimens IB-1 and IBU-1) were cracks that developed through the depth of the web. Specimens IB-2 and IBU-2, with a duct diameter to web width ratio of 0.47, and Specimens IB-3 and IBU-3, with a ratio of 0.58, had initial shear cracks in the web that were concentrated at the level of the web ducts and did not immediately develop shear cracks through the depth of the web. Figure 3.42 shows the first observed cracking for these six specimens.
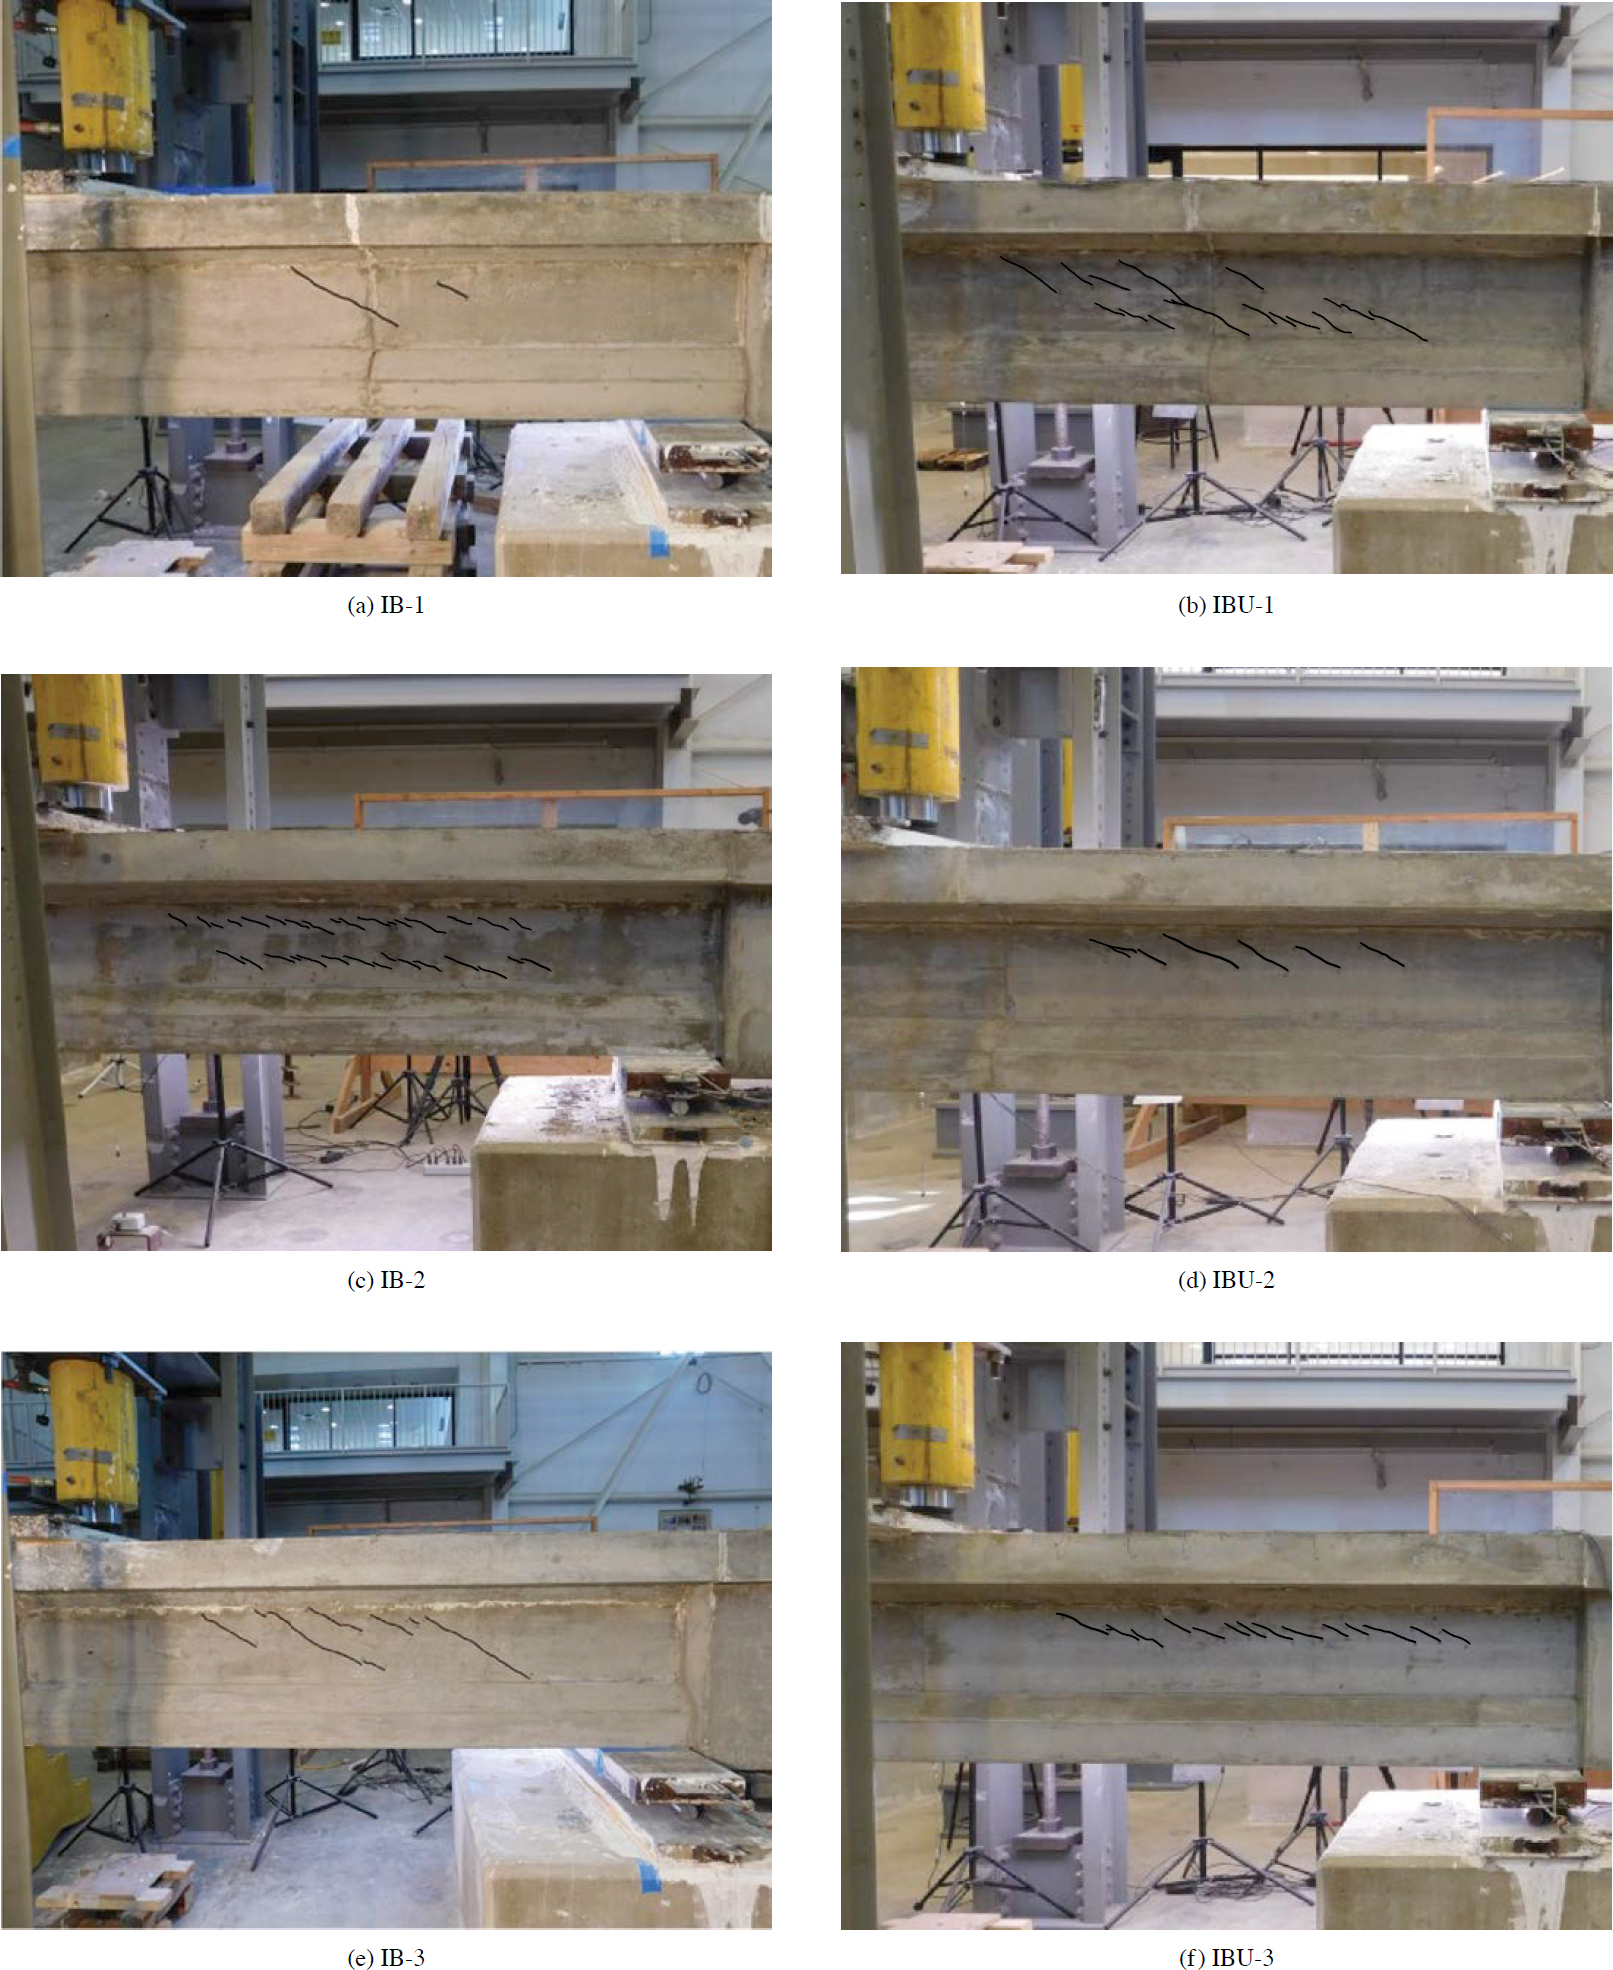
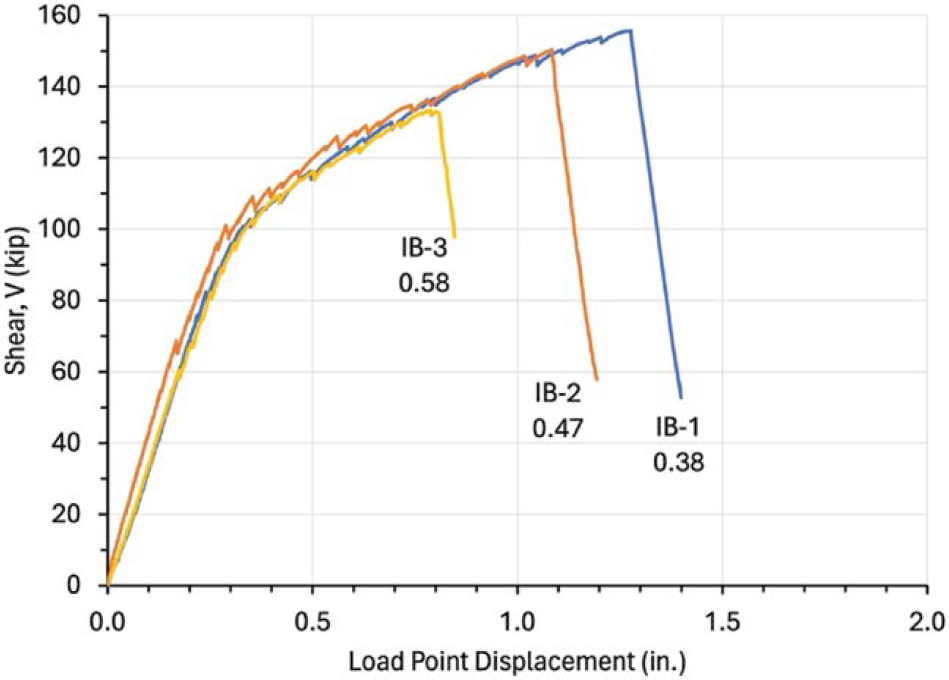
Figure 3.43 compares the load-deflection curves for Specimens IB-1, IB-2, and IB-3 while Figure 3.44 compares the load-deflection curves for Specimens IBU-1, IBU-2, and IBU-3. These specimens directly compared the influence of the duct diameter to web width ratio and had the same failure mechanism which was characterized by concrete crushing at the level of the top duct. As the duct diameter to web width increased, the ultimate capacity decreased. It should be noted that Specimens IBU-1 and IBU-3 had a lower effective stress in the bottom flange pretensioned strands relative to Specimen IBU-2. This difference in prestressing resulted in a decrease in the stiffness response and the flexural cracking loads for these specimens. Table 3.15 provides a summary of the ultimate shear capacities.

Table 3.15. Summary of ultimate shear capacities for different duct diameter to web width ratios, IBU and IBU groups.
| Specimen | fc (psi) | Øduct/bw | Ultimate Shear Capacity (kip) |
|---|---|---|---|
| IB-1 | 9,820 | 0.38 | 156 |
| IB-2 | 11,000 | 0.47 | 150 |
| IB-3 | 9,820 | 0.58 | 133 |
| IBU-1 | 10,450 | 0.38 | 135 |
| IBU-2 | 11,020 | 0.47 | 134 |
| IBU-3 | 10,570 | 0.58 | 126 |
Figure 3.45 compares the load-deflection curves for Specimens IU-1, IU-2, and IU-3. The failure shears and corresponding calculated flexural capacities are provided in Table 3.16. These specimens experienced large displacements, and failure initiated through crushing of the top flange at the load point, resulting in flexural behavior controlling ultimate capacity. The failure loads were very similar and above the flexural capacities calculated using unbonded strand stresses in accordance with the LRFD BDS (AASHTO 2020). Due to the unbonded flexural behavior, it was not possible for a flexure-shear failure to occur as flexural cracks could not initiate in the bottom flange except at the location of the load point. Conclusions regarding the influence of duct diameter to web width ratios for these completely unbonded specimens are not possible as shear failures did not occur.

Table 3.16. Summary of ultimate shear capacities for different duct diameter to web width ratios, IU group.
| Specimen | fc (psi) | Øduct/bw | Ultimate Shear Capacity | Calculated Flexural Capacity (in terms of shear) |
|---|---|---|---|---|
| IU-1 | 9,360 | 0.38 | 135 | 123 |
| IU-2 | 9,360 | 0.47 | 129 | 125 |
| IU-3 | 9,600 | 0.58 | 140 | 133 |
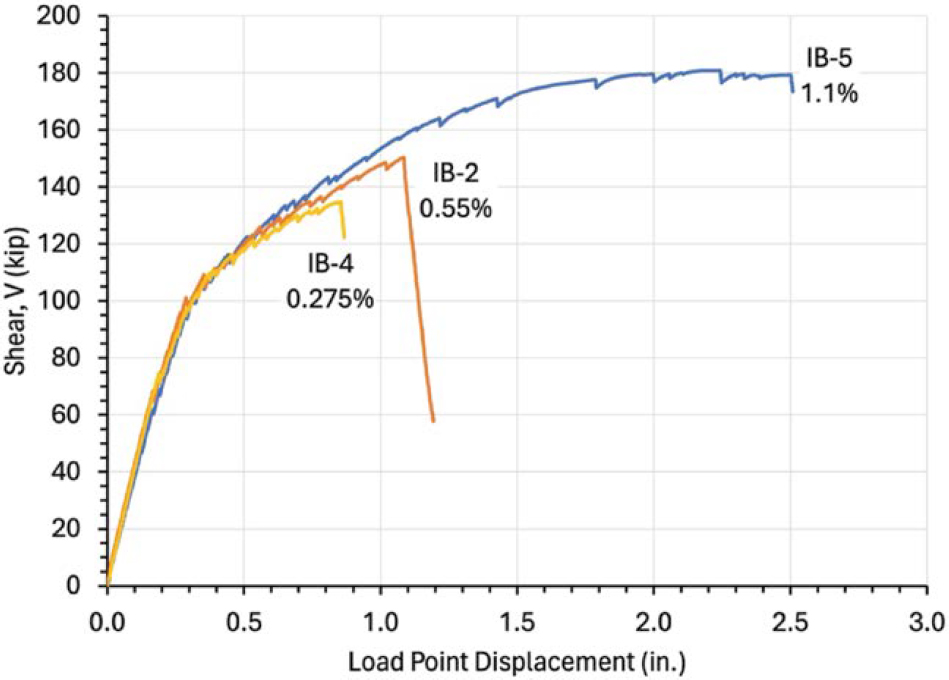
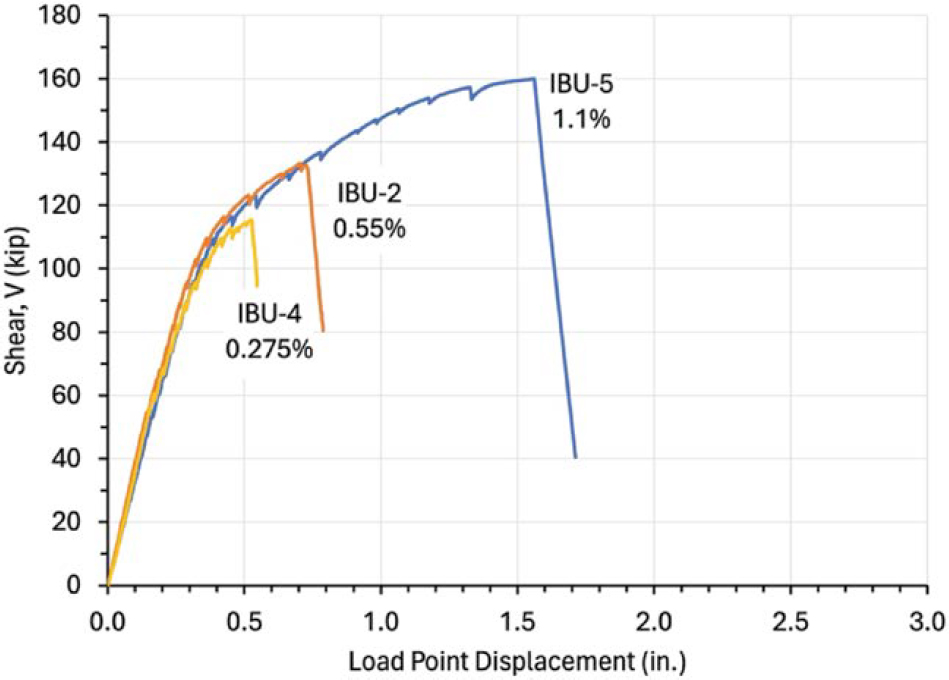
Table 3.17. Summary of ultimate shear capacities for different transverse reinforcement ratios.
| Specimen | fc (psi) | Transverse Reinf. | ρv (%) | Ultimate Shear Capacity (kip) |
|---|---|---|---|---|
| IB-4 | 10,730 | #3 @ 16” | 0.275 | 134 |
| IB-2 | 11,000 | #3 @ 8” | 0.55 | 153 |
| IB-5 | 10,520 | #3 @ 4” | 1.1 | 181 |
| IBU-4 | 11,110 | #3 @ 16” | 0.275 | 115 |
| IBU-2 | 11,020 | #3 @ 8” | 0.55 | 134 |
| IBU-5 | 10,700 | #3 @ 4” | 1.1 | 157 |
| IU-4 | 9,040 | #3 @16” | 0.275 | 102 |
3.3.4.3.3 Influence of Transverse Reinforcement Ratio
As the transverse reinforcement ratio increased, the presence of additional steel contributed to resisting the shear forces and increased the shear capacity of the girders. Table 3.17 summarizes the details and ultimate capacities of the girders in the IB, IBU, and IU groups with varying transverse reinforcement ratios. Figures 3.46 and 3.47 present the load-deflection responses for each transverse reinforcement ratio in the IB and IU groups, respectively. The load-deflection responses for each group illustrate essentially identical behavior until failure, isolating the influence of the transverse reinforcement ratio on the behavior of the specimens. All specimens with the exception of IB-5 experienced a shear failure. For IB-5, sufficient shear strength was provided through the transverse reinforcement to result in a flexural failure.
Each of the specimens in the IU group with varied transverse reinforcement ratios, with the exception of Specimen IU-4, failed at a capacity at or near the flexural capacity, resulting in almost identical ultimate strengths. Specimen IU-4 contained the minimum amount of transverse reinforcement and experienced a failure characterized by concrete crushing at the level of the top web duct. The failure mechanism for Specimen IU-4 was the same as the specimens in the IB and IBU groups presented in this section. As would be expected, the failure load of Specimen IU-4 was less than that of any other specimen in the IU group. However, a clear comparison of
the effect of the transverse reinforcement ratio for specimens in the IU group is not clear due to the failure mechanisms of other specimens in the IU group.
Each of the specimens with varied transverse reinforcement ratios had strain gauges installed at the mid-height of the members distributed on stirrups in the middle of the test region. Based on readings from these strain gauges, at least one stirrup in the test region reached the steel’s yield strength for these specimens.
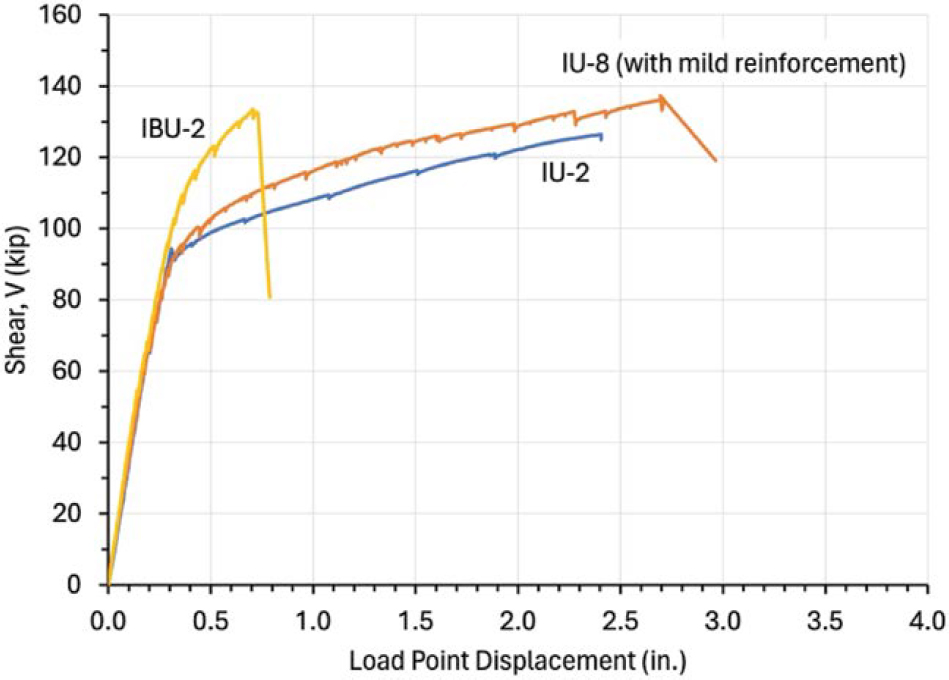
3.3.4.3.4 Influence of the Presence of Longitudinal Mild Reinforcement
The inclusion of mild reinforcement in the bottom flange with unbonded post-tensioning resulted in a distribution of flexural cracks similar to the distribution of cracks observed in specimens with bonded tendons. However, the failure mechanism of Specimen IU-8, with mild reinforcement in the bottom flange, was identical to that of similar specimens with all unbonded post-tensioning tendons without mild reinforcement. Figure 3.48 shows the load-deflection response for Specimen IU-2, IU-8, and IBU-2. The nominal amount of mild steel included in Specimen IU-8 allowed for a better distribution of flexural cracking and improved the post-flexural cracking stiffness. As shown, the overall behavior was closer to Specimen IU-2 (without mild reinforcement) than the behavior of specimen IBU-2 with bonded pretensioned strands in the bottom flange as the unbonded tendons controlled the overall load-deflection response.
3.3.4.3.5 Influence of Number of Ducts in the Web
The test specimens with different numbers of ducts in the web were included in the IU group, and the load displacement response for these specimens is shown in Figure 3.49. These specimens experienced large displacements, and failure initiated through crushing of the top flange at the load point, resulting in flexural behavior controlling ultimate capacity. While shear failures did not occur, no difference in behavior during testing was observed due to the number of web ducts.
3.3.4.3.6 Influence of Tendon Location
Based on the test results from the box-shaped specimens in the IBU, IBE, and IEU groups, the distribution of internal and external tendons did not influence the overall behavior or capacity of
the members. Specimens IBU-6, IBE-1, and IEU-1 contained two tendons in each web while Specimens IBE-2 and IEU-2 contained one tendon in each web. Specimens in the IBE and IEU groups also contained external tendons. As shown in Figure 3.50, the overall behavior of these specimens is essentially identical for the specimens within each bond type (bonded or unbonded). A difference in the post-flexural cracking response is observed in comparing the specimens with bonded tendons relative to specimens with unbonded tendons. The specimens with bonded tendons had a slightly greater shear capacity; however, comparing IBE-1 (bonded) with IEU-1(unbonded), the shear capacities could be considered identical (245 kips vs. 242 kips). Considering the different tendon configurations, the specimens in each group (IBE and IEU) had similar failure loads.

3.3.4.4 Shear Conclusions
The following are the conclusions from the experimental investigation for shear:
- Behavior after first flexural cracking depended on the bond type of the prestressing strands. The stiffness after first flexural cracking for specimens with unbonded strands in the bottom flange was significantly less than the stiffness after first flexural cracking for the specimens with bonded strands in the bottom flange.
- The bond type of the web tendons did not significantly influence the shear capacity. For specimens with bonded strands in the bottom flange, the specimens with bonded web tendons produced only a slightly higher shear strength than those with unbonded web tendons.
- An increase in the duct diameter to web width ratio decreased the overall shear capacity of the girders. For specimens with bonded strands in the bottom flange, shear failure occurred by concrete crushing at the level of the top duct.
- An increase in the transverse reinforcement ratio resulted in an increase in the shear capacity of the girders.
- The distribution of internal and external web tendons did not influence the overall behavior or capacity of the girders.
3.3.5 Torsion
Six torsion specimens were designed and tested. This section describes the details and results of the tests.
3.3.5.1 Specimen Design
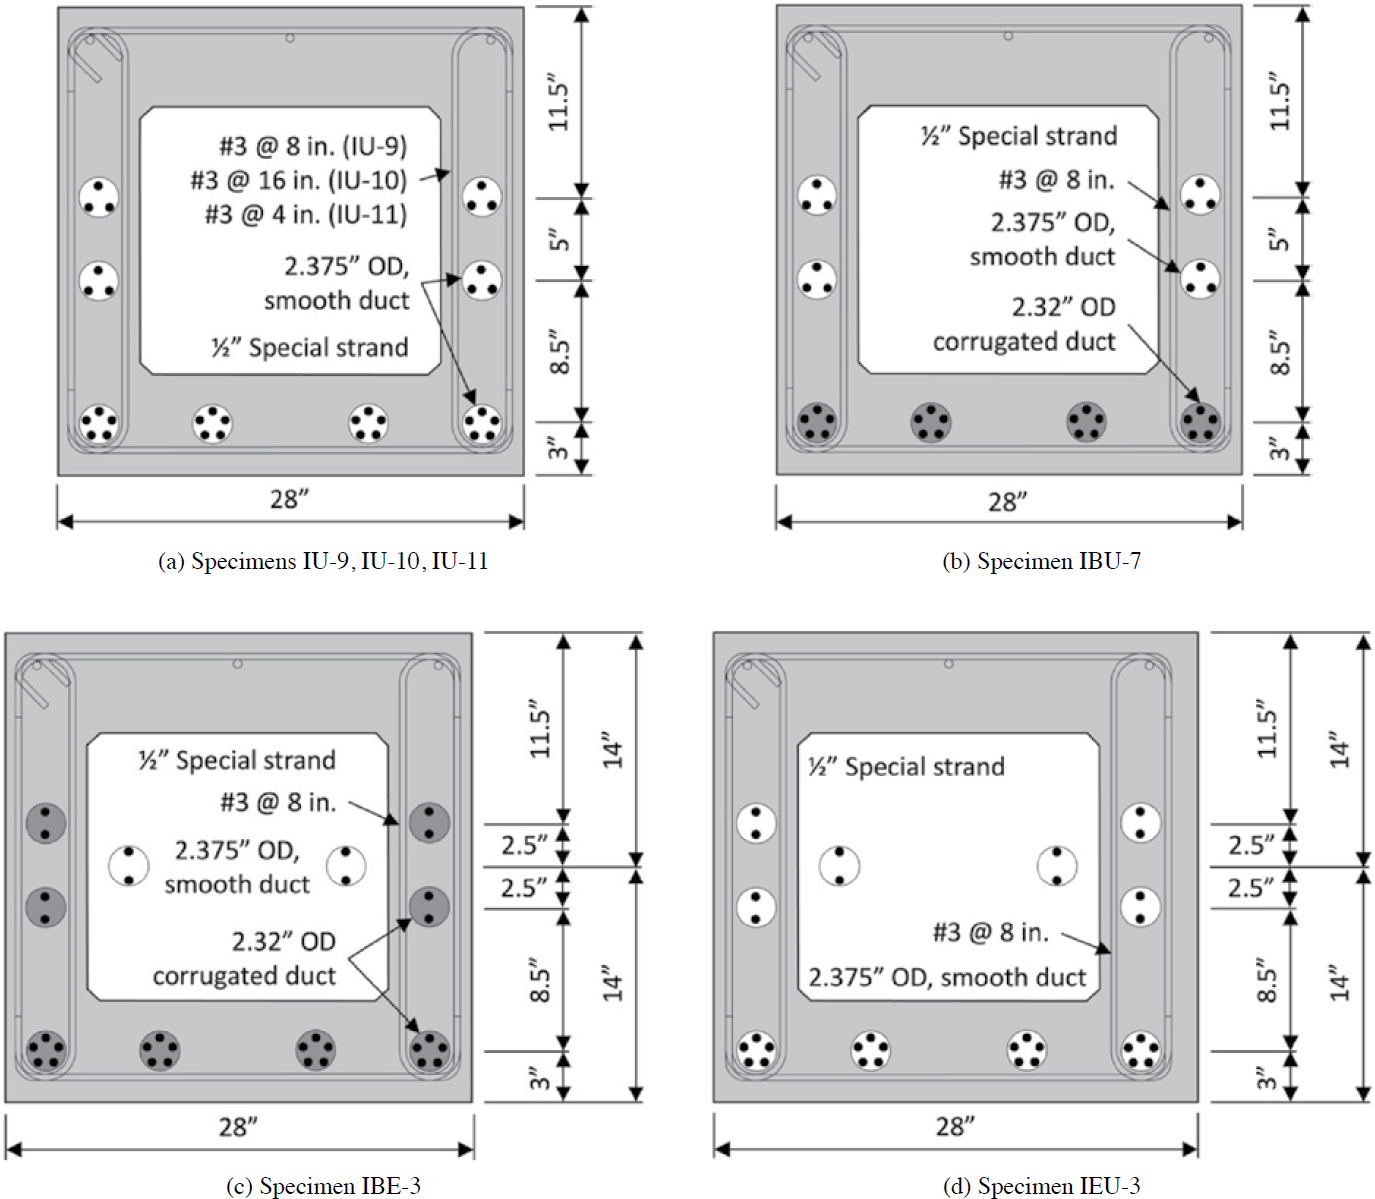
The test matrix for torsional testing, including general details of each specimen, is provided in Table 3.18. The specimens were box-shaped and included the same number of prestressing strands (32) to achieve the same initial prestress force. Twenty strands were placed in each bottom flange, and 12 strands were distributed in the web region (internally and externally). The typical section designs for the torsion specimens are illustrated in Figure 3.51.
Table 3.18. Test matrix for torsion tests.
| Specimen | Member Type | No. of Tendons, Bottom Flange | No. of Internal Strands, Bottom Flange | No. of Tendons, Web | No. of Internal Strands, Webs | No. of External Unbonded PT Strands | Strand Dia. | Transverse Reinf. | Øduct, Flange (in.) | Øduct, Web (in.) | ||
|---|---|---|---|---|---|---|---|---|---|---|---|---|
| Bonded PT | Unbonded PT | Bonded PT | Unbonded PT | |||||||||
| IU-9 | Box | 4 | - | 20 | 2 | - | 12 | - | ½” Sp. | #3 @ 8” | 2.375 | 2.375 |
| IU-10 | Box | 4 | - | 20 | 2 | - | 12 | - | ½” Sp. | #3 @ 16” | 2.375 | 2.375 |
| IU-11 | Box | 4 | - | 20 | 2 | - | 12 | - | ½” Sp. | #3 @ 4” | 2.375 | 2.375 |
| IBU-7 | Box | 4 | 20 | - | 2 | - | 12 | - | ½” Sp. | #3 @ 8” | 2.32 | 2.375 |
| IBE-3 | Box | 4 | 20 | - | 2 | 8 | - | 4 | ½” Sp. | #3 @ 8” | 2.32 | 2.375 |
| IEU-3 | Box | 4 | - | 20 | 2 | - | 8 | 4 | ½” Sp. | #3 @ 8” | 2.375 | 2.375 |
The transverse reinforcement ratio (ρv = Av/bws) and the bond type of the internal tendons were primary variables in the experimental program for torsion. The three transverse reinforcement ratios were 0.275%, 0.55%, and 1.10% and were achieved using two-legged No. 3 stirrups in each web spaced at 16 in., 8 in., and 4 in., respectively.
3.3.5.2 Test Setup and Instrumentation
3.3.5.2.1 Test Setup
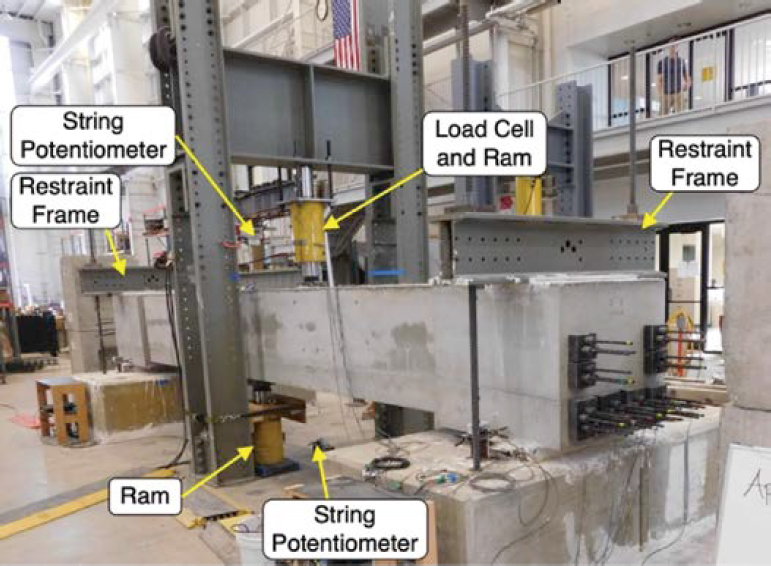
The torsion test setup consisted of a load frame located at midspan of each specimen and two restraint frames located at 1 ft from the end of each specimen (Figure 3.52). Two hydraulic cylinders were used to apply an eccentric load at midspan, creating two identical constant torsion regions on either side of the load point. One hydraulic cylinder applied a downward force from the load frame, and the other applied an upward force from the strong floor. These opposing forces were separated by a horizontal eccentricity of 20.5 in. A load cell was installed in-line with the hydraulic cylinder applying load to the top of the specimen to measure the force applied to the specimen, and string potentiometers measured the displacement also in-line with the applied loads. Figure 3.53 shows a specimen in the test setup before testing.

3.3.5.2.2 Instrumentation
Figure 3.54 shows the typical placement of strain gauges for the torsion specimens. Strain gauges were installed on the legs of four stirrups in the test region and on prestressing strands near the middle of the torsion span. Strain gauges were installed on one strand in each post-tensioned tendon. Specimens IU-10 and IU-11, which were identical with the exception of stirrup spacing, were contained in the same beam. For this beam, different stirrup spacings were provided on either side of midspan, and strain gauges were provided in both torsion spans.
3.3.5.3 Results
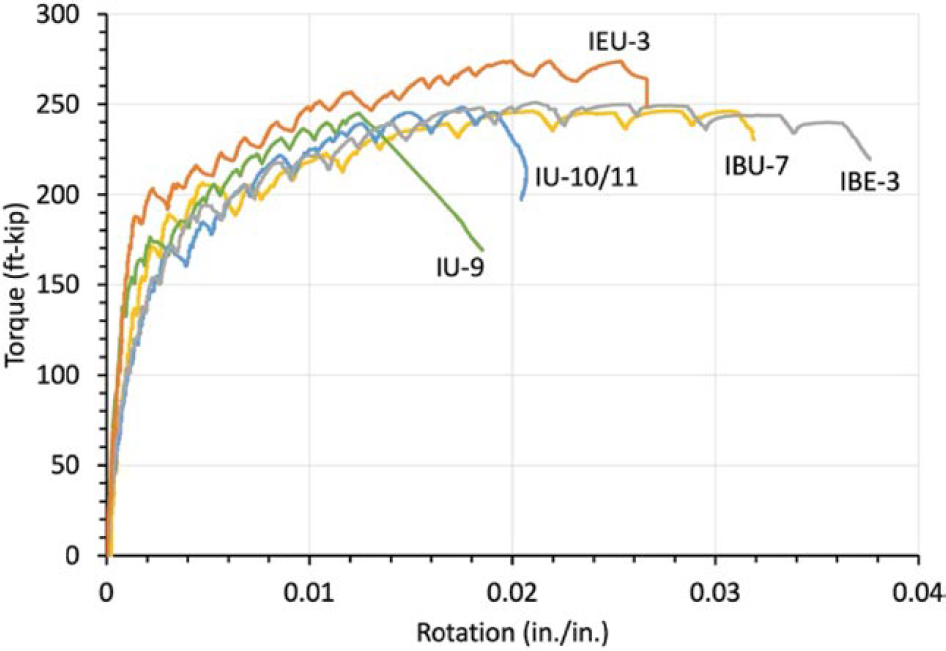
A summary of details for the flexure specimens, including the compressive and tensile strengths (fc, ft) of the concrete, compressive strength of the grout (fc), and effective stresses (fpe) of the prestressed strands, is included in Table 3.19. A summary of the applied load and applied torque corresponding to the cracking loads (first web cracking and first torsional cracking) and the failure loads are summarized in Table 3.20. The torque reported in Table 3.20 is the torque resisted by each test region and is half of the applied midspan torque. The torque-rotation responses for each of the torsional specimens are provided in Figure 3.55 while Figure 3.56 presents all tests in the same plot. The rotation was determined by adding the two displacements at midspan and dividing the combined displacement by the horizontal distance between the displacement transducers.

Table 3.19. Summary of torsion specimen details.
| Specimen | Conc. Location† | Concrete fc (psi) | Concrete ft (psi) | Groutfc (psi) | Internal Bonded PT | Internal Unbonded PT | External Unbonded PT | ||||||||||||
|---|---|---|---|---|---|---|---|---|---|---|---|---|---|---|---|---|---|---|---|
| Bottom Flange | Web | Bottom Flange | Web | ||||||||||||||||
| Aps (in.2) | dps (in.) | fpe (ksi) | Aps (in.2) | dps (in.) | fpe (ksi) | Aps (in.2) | dps (in.) | fpe (ksi) | Aps (in.2) | dps (in.) | fpe (ksi) | Aps (in.2) | dps (in.) | fpe (ksi) | |||||
| IU-9 | TF, W | 10,800 | 750 | - | - | - | - | - | - | - | 3.34 | 25 | 143 | 1.002 | 11.5 | * | - | - | - |
| BF | 10,200 | 730 | 1.002 | 16.5 | 125 | ||||||||||||||
| IU-10 | TF, W | 8,230 | 610 | - | - | - | - | - | - | - | 3.34 | 25 | 132 | 1.002 | 11.5 | * | - | - | - |
| BF | 7,410 | 650 | 1.002 | 16.5 | 142 | ||||||||||||||
| IU-11 | TF, W | 8,230 | 610 | - | - | - | - | - | - | - | 3.34 | 25 | 132 | 1.002 | 11.5 | * | - | - | - |
| BF | 7,410 | 650 | 1.002 | 16.5 | 142 | ||||||||||||||
| IBU-7 | TF | 10,890 | 930 | 9,160 | 3.34 | 25 | 141 | - | - | - | - | - | - | 1.002 | 11.5 | * | - | - | - |
| W | 8,500 | 710 | 1.002 | 16.5 | 136 | ||||||||||||||
| BF | 7,650 | 700 | |||||||||||||||||
| IBE-3 | TF | 10,890 | 930 | 9,160 | 3.34 | 25 | 140 | 0.668 | 11.5 | 139 | - | - | - | - | - | - | 0.668 | 14 | * |
| W | 8,500 | 710 | 0.668 | 16.5 | 141 | ||||||||||||||
| BF | 7,650 | 700 | |||||||||||||||||
| IEU-3 | TF, W | 11,400 | 740 | - | - | - | - | - | - | - | 3.34 | 25 | * | 0.668 | 11.5 | 140 | 0.668 | 14 | 137 |
| BF | 10,380 | 760 | 0.668 | 16.5 | 139 | ||||||||||||||
*Gauge lost
† Concrete location for corresponding concrete strengths: TF = top flange, W = web, BF = bottom flange
Table 3.20. Torsion test results summary.
| Specimen | First Web Cracking | First Torsional Cracking | Failure | ||||
|---|---|---|---|---|---|---|---|
| Load, P (kip) | Torque (ft-kip) | Load, P (kip) | Torque (ft-kip) | Load, P (kip) | Torque (ft-kip) | Failure Mechanism | |
| IU-9 | 160 | 137 | 204 | 175 | 284 | 243 | Crushing in top flange near load point |
| IU-10* | 215 | 184 | 200 | 171 | 291 | 248 | Crushing and spalling in bottom flange |
| IU-11* | 170 | 145 | 200 | 171 | 291 | 248 | Crushing and spalling in bottom flange |
| IBU-7 | 100 | 85 | 160 | 137 | 288 | 246 | Crushing in top and bottom flange |
| IBE-3 | 160 | 137 | 200† | 171 | 294 | 251 | Full depth torsional cracking, crushing in top and bottom flange |
| IEU-3 | 100 | 85 | 220 | 188 | 320 | 274 | Full depth torsional cracking and spalling of concrete in the bottom flange |
* IU-10/11 is one beam, which consisted of Specimens IU-10 and IU-11.
† First torsional cracking is reported for the north test region as the south test region cross section was shifted due to the mispositioning of the foam void. First torsional cracking in south test region occurred at 103 ft-kip.
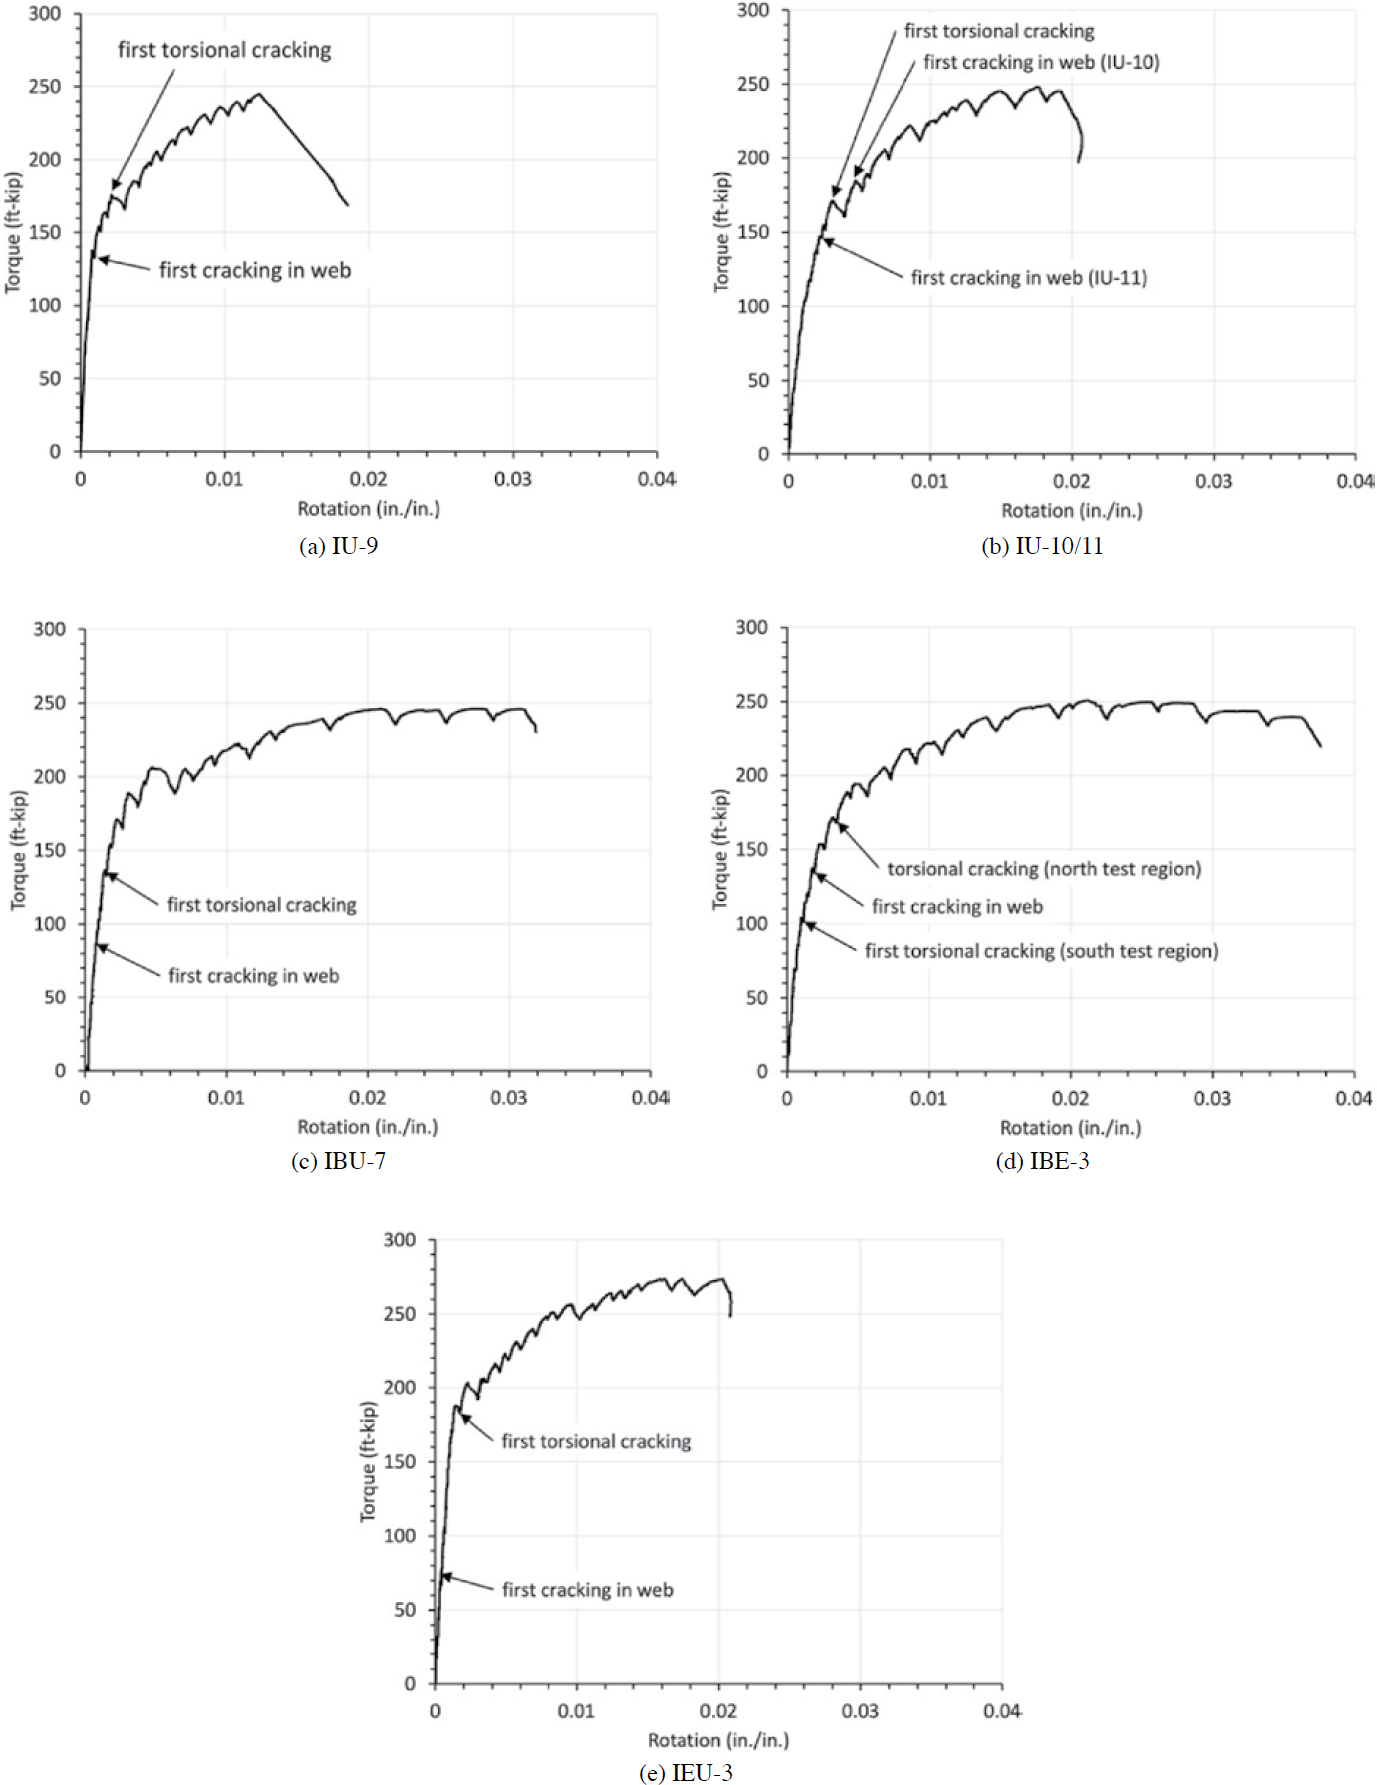
A typical instance of first cracking is shown in Figure 3.57. First cracking in the torsional specimens was typically observed in the webs at the level of the top web duct. These cracks were nearly identical to the first cracking observed for similar specimens tested in shear and were different from torsional cracks. The web cracks were typically slightly inclined and extended between the transverse reinforcement in each test region. Another instance of first torsional cracking is shown in Figure 3.58. Initiation of torsional cracking was considered when diagonal spiral cracks were observed on the specimen. Torsional cracking typically consisted of diagonal cracks which originated in the webs and spiraled across the top flange of each girder.
Failure was considered when the specimen experienced a sudden decrease in applied load and could no longer resist the applied torque. Failure of each specimen typically consisted of concrete crushing and spalling in one or both flanges. Torsional strength for all specimens was controlled

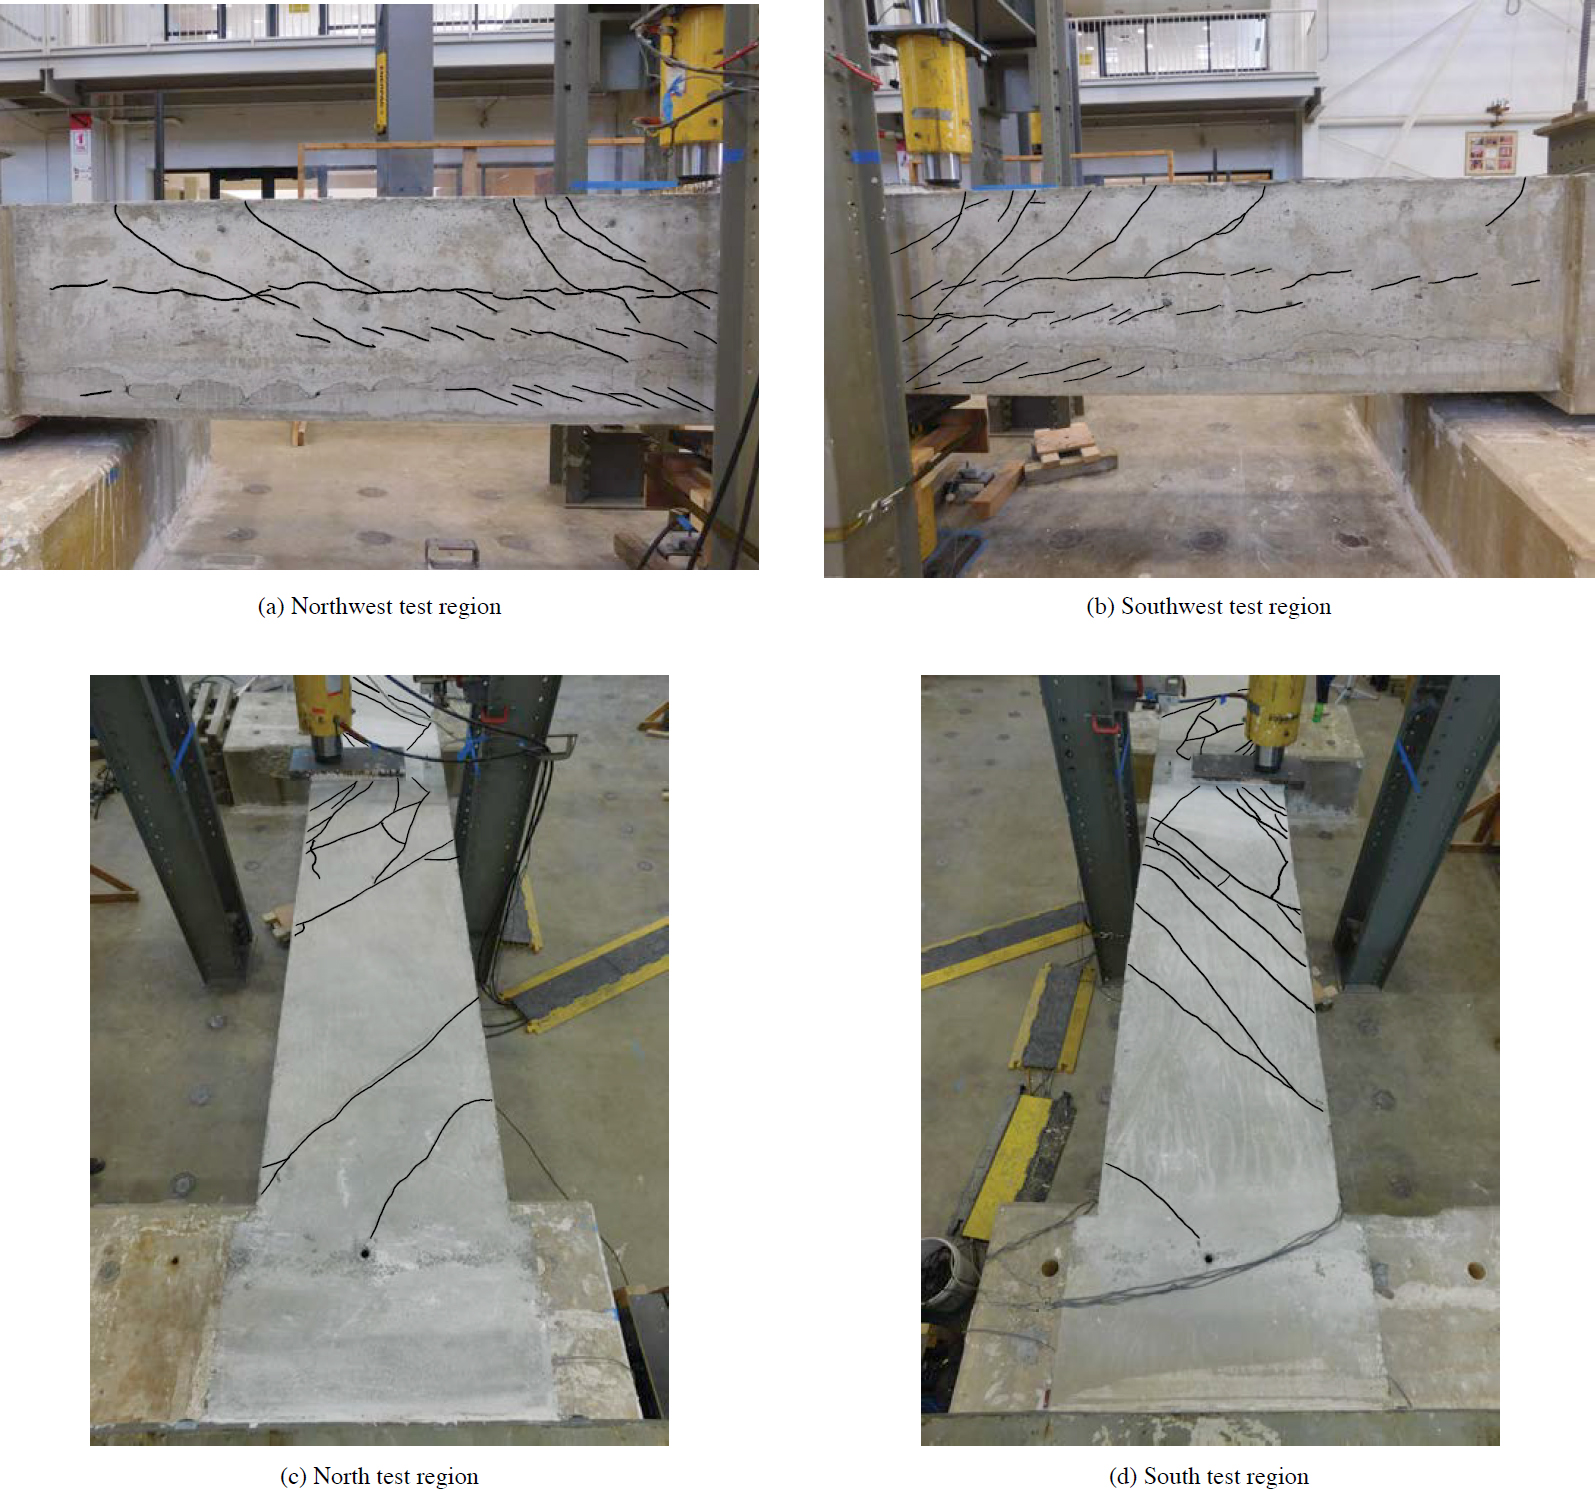
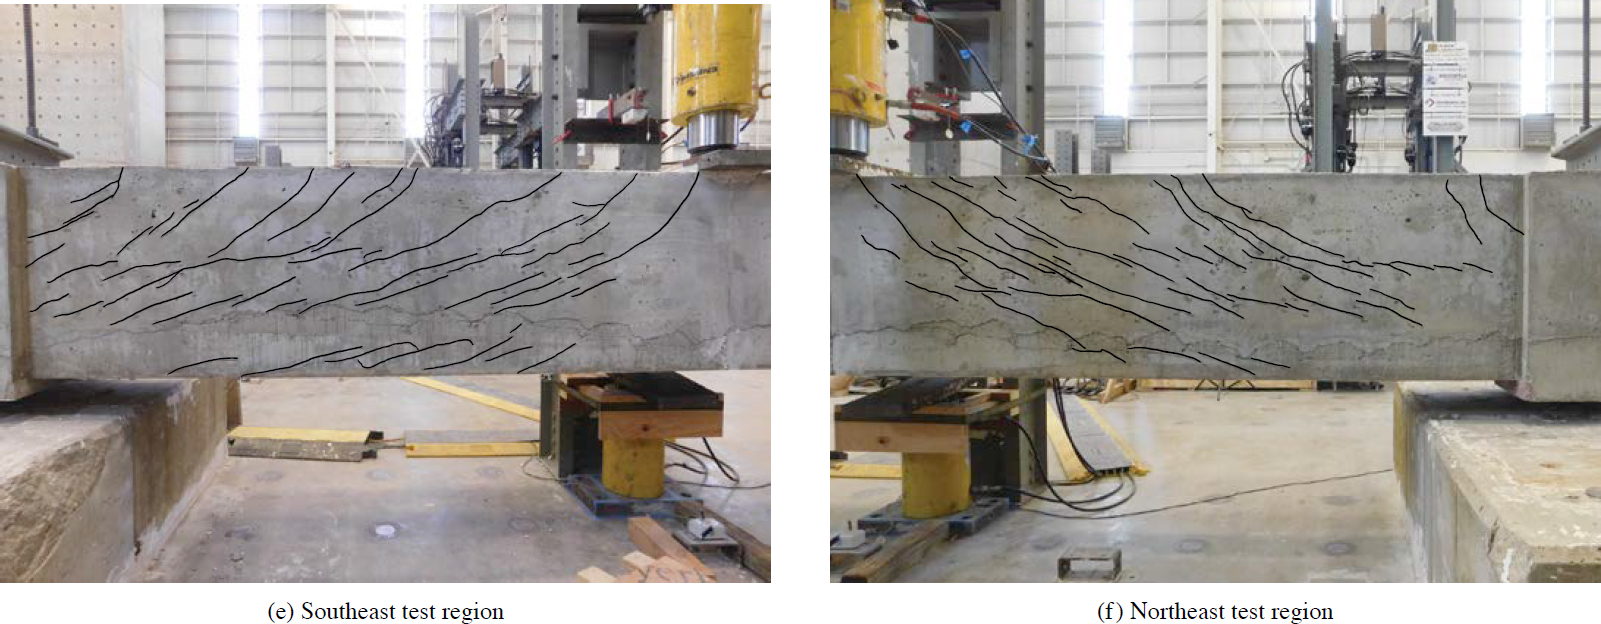
by concrete compression failure. In general, the transverse reinforcement did not develop its yield strength with strains measured in most stirrups significantly below yield. Data from strain gauges indicated that there was little to no stress increase in the prestressed strands during each test. Torsional cracks spanning the full depth of the member were present in each specimen after failure. Failure photos from each specimen are shown in Figures 3.59 through 3.63.
3.3.5.3.1 Specimen Behavior
Each of the torsion specimens had distinct behavior during testing. Therefore, the behavior of each specimen is discussed separately.
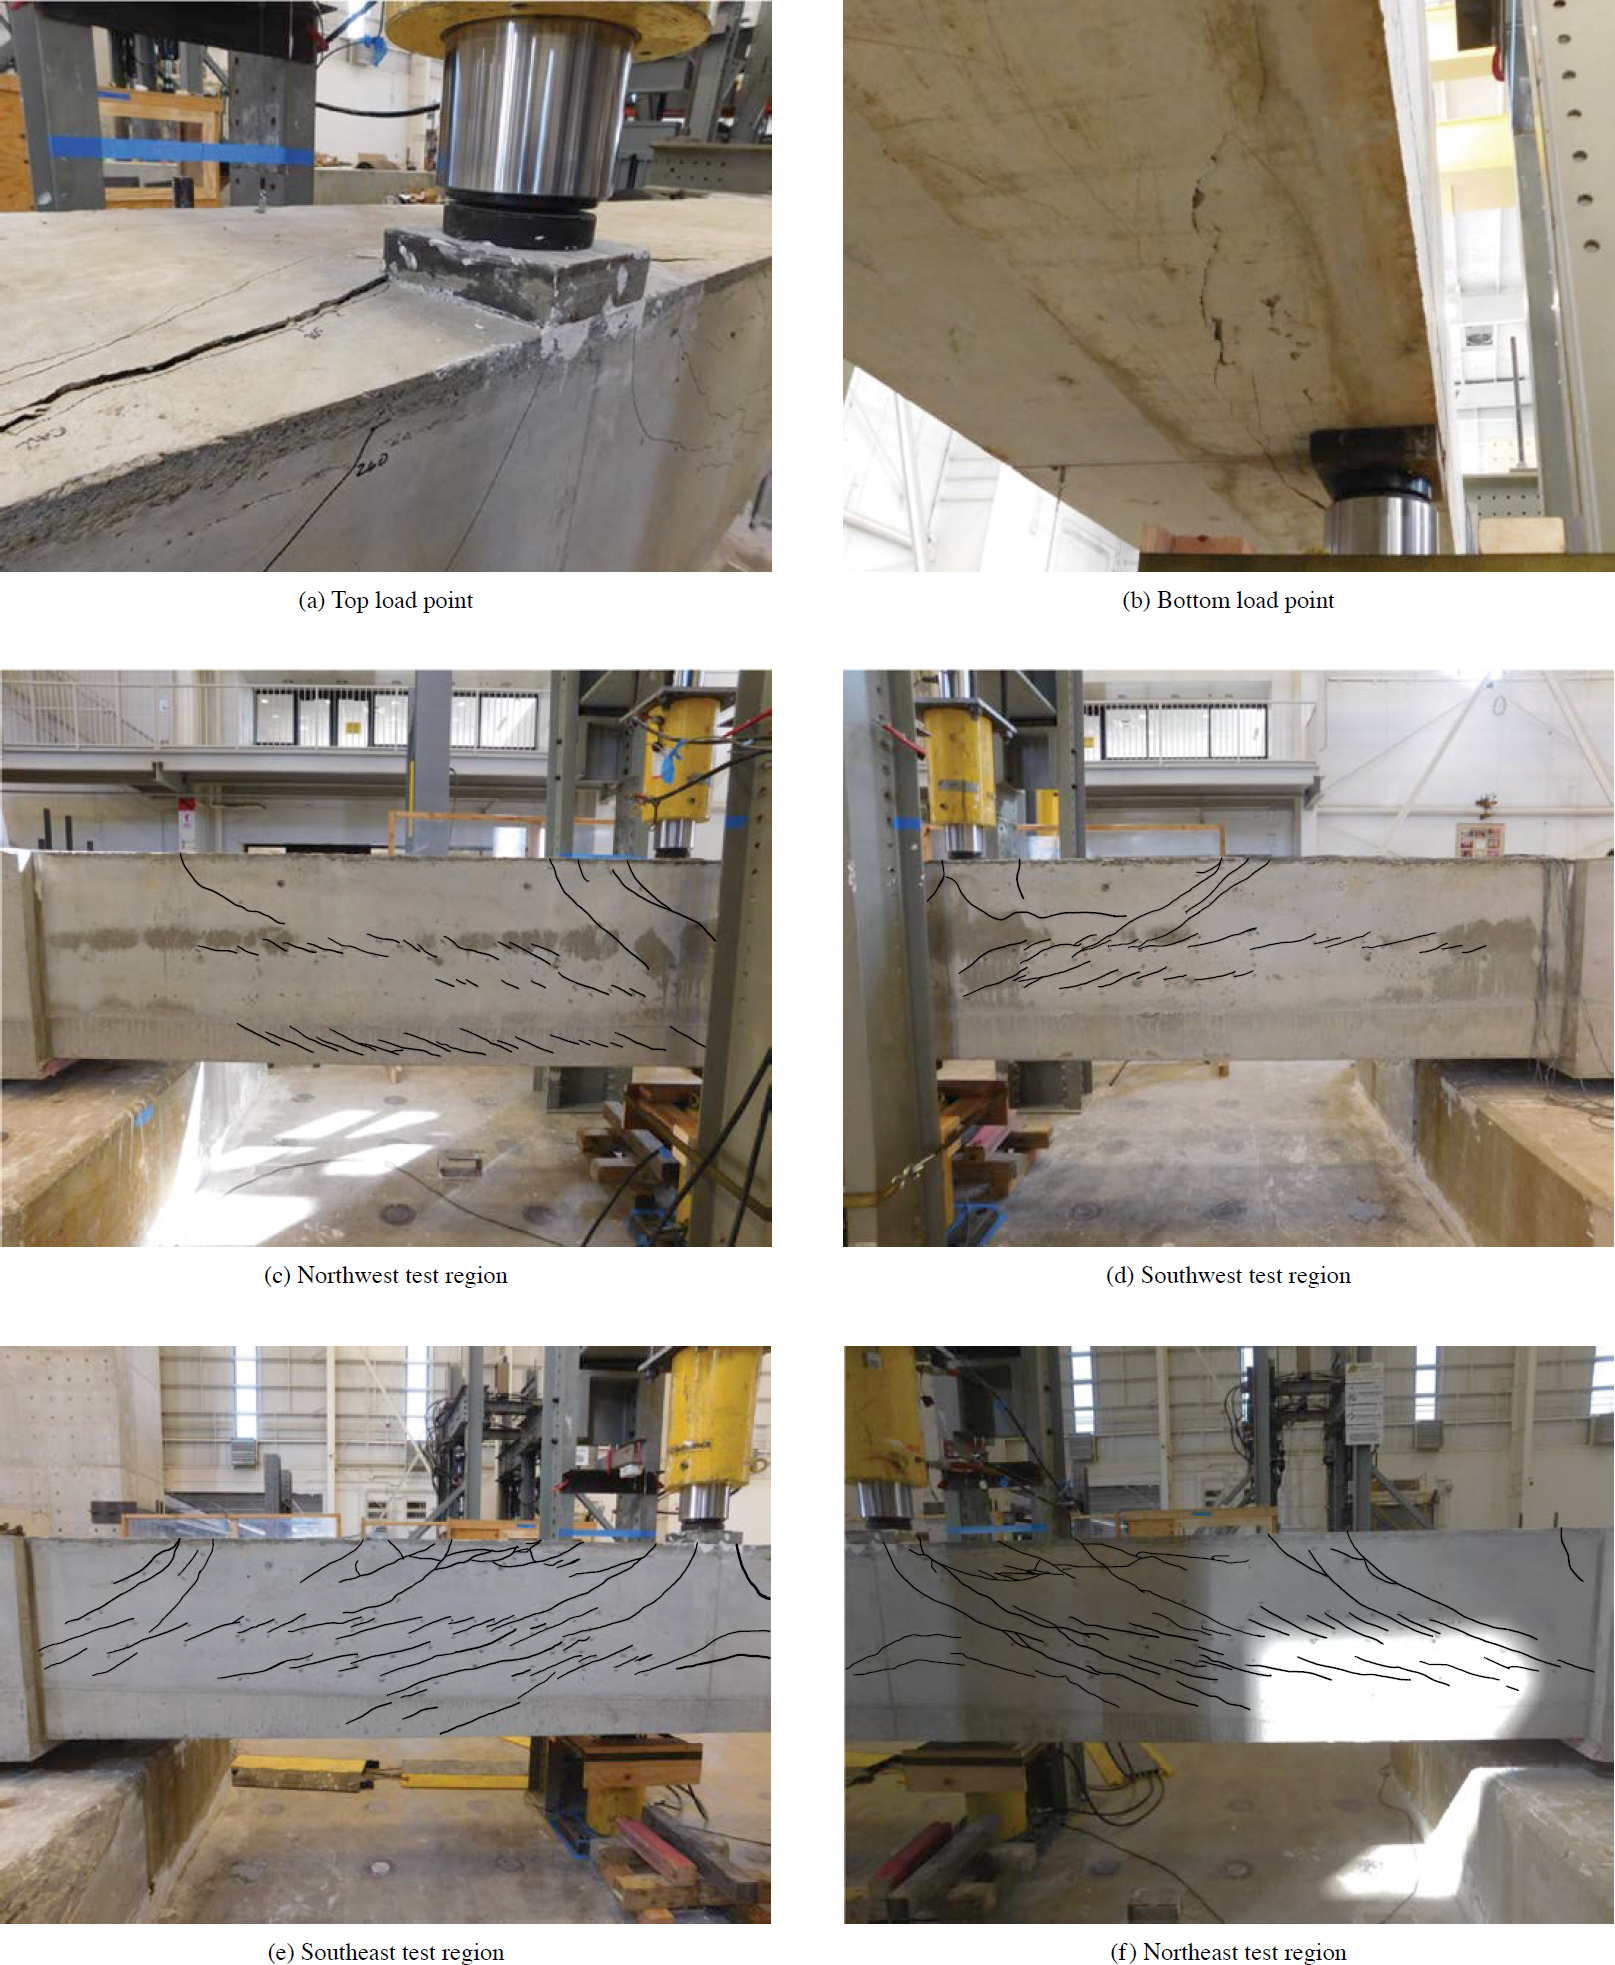
Specimen IU-9. Cracking at the location of the bottom web ducts occurred in the west test regions of IU-9 at a torque of 205 ft-kip. Failure of IU-9 occurred at a torque of 243 ft-kip. At failure, cracks at the location of the bottom flange ducts developed in all test regions, and crushing occurred in the top flange of the northeast test region. Additionally, the sections of the specimen under the top load point and above the bottom load point began to displace relative to the rest of the specimen at the torsional crack closest to each load plate, similar to a punching failure. The local displacement around the load plates is shown in Figure 3.59(a) and Figure 3.59(b). Because of this local displacement, larger load plates were used for the other tests. The larger load plates were successful in preventing the local displacement observed in this test. The ultimate failure load for IU-9, however, was not considered controlled by the loading plate as diagonal crushing of the top flange away from the loading plate occurred. IU-9 after failure is shown in Figure 3.59.
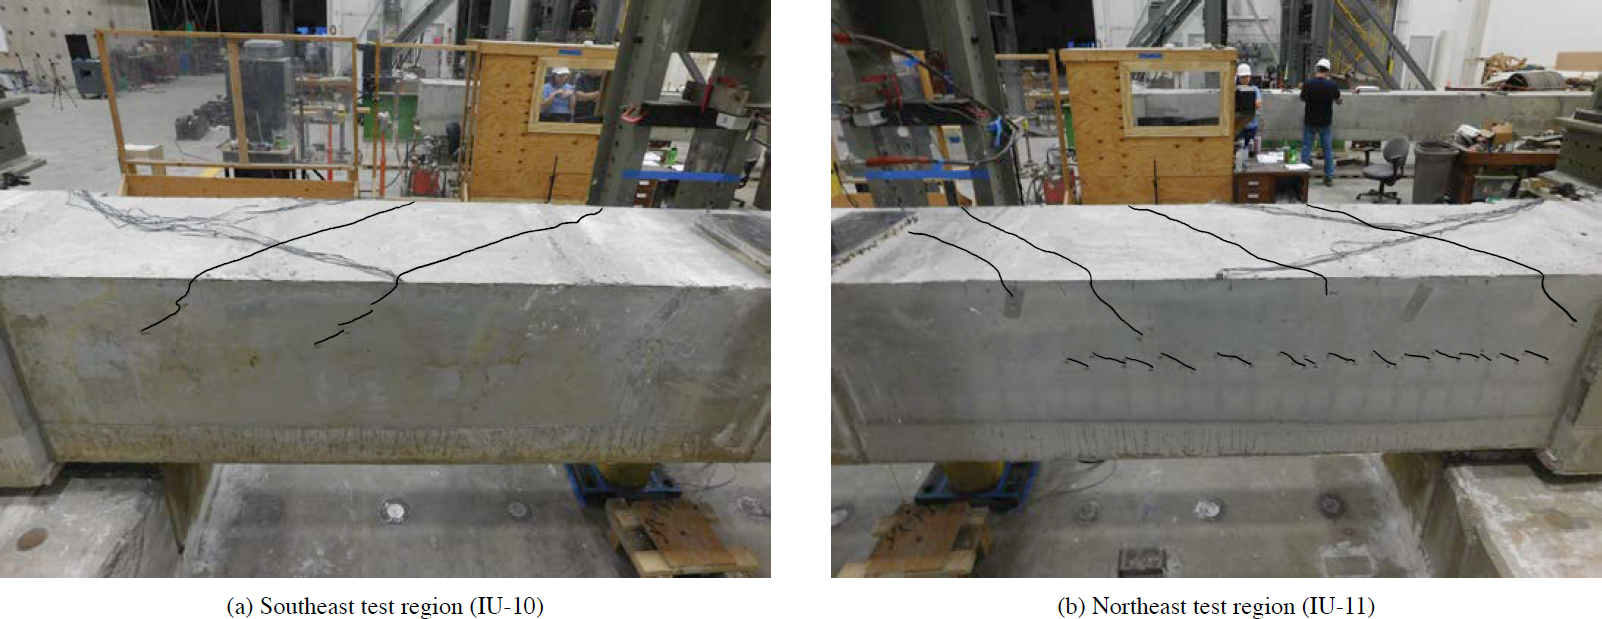
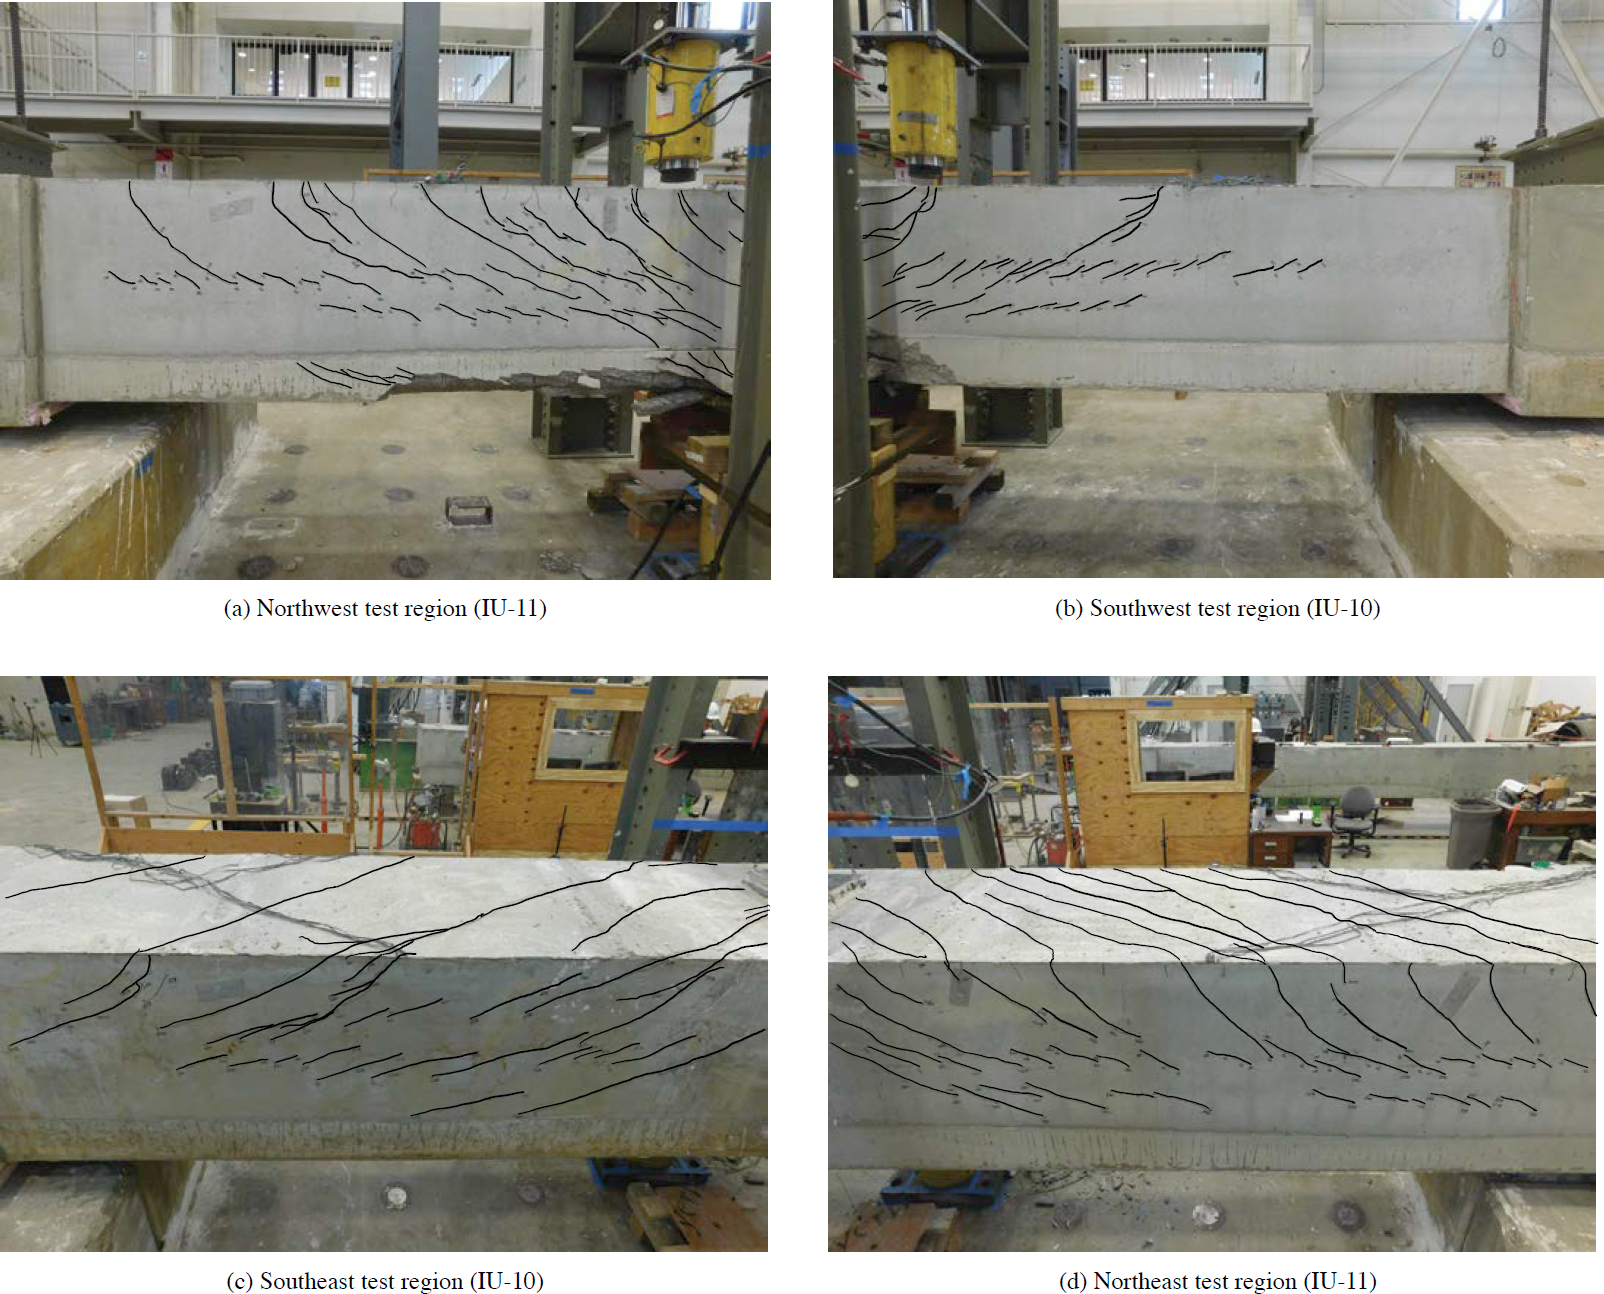
Specimen IU-10 and IU-11. At a torque of 220 ft-kip, web cracking was observed at the level of the bottom web ducts in all test regions of IU-10 and IU-11. At a torque of 239 ft-kip, cracks developed from the bottom load plate to the level of the bottom flange ducts in the west test regions. As load continued to be applied, existing cracks continued to expand, and new cracks developed in each test region. Failure of IU-10 and IU-11 occurred at a torque of 248 ft-kip when crushing was experienced in the bottom flange on the west side of each specimen. Additionally, the corner of the bottom flange spalled off on the west side of both specimens during failure. IU-11 developed significantly more torsional cracks than IU-10. Specimens IU-10 and IU-11 after failure are shown in Figure 3.60.
Specimen IBU-7. While IBU-7 experienced first torsional cracking in the north test region at a torque of 137 ft-kip, a torsional crack in the south test region did not develop until the specimen reached an applied torque of 188 ft-kip. At a torque of 205 ft-kip, web cracking was observed at the level of the bottom web ducts in all test regions. At a torque of 239 ft-kip, cracking occurred at the level of the bottom flange ducts in the east test regions. As load continued to be applied, existing cracks continued to expand, and new cracks developed in each test region. Failure of IBU-7 occurred at a torque of 246 ft-kip when the top flange of the northeast test region and bottom flange of the northwest test region experienced crushing and spalling. IBU-7 after failure is shown in Figure 3.61.
Specimen IBE-3. At a torque of 171 ft-kip, web cracking was observed at the level of the bottom web ducts in the southeast test region. At a torque of 248 ft-kip, cracking occurred at the level of the bottom flange ducts in the east test regions. Cracks at the location of the bottom flange ducts developed in all test regions prior to failure, and most of the cracks throughout the specimen had extended. Failure of IBE-3 occurred at a torque of 251 ft-kip. At failure, torsional cracks extended through the existing bottom flange cracks, spalling occurred in the top and bottom flanges at midspan, and a slight sliding occurred between the concrete lifts of the top and middle layers of the south test region. The south test region (with reduced top flange thickness due to the shifted cross section) developed more torsional cracks than the north test region. IBE-3 after failure is shown in Figure 3.62.
Specimen IEU-3. At a torque of 214 ft-kip, web cracking was observed at the level of the bottom web ducts in the east test regions of IEU-3. Cracks at the location of the bottom flange ducts developed in the northeast, southeast, and southwest test regions prior to failure, and most cracks throughout the specimen had extended. Failure of IEU-3 occurred at a torque of 274 ft-kip when torsional cracks extended the full depth of the specimen on the east test regions and spalling occurred in the bottom face of the southeast test region. The south test region of IEU-3 developed more torsional cracks than the north test region. IEU-3 after failure is shown in Figure 3.63.
3.3.5.3.2 Influence of Bond
Specimens containing bonded tendons (IBU-7 and IBE-3) experienced torsional cracking at a lower applied torque than comparison specimens containing all unbonded tendons (IU-9 and IEU-3). The specimens with bonded tendons developed a singular torsional crack upon
the initiation of torsional cracking. When torsional cracking occurred in the specimens with all unbonded tendons, multiple torsional cracks developed simultaneously across the test regions. Multiple initial torsional cracks were common in all fully unbonded specimens. It is important to note that shrinkage cracks developed in the top flange of both specimens containing bonded tendons. This cracking may have reduced the applied torque needed to cause torsional cracking in these specimens.
The presence of bonded tendons had no effect on the ultimate torsional capacity in the specimens containing fully internal post-tensioning. As shown in Table 3.20, the failure capacity was essentially identical for the specimen with bonded bottom flange tendons (IBU-7) and the specimen with all unbonded tendons (IU-9). When analyzing the specimens with some external post-tensioning, however, the specimen containing unbonded tendons (IEU-3) had an increased ultimate torsional capacity compared to the specimen containing bonded tendons (IBE-3).
While ultimate capacities were essentially identical for all of the specimens with the exception of IEU-3, the rotation capacity of specimens containing bonded tendons was greater than specimens containing only unbonded tendons. As shown in Figure 3.56, IBU-7 with bonded bottom flange tendons resisted rotations over twice that resisted by IU-9 with unbonded bottom flange tendons. IBE-3 with bonded bottom flange and web tendons also experienced greater rotations than IEU-3 with all unbonded tendons; however, the increase was only slightly greater.
3.3.5.3.3 Influence of Transverse Reinforcement Ratio
The transverse reinforcement spacing had little effect on the initiation of torsional cracking during testing as shown in Figure 3.64. Each specimen experienced torsional cracking at approximately the same applied torque. First torsional cracking resulted in multiple torsional cracks forming simultaneously across the top flange of each specimen. Closer transverse reinforcement spacing, however, resulted in more torsional cracks developing in each test region. Specimen IU-11 (4 in. spacing) developed additional cracks at the location of the bottom flange ducts and developed significantly more cracks at the level of both web ducts than Specimen IU-10 (16 in. spacing). The additional web cracks in Specimen IU-11 were also in closer proximity to the end support.
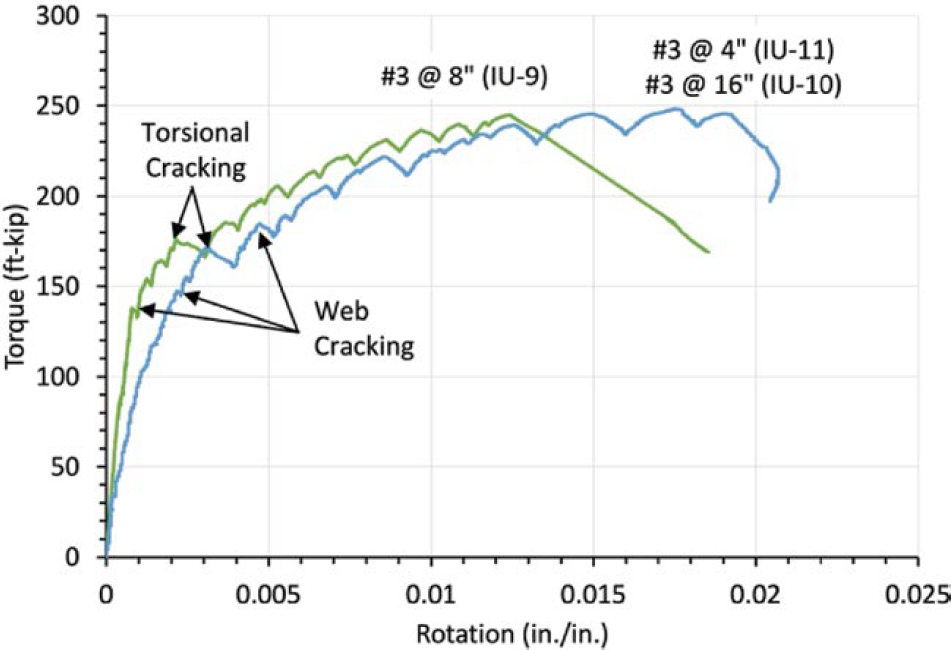
Prior to torsional cracking, the specimen containing a transverse reinforcing spacing of 8 in. (IU-9) had a higher torsional stiffness than the beam containing transverse reinforcement spacings of 4 in. (IU-11) and 16 in. (IU-10). Up to torsional cracking, the torsional stiffness and strength is provided by the gross concrete section; therefore, the difference in stiffness between the specimens is considered a result of the different concrete compressive strengths. After torsional cracking, the torsional strength is provided primarily by the transverse reinforcement. Specimen IU-9 had an average compressive strength of 10,800 psi while IU-10/11 had an average compressive strength of 8,230 psi. The average compressive strength reported is the average compressive strength of the concrete contained in the webs and top flange of the specimens. This difference in compressive strength and its impact on the modulus of elasticity likely resulted in the difference in initial stiffness.
The ultimate failure capacity for the specimens with varied transverse reinforcement spacing was nearly identical. Specimen IU-9 (8 in. spacing) failed by crushing in the top flange. The beam containing Specimen IU-11 (4 in. spacing) and Specimen IU-10 (16 in. spacing) experienced crushing in the bottom flange of both specimens. Ultimate capacity for the specimens was limited by concrete compression failure. Yielding of the stirrups did not occur.
3.3.5.4 Torsion Conclusions
The following are the conclusions from the experimental investigation for torsion:
- First observed cracking occurred at the level of the top post-tensioning duct in the webs, followed by torsional cracking in the top flange.
- At first torsional cracking, specimens with only unbonded strands developed multiple torsional cracks along the top flange in both test regions. Specimens with bonded strands in the bottom flange and bonded or unbonded strands in the web developed a singular torsional crack in the top flange of one test region.
- The bond type of the tendons did not have a significant influence on the behavior or ultimate torsional capacity of the specimens. Specimens with bonded tendons had slightly larger rotational capacities compared to specimens with only unbonded tendons.
- The transverse reinforcement ratio had little effect on the initiation of torsional cracking and did not impact the failure loads of the girders. However, the ultimate capacity of the specimens was limited by concrete compression failure, and yielding of the stirrups in the web did not occur.
3.4 Test Series 2
3.4.1 Specimen Design
Test Series 2 consisted of girder specimens of a larger scale compared to Test Series 1 with the objective of providing validation of the findings from Test Series 1 and the analytical investigation. Based on the results of Test Series 1, the primary variables to validate included grouted versus ungrouted tendons and the transverse reinforcement ratio. Typical cross section dimensions are provided in Figure 3.65 while the naming convention for the test specimens is provided in Figure 3.66. The girders were designed to facilitate testing on each end; therefore, each girder consisted of two specimens. Details of the cross sections for each of the specimens are provided in Figure 3.67 and Figure 3.68. The design drawings for each specimen are included in Appendix A.
The Test Series 2 specimens contained eight 0.6 in. bonded pretensioned strands in the bottom flange and three draped post-tensioned tendons in the web. Each of the tendons in the web contained five ½″ Special post-tensioning strands. Girder 1 contained test regions for CU-3-12 and CB-3-12 and was reinforced with No. 3 stirrups spaced at 12 in. The duct used for the post-tensioned
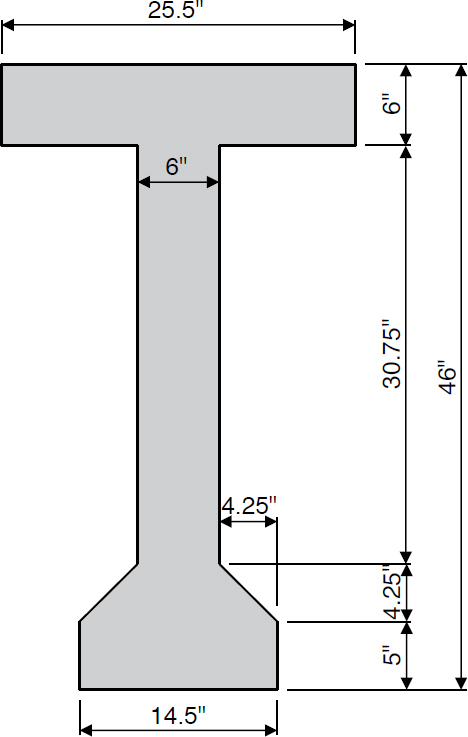
post-tensioned tendons in Girder 1 was corrugated high-density polyethylene (HDPE) duct with an outside diameter of 3.125 in. The tendons in the web of Girder 1 were ungrouted for CU-3-12 and were grouted following testing of CU-3-12 and before testing of CB-3-12. Girder 2 contained test regions for S-3-24 and S-4-24. Specimen S-3-24 was reinforced with No. 3 stirrups spaced at 24 in. and Specimen S-4-24 was reinforced with No. 4 stirrups spaced at 24 in. The duct used for the post-tensioned tendons in Girder 2 was smooth PVC pipe with an outside diameter of 2.875 in.
3.4.2 Test Setup and Instrumentation
3.4.2.1 Test Setup
The test setup for the Test Series 2 specimens is shown in Figure 3.69 and enabled two shear tests on each girder. The cantilever overhang during the first test became the test region for the second test. For the setup, a load cell was installed in-line with the hydraulic cylinder to measure the force applied to the specimen. A string potentiometer was also used to measure the displacement of the girder at the load point.

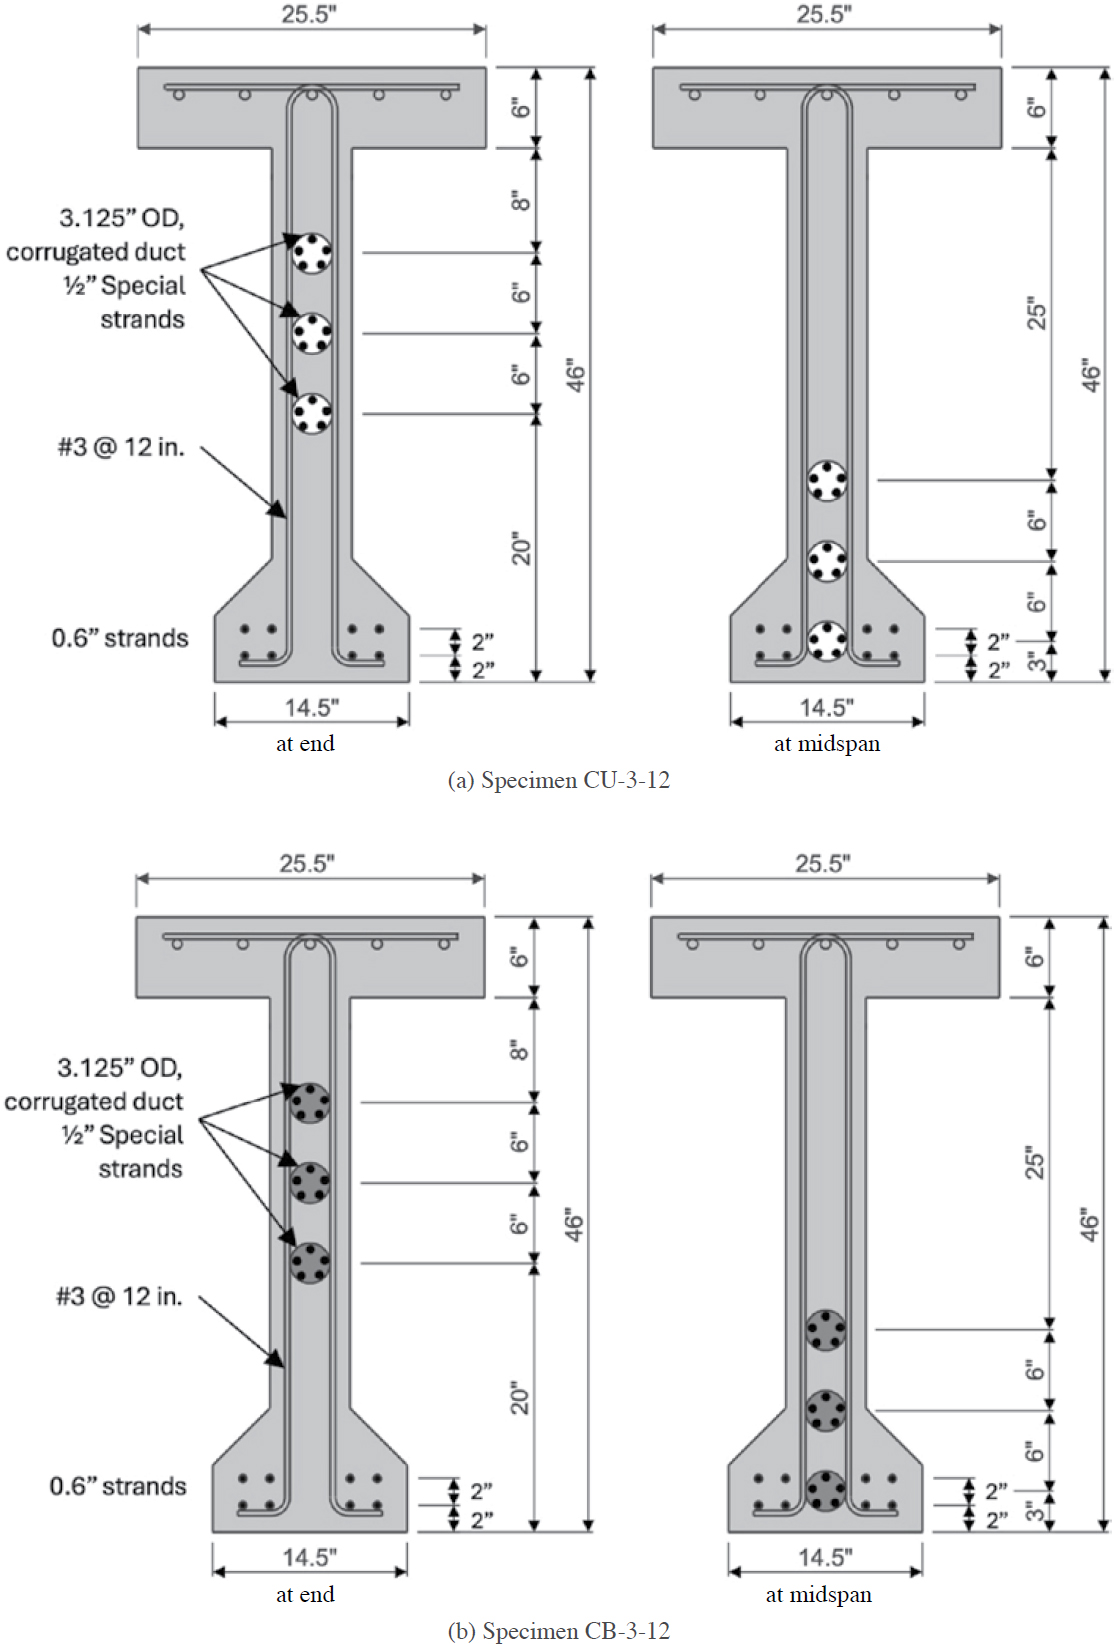
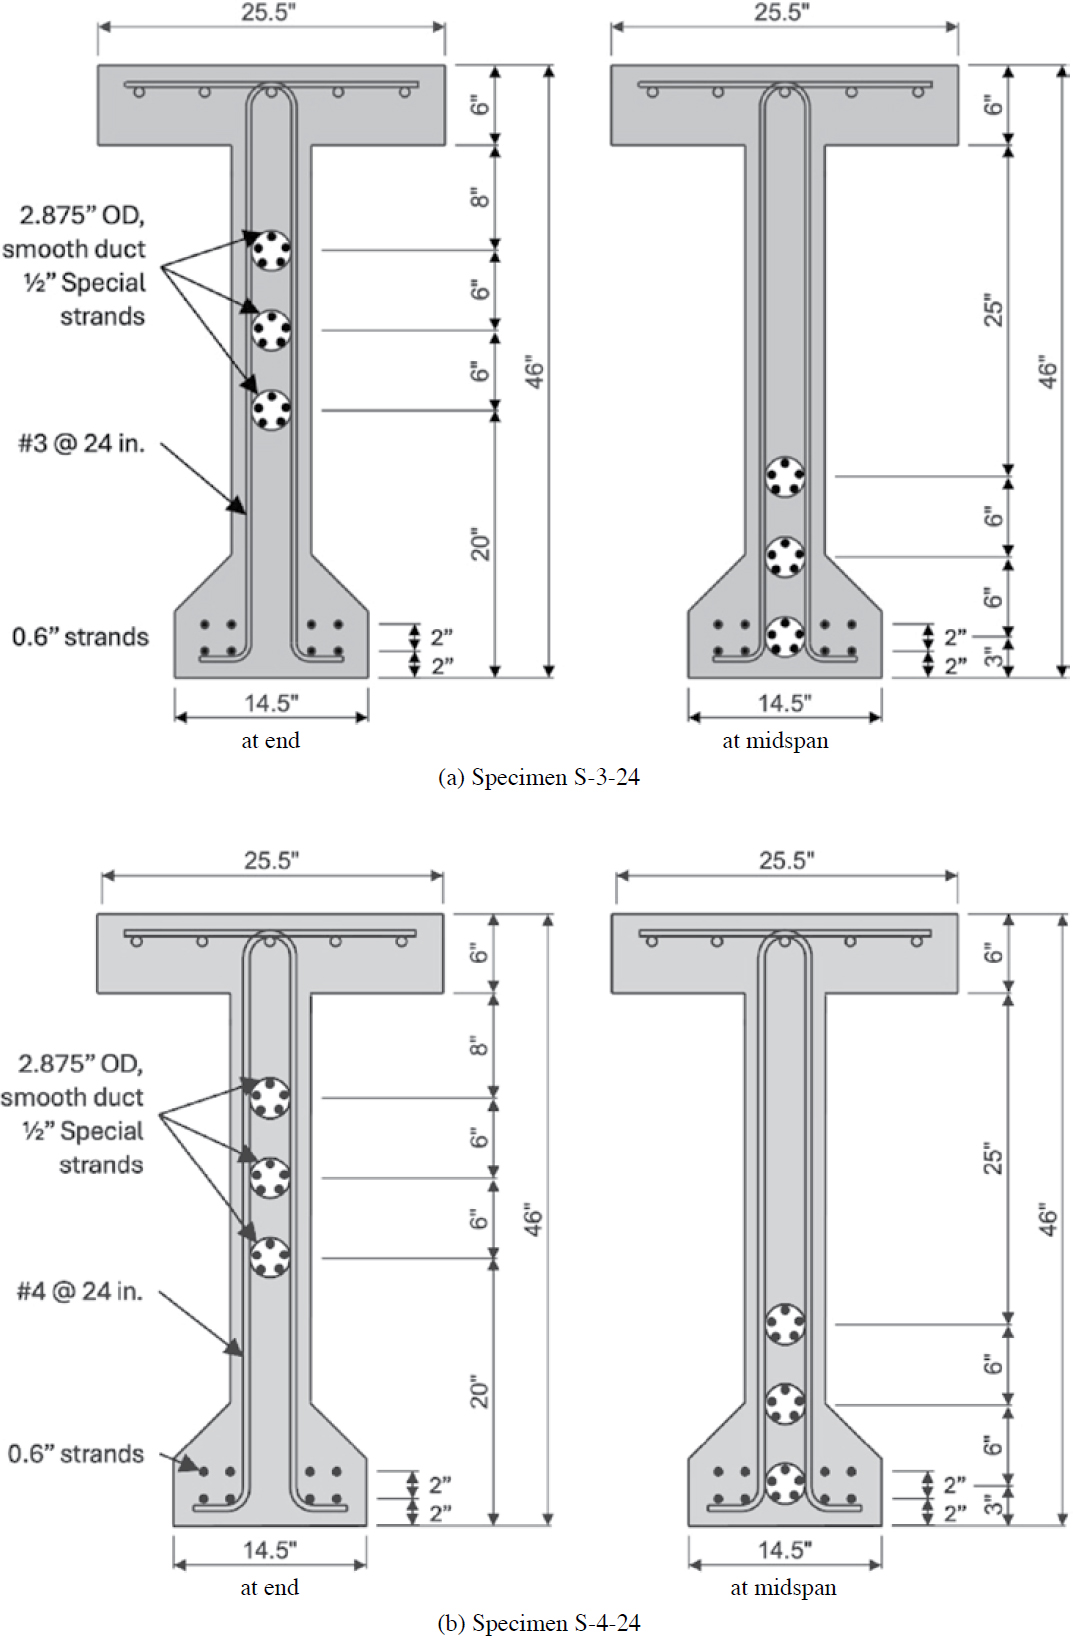
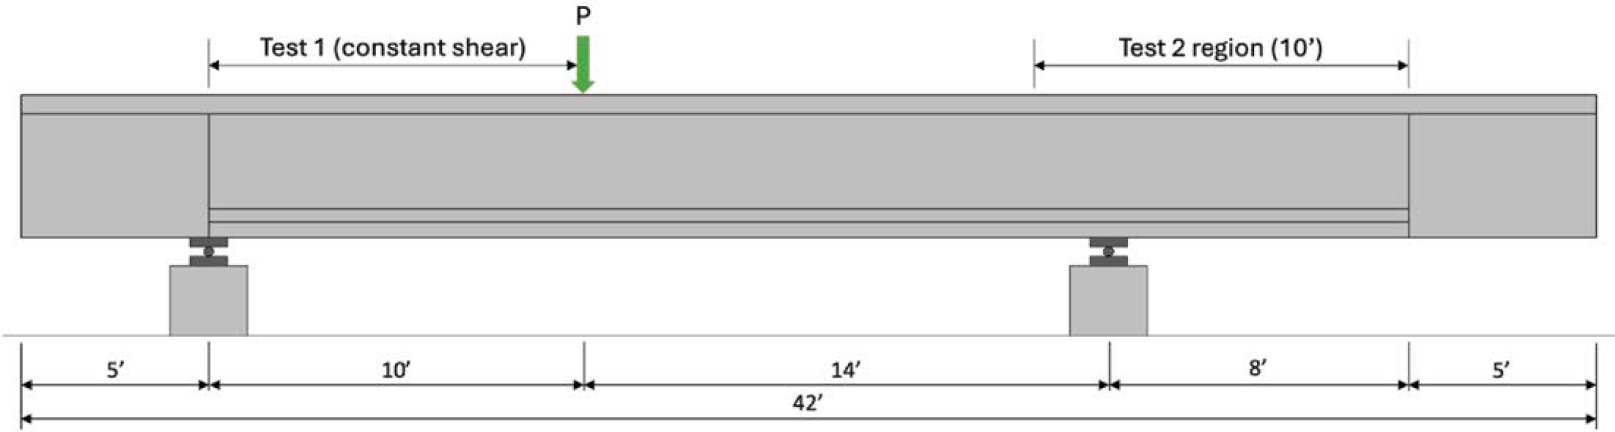
3.4.2.2 Instrumentation
The placement of strain gauges on prestressing strands and stirrups is shown in Figure 3.70 and Figure 3.71 for Girder 1 and Girder 2, respectively. The location of these gauges on both the pretensioned and post-tensioned strands corresponded with the load point for each of the tests. Strain gauges were also installed on stirrups located in each of the test regions.
3.4.3 Results
A summary of the details for the Test Series 2 specimens, including the concrete and grout strengths (fc, ft) and effective stresses (fpe) of the prestressed strands, is included in Table 3.21. A summary of the applied shears corresponding to first shear cracking, first flexural cracking, and ultimate capacity for each specimen is provided in Table 3.22.


Table 3.21. Summary of Test Series 2 specimen details.
| Specimen | fc (psi) | ft (psi) | Grout fc (psi) | Pretensioned Strands | Internal Bonded PT, Web | Internal Unbonded PT, Bottom Flange | ||||||
|---|---|---|---|---|---|---|---|---|---|---|---|---|
| Aps(in.2) | dps(in.) | fpe(ksi) | Aps(in.2) | dps†(in.) | fpe(ksi) | Aps(in.2) | dps†(in.) | fpe(ksi) | ||||
| CB-3-12 | 11,030 | 840 | 6,291 | 1.736 | 43 | 138 | 0.835 | 31 | 142 | - | - | - |
| 0.835 | 37 | 144 | ||||||||||
| 0.835 | 43 | * | ||||||||||
| CU-3-12 | 10,980 | 740 | - | 1.736 | 43 | 138 | - | - | - | 0.835 | 31 | 151 |
| 0.835 | 37 | 149 | ||||||||||
| 0.835 | 43 | * | ||||||||||
| S-3-24 | 11,670 | 750 | - | 1.736 | 43 | 132 | - | - | - | 0.835 | 31 | 149 |
| 0.835 | 37 | * | ||||||||||
| 0.835 | 43 | * | ||||||||||
| S-4-24 | 11,670 | 750 | - | 1.736 | 43 | 132 | - | - | - | 0.835 | 31 | 145 |
| 0.835 | 37 | * | ||||||||||
| 0.835 | 43 | * | ||||||||||
* Gauge lost
† Distance from top of beam to centroid of tendon at midspan
PT = Post-tensioned
Load was applied monotonically to the girders in 20-kip increments up to failure. At each load step, the specimens were examined for the development and propagation of cracking. The resulting load-displacement responses are presented in Figure 3.72.
Overall, the behavior of the specimens in Test Series 2 was similar to that of the specimens in Test Series 1. For Test Series 2, the first cracking observed was hairline cracks at the level of one or more ducts located in the web as shown in Figure 3.73. As load increased, additional hairline cracks were observed along the levels of all three ducts located in the web. Flexural cracks developed near the load point during each test (Figure 3.74), but the specimens failed before the flexural cracks could propagate into the web. Near failure, each of the specimens developed full depth shear cracks. The development of full web depth shear cracks corresponded with a drop in the applied load. Additional load was able to be applied after three to five full depth shear cracks developed, but eventually, a dominant full depth shear crack caused the specimen to fail and prevented additional load from being applied. Near the failure load for each test, crushing of concrete at the level of the ducts was observed, indicating that the specimens were beginning to fail. The dominant full depth shear cracks are shown with red lines while regions of crushing are shown with shaded regions in Figure 3.75 and 3.76.
The dominant shear crack for each test was located in the test region near the load point, except for Specimen S-4-24. For S-4-24, the dominant shear crack was observed in the back span. Figure 3.76 shows the crack pattern in the backspan at failure with the cracks present at the beginning of the test shown in blue. The half of the backspan of S-4-24, near the backspan support, contained No. 3 stirrups spaced at 24 in. (stirrup detail for Specimen S-3-24). While the applied shear to the

backspan was lower, failure occurred in the backspan instead of the test region at an applied shear of 137 kips (applied shear in the test region was 192 kips). The applied shear force in the backspan of Specimen S-4-24 (137 kips) was less than the applied shear force at failure in the test region for Specimen S-3-24 (222 kips). The difference in applied shear force can be explained by several factors. First, the presence of damage in the backspan of Specimen S-4-24 after testing Specimen S-3-24 potentially caused the strength of the backspan of S-4-24 to be reduced. Second, due to the shorter shear span to depth ratio (a/h) of the test region of S-3-24 (a/h = 2.6) as compared to the backspan (a/h = 3.7), the presence of arching action in the shorter shear span may have provided an enhancement in shear strength. In this regard, the shear strength of Specimen S-3-24 was greater than expected. Following significant shear cracking at a shear of 178 kips, which was accompanied by wide shear cracks, the specimen was capable of resisting increased loads, which supports the explanation that arching action likely enhanced the ultimate shear capacity of S-3-24.
The results of the Test Series 2 support the general findings of Test Series 1. The specimen with grouted web tendons did not result in a significant increase in shear strength compared to the specimen with ungrouted web tendons. The Test Series 2 specimens also supported Test Series 1 findings regarding the influence of transverse reinforcement. A higher transverse reinforcement ratio resulted in an increase in the shear capacity.
3.4.4 Test Series 2 Conclusions
The following are the conclusions from the Test Series 2 experimental investigation:
- The behavior observed during Test Series 2 was consistent with the observed behavior from shear tests included in Test Series 1.
- As the transverse reinforcement ratio increased, the shear capacity of the girders increased.
- The specimen with bonded web tendons had approximately 10% greater shear capacity than the specimen with unbonded tendons, but the first observed shear cracking in the web of the test region occurred at the same applied shear force.