Practices for Operational Traffic Simulation Models (2025)
Chapter: 3 Survey Results
CHAPTER 3
Survey Results
A survey was developed and administered to gain greater understanding of the state of the practice for the use of operational traffic simulation models in the United States. The survey, which included 25 questions, was reviewed by the topic panel before being sent to each DOT via Qualtrics Survey Software (Qualtrics 2024). The survey was sent to one respondent from each DOT. The contact list for the survey was primarily developed based on the membership list of the AASHTO Committee on Traffic Engineering, and an effort was made to identify the appropriate person to complete the survey at each DOT. In addition, respondents were encouraged to collaborate with others at their DOTs and to forward the survey to the staff who would be most capable of answering the questions and that could provide the most accurate information. Responses were received from 48 state DOTs and the District of Columbia DOT for a response rate of 96%. A map showing the states that responded to the survey is provided in Figure 25.
Topics covered by the survey as related to operational traffic simulation modeling include extent of use, staffing, applications, modeling resolution, software, data sources, use of guidance documents and other resources, modeling practices, MOEs, and deliverables. Several of the multiple-choice questions included a text entry field to allow respondents to provide additional information. A copy of the full survey can be found in Appendix A. A list of responding DOTs and survey responses, including text responses and resources submitted, is provided in Appendix B.
The following sections describe the survey results; this chapter is organized as shown in Table 3. The survey results are compiled from the responses and reflect the respondents’ interpretation of the questions.
Survey Results for Extent of Use of Traffic Simulation Models
In the first question of the survey, DOTs were asked if they use operational traffic simulation models. All 49 responding DOTs indicated that they use operational traffic simulation models.
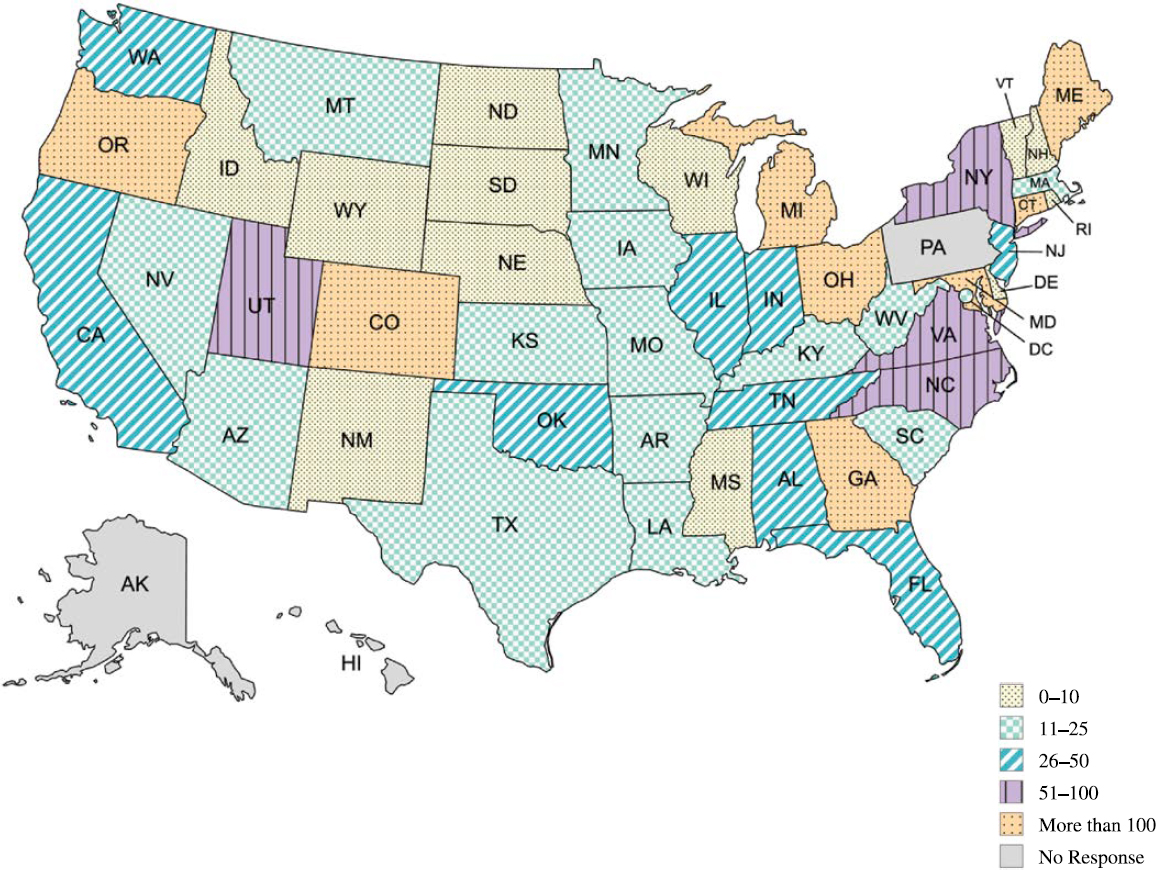
Question 2 of the survey sought information regarding the number of projects for which each DOT uses operational traffic simulation models each year. The results indicate that 27 responding DOTs apply operational simulation models for 25 or fewer projects annually. Eight DOTs use operational traffic simulation models for more than 100 projects each year. A map showing responses by state DOT is shown in Figure 26. The map illustrates that the use of operational traffic simulation models varies throughout the United States.
Question 3 of the survey asked state DOTs about the percentage of projects for which they use operational traffic simulation models. The average value of the 48 responses received is 31.9%, with a standard deviation of 27.7%.
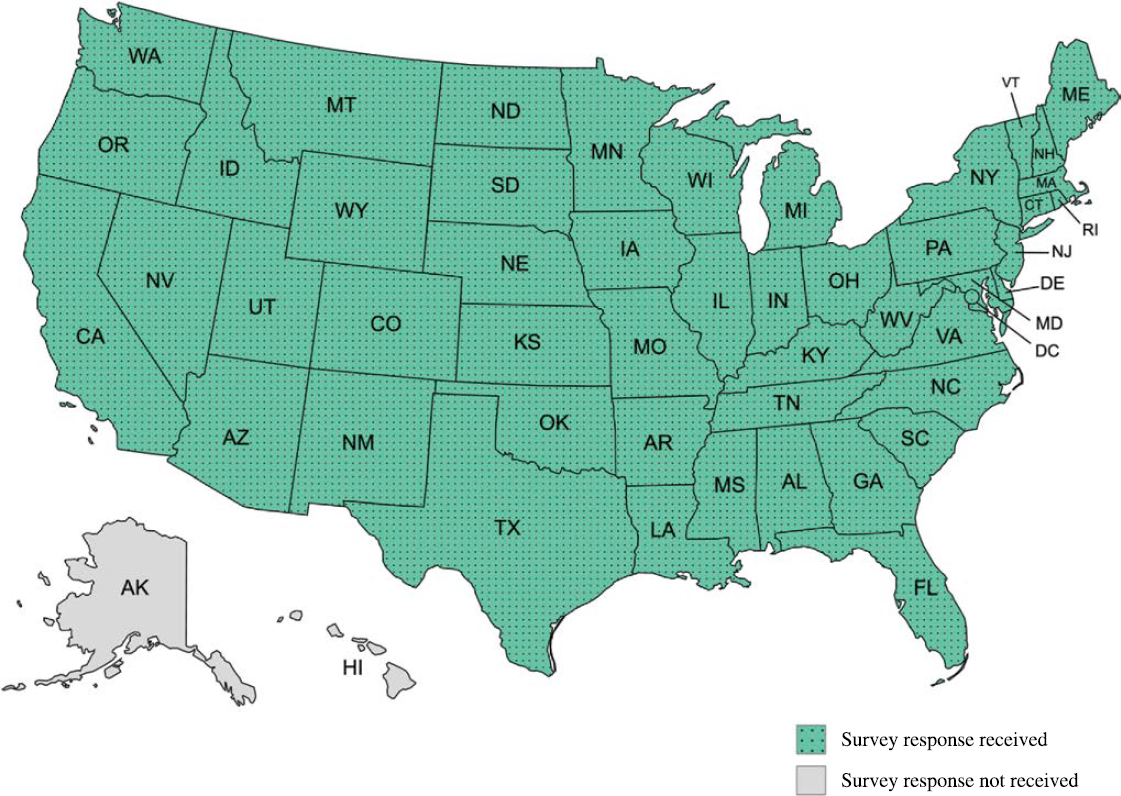
Figure 25. Map showing DOTs that responded to the survey.
Table 3. Sections in the survey results chapter.
| Section | Survey Questions |
|---|---|
| Extent of Use of Traffic Simulation Models | 1–3 |
| Applications for Traffic Simulation Models | 5–7 |
| Guidance and Other Resources for Traffic Simulation Models | 12, 13, 21 |
| Modeling Practices for Traffic Simulation | 4, 8, 10, 14, 18 |
| Software and Data for Traffic Simulation Models | 9, 11, 19 |
| Review and Documentation of Traffic Simulation Models | 15, 16, 17, 20 |
| Other Practices for Traffic Simulation Models | 22, 23 |
| Participation in Case Example | 24 |
| Summary of Key Survey Findings by Topic | All |
| Summary of Key Survey Findings by DOT | All |
Total number of responses = 48
Source: Created with MapChart
Figure 26. Map showing use of operational traffic simulation models (number of projects per year) by state DOT.
Survey Results for Applications for Traffic Simulation Models
Questions 5 through 7 of the survey concerned applications for operational traffic simulation models. The results for Question 5, shown in Table 4, indicate that at least 35 responding DOTs use operational traffic simulation models to some extent for signal retiming analyses, freeway design alternatives analyses, arterial design alternatives analyses, traffic impact analyses (TIAs), and design visualization and communication. The fewest responses were recorded for evacuation route analyses (seven responding DOTs). Examples of other applications mentioned in the text responses include evaluating mobility impacts for intersection alternatives, incident route analyses, and traffic forecasting for holidays and major events. Safety analysis was not mentioned in the text responses.
As a follow-up question, DOT representatives were asked about their frequency of use of operational traffic simulation models for different applications; the results are presented in Table 5. These responses indicate that DOTs use operational traffic simulation models most often
Table 4. Applications for operational traffic simulation models (Question 5).
| Application | Count |
|---|---|
| Signal retiming analyses | 40 |
| Freeway design alternatives analyses | 38 |
| Arterial design alternative analyses | 37 |
| Traffic impact analyses | 37 |
| Design visualization and communication | 36 |
| Mixed design alternative analyses | 32 |
| Work zone analyses | 25 |
| ITS* implementation alternative analyses | 14 |
| Evacuation route analyses | 7 |
| Other | 5 |
| Total Number of Respondents | 49 |
* ITS = Intelligent Transportation Systems
Note: Respondents could select multiple answers.
Sort order = Count (high to low)
for freeway design alternative analyses, mixed design alternative analyses, and signal retiming analyses and least often for design visualization and communication, work zone analyses, and evacuation route analyses.
Question 7 asked about the use of specialized applications for operational traffic simulation models, and the results are presented in Table 6. The results show that the specialized application used by the highest number of DOTs is signal optimization (38 responding DOTs); the specialized application used by the lowest number of DOTs is for CAV analyses (three responding DOTs). Thirteen DOTs indicated the use of hybrid/MRM. Other applications mentioned in the text responses include validation of existing and future scenario networks, alternatives analyses, and tolling analyses.
Table 5. Frequency of use of applications for operational traffic simulation models (Question 6).
| Application | Rarely | Sometimes | Usually | Always | Total | Average* |
|---|---|---|---|---|---|---|
| Freeway design alternatives analyses | 2 | 8 | 14 | 14 | 38 | 3.05 |
| Mixed design alternative analyses | 2 | 10 | 10 | 10 | 32 | 2.88 |
| Signal retiming analyses | 6 | 9 | 10 | 15 | 40 | 2.85 |
| Arterial design alternative analyses | 4 | 10 | 15 | 8 | 37 | 2.73 |
| ITS implementation alternative analyses | 1 | 6 | 3 | 4 | 14 | 2.71 |
| Traffic impact analyses | 5 | 9 | 16 | 7 | 37 | 2.68 |
| Other | 0 | 3 | 1 | 1 | 5 | 2.60 |
| Evacuation route analyses | 1 | 4 | 1 | 1 | 7 | 2.29 |
| Work zone analyses | 4 | 11 | 9 | 1 | 25 | 2.28 |
| Design visualization and communication | 6 | 19 | 9 | 2 | 36 | 2.19 |
* Calculated based on these values: 1 = Rarely, 2 = Sometimes, 3 = Usually, 4 = Always
Note: Sort order = Average (high to low)
Table 6. Use of specialized applications for operational traffic simulation models (Question 7).
| Application | Count |
|---|---|
| Signal optimization | 38 |
| Dynamic traffic assignment | 19 |
| TSMO operational analysis (e.g., managed lanes, variable speed limits) | 17 |
| Hybrid/multiresolution modeling | 13 |
| Reliability analyses | 11 |
| Connected/automated vehicle analyses | 3 |
| Other | 3 |
| Total Number of Respondents | 46 |
Note: Respondents could select multiple answers.
Sort order = Count (high to low)
Survey Results for Guidance and Other Resources for Traffic Simulation Models
Three questions (12, 13, and 21) were related to guidance and other resources for operational traffic simulation models. Question 12 of the survey asked DOTs which guidelines they most frequently use to calibrate operational traffic simulation models; the results are shown in Table 7. These results indicate that responding DOTs most often use state-specific guidance (19 responding DOTs), followed by ad hoc project-based decisions (15 responding DOTs). Six responding DOTs primarily use the 2004 version of the TAT (Dowling et al. 2004) and four responding DOTs primarily use the 2019 version of the TAT (Wunderlich et al. 2019). One DOT is in the process of converting from the 2004 version of the TAT to the 2019 version. A map showing the results for this question is provided in Figure 27.
The results for Question 13, presented in Figure 28, show that 20 responding DOTs have a process for documenting deviations from modeling guidance on specific projects; such a process is not used or applicable for 29 responding DOTs.
Question 21 sought information regarding resources developed by state DOTs for operational traffic simulation models; the results are provided in Table 8. Responding DOTs have most often developed guidance documents, followed by suggested calibration parameters and then by procedures for model development and review. Only three responding DOTs have developed procedures for maintenance and archiving of data or have performed studies on the benefits of—or return on investment for—the use of operational traffic simulation models. Five responding DOTs (those of Missouri, Nevada, New Hampshire, New Mexico, and Oklahoma)
Table 7. Guidelines used to calibrate simulation models (Question 12).
| Guidelines | Count |
|---|---|
| Traffic Analysis Toolbox Volume III: Guidelines for Applying Traffic Microsimulation Software | 6 |
| TAT Volume III: Guidelines for Applying Traffic Microsimulation Modeling Software 2019 Update to the 2004 Version | 4 |
| State-specific guidance | 19 |
| Ad hoc project-based decisions as there is no state-specific guidance | 15 |
| Other | 5 |
| Total | 49 |
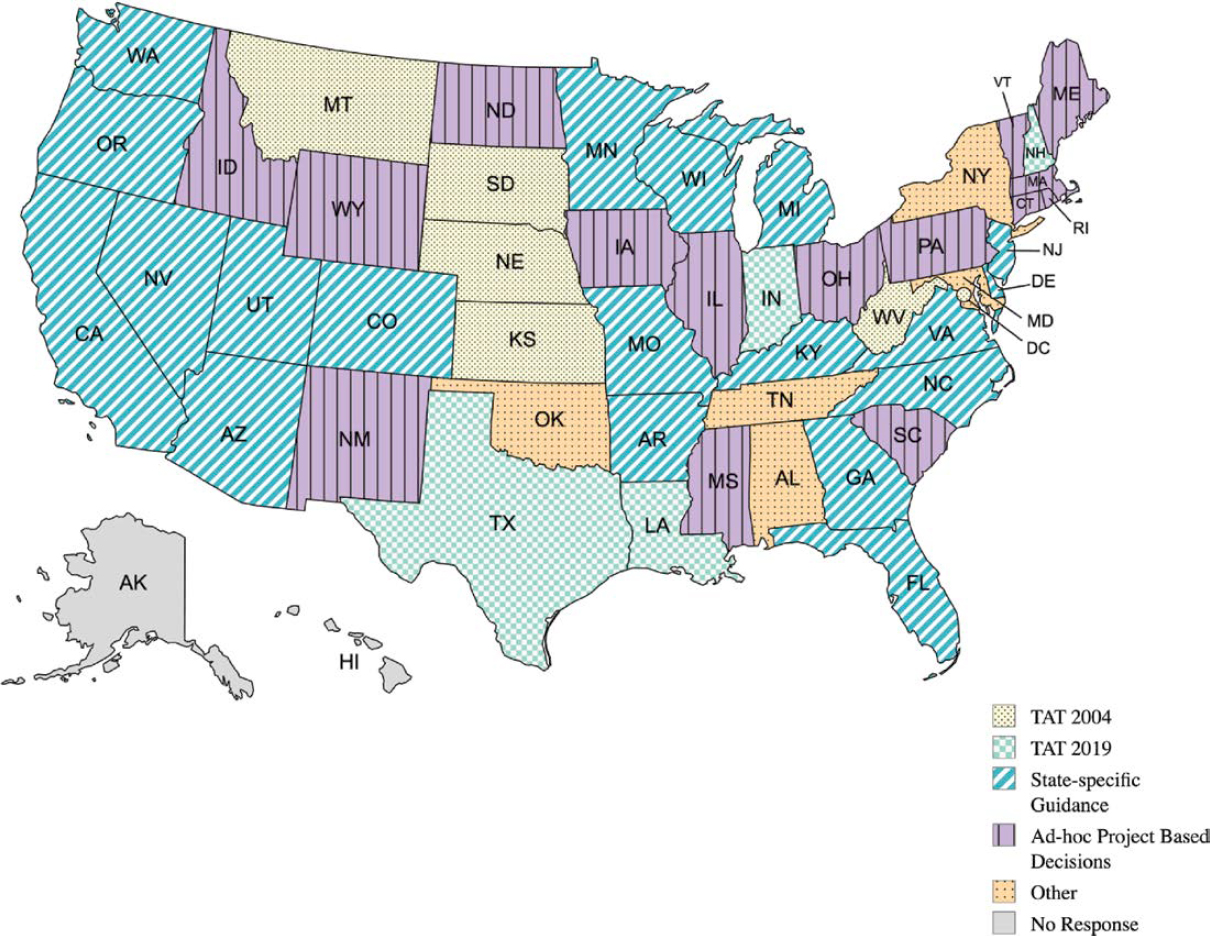
Figure 27. Map showing use of guidance by DOT.
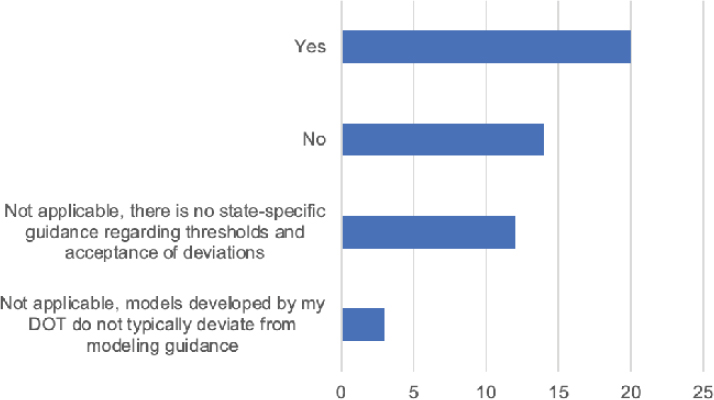
Figure 28. Process for documenting deviations from modeling guidance on specific projects (Question 13).
Table 8. Survey results for resources developed for operational traffic simulation models (Question 21).
| Resource | Count |
|---|---|
| Guidance documents | 26 |
| Suggested calibration parameters | 19 |
| Procedures for model development and review | 18 |
| Thresholds for calibration acceptance | 15 |
| Checklists | 14 |
| Procedures for model scoping | 13 |
| Training materials | 11 |
| Policies | 10 |
| My DOT primarily uses resources from FHWA | 10 |
| Standards | 8 |
| My DOT uses resources from other state DOTs | 5 |
| Procedures for maintenance and archiving of data | 3 |
| Studies on benefits and/or return on investment for the use of operational traffic simulation models | 3 |
| Other | 3 |
| None of the above | 0 |
| Total Number of Respondents | 38 |
Note: Respondents could select multiple answers.
Sort order = Count (high to low)
indicated that they use resources from other states (Florida, Oregon, Utah, Virginia, Washington, and Wisconsin). One DOT (Nevada) indicated in the text responses that it uses FHWA resources in addition to state-specific guidelines.
Survey Results for Modeling Practices for Traffic Simulation
Questions 4, 8, 10, 14, and 18 of the survey concerned various aspects of modeling practices for operational traffic simulation. The results for Question 4, shown in Table 9, indicate that 27 responding DOTs use consultants for more than 75% of their operational traffic simulation models. Six responding DOTs use consultants for all of their operational traffic simulation models. Only three responding DOTs have consultants perform 25% or fewer of their operational traffic simulation models, and no responding DOTs perform all simulation modeling in-house.
Table 9. Survey results for percentage of operational traffic simulation models that are developed by consultants (Question 4).
| Percentage | Count |
|---|---|
| 0% | 0 |
| 1%–25% | 3 |
| 26%–50% | 10 |
| 51%–75% | 9 |
| 76%–99% | 21 |
| 100% | 6 |
| Total | 49 |
Question 8 sought information regarding the frequency of use of different simulation modeling resolutions (based on ranking, with 1 representing the most frequently used and 4 the least frequently used); the results are presented in Table 10. Based on these results, the most used simulation modeling resolution is microscopic, followed by macroscopic.
Table 10. Frequency of use of simulation modeling resolutions (Question 8).
| Modeling Resolution | Average | Standard Deviation | Number of Responses | Highest Rank | Lowest Rank |
|---|---|---|---|---|---|
| Microscopic | 1.36 | 0.65 | 44 | 1 | 4 |
| Macroscopic | 1.89 | 0.86 | 38 | 1 | 4 |
| Mesoscopic | 2.90 | 0.71 | 30 | 2 | 4 |
| Multiresolution | 3.36 | 0.76 | 25 | 1 | 4 |
Note: 1 = Most frequently used, 4 = Least frequently used
Sort order = Average (low to high)
Table 11. Survey results for ranking of factors related to operational traffic simulation modeling (Question 10).
| Factor | Average | Standard Deviation | Number of Responses |
|---|---|---|---|
| Justifying need for simulation analysis | 1.46 | 0.72 | 24 |
| Scheduling constraints | 1.88 | 0.99 | 8 |
| Level of modeling effort | 1.93 | 0.87 | 27 |
| Data availability | 1.94 | 0.75 | 17 |
| Calibrating to travel conditions | 2.00 | 0.78 | 27 |
| Future year analyses | 2.10 | 0.72 | 20 |
| Budget constraints | 2.50 | 0.53 | 10 |
| Model size (simulation geographic extent) | 2.80 | 0.45 | 5 |
| Simulation duration (simulation temporal extent) | 3.00 | 0.00 | 2 |
| Multimodal considerations | 3.00 | 0.00 | 3 |
| Other | 3.00 | - | 1 |
Note: 1 = Most important, 2 = Second most important, and so on.
Sort order = Average (low to high)
Table 12. Frequency of use of calibration metrics (Question 14).
| Calibration Metric | Never | Rarely | Sometimes | Usually | Always | Total | Average* |
|---|---|---|---|---|---|---|---|
| Volumes | 3 | 1 | 2 | 11 | 32 | 49 | 4.39 |
| Visual inspection | 1 | 2 | 8 | 16 | 19 | 46 | 4.09 |
| Other | 1 | 0 | 0 | 4 | 2 | 7 | 3.86 |
| Travel times | 2 | 5 | 8 | 20 | 14 | 49 | 3.80 |
| Queue length | 3 | 1 | 15 | 18 | 11 | 48 | 3.69 |
| Intersection LOS | 8 | 4 | 9 | 10 | 15 | 46 | 3.43 |
| Freeway density | 7 | 6 | 16 | 9 | 6 | 44 | 3.02 |
* Calculated based on these values: 1 = Never, 2 = Rarely, 3 = Sometimes, 4 = Usually, 5 = Always
Note: Sort order = Average (high to low)
Question 10 asked DOTs to rank the importance of various factors related to operational traffic simulation modeling (1 = most important, 2 = second most important, and so on). The results, provided in Table 11, show that the highest-rated factors are justifying the need for simulation analysis, scheduling constraints, level of modeling effort, and data availability; the lowest-rated factors are simulation duration and multimodal considerations.
Table 13. Frequency of reuse or adaptation of previously developed operational traffic simulation models (Question 18).
| Frequency | Count |
|---|---|
| Never | 3 |
| Rarely | 14 |
| Sometimes | 19 |
| Usually | 12 |
| Always | 1 |
| Total | 49 |
Question 14 sought information on the frequency of use of calibration metrics, and the results are presented in Table 12. The results indicate that the following calibration metrics are used by responding DOTs at least some of the time: volumes, visual inspection, travel times, queue length, intersection LOS, and freeway density. The calibration metrics used most often by responding DOTs are volumes and visual inspection. Other calibration metrics noted in the text responses include speeds, lane utilization, driver behavior, percent served, and freeway capacity.
Question 18 asked about the frequency of DOTs’ reuse or adaptation of previously developed operational traffic simulation models; results are shown in Table 13. The most common response to this question was “sometimes” (19 DOTs), followed by “rarely” (14) and “usually” (12). Three responding agencies (the Arizona and South Carolina DOTs and the Vermont Agency of Transportation) indicated that they do not reuse or adapt previously developed models.
Survey Results for Software and Data for Traffic Simulation Models
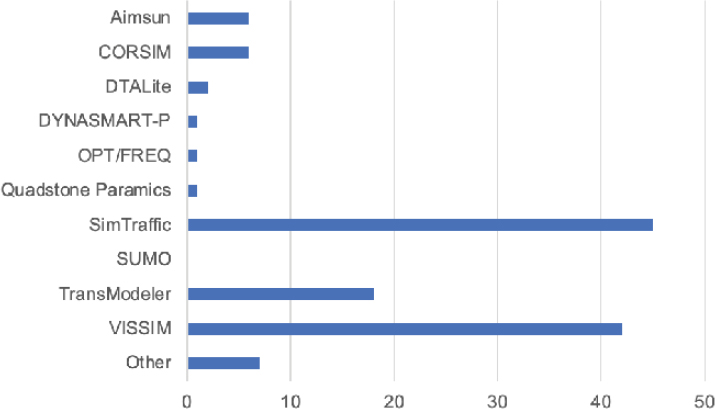
Three survey questions (9, 11, and 19) asked about DOT practices for simulation software and data sources. Based on the responses to Question 9 (see Figure 29), the software packages used by the highest number of responding DOTs are SimTraffic and Vissim; the software packages used by the lowest number of responding DOTs are SUMO, DYNASMART-P, OPT/FREQ, and Quadstone Paramics. The use of SIDRA, Synchro, and Highway Capacity Software (HCS) was mentioned in the text responses (see Appendix B).
The results for the frequency of adoption of new versions of operational traffic simulation software are presented in Table 14. These results show that 21 responding DOTs adopt new versions of operational traffic simulation software at least every two years. In the text responses, DOTs noted that this frequency can vary based on the software, schedule, and costs.
Question 11 asked about the frequency of use of various data sources for operational traffic simulation models; the results are provided in Table 15. These results show that the most frequently used data sources are traffic counts, field observations, aerial imagery, and online map data;
Total number of responses = 49
Figure 29. Software packages used for operational traffic simulation models (Question 9).
Table 14. Survey results for frequency of adoption of new versions of operational traffic simulation software (Question 19).
| Frequency | Count |
|---|---|
| Every year | 9 |
| Every 2 years | 12 |
| Every 3–5 years | 13 |
| Every 6–10 years | 2 |
| Every 10 years or more | 0 |
| My DOT does not adopt new versions of simulation software | 3 |
| Other | 10 |
| Total | 49 |
Table 15. Frequency of use of data sources for operational traffic simulation models (Question 11).
| Data Source | Never | Rarely | Sometimes | Usually | Always | Total | Average* |
|---|---|---|---|---|---|---|---|
| Traffic counts | 0 | 0 | 0 | 10 | 39 | 49 | 4.80 |
| Aerial imagery | 1 | 0 | 8 | 17 | 23 | 49 | 4.24 |
| Online map data (e.g., Google Maps) | 1 | 2 | 12 | 14 | 19 | 48 | 4.00 |
| Field observations | 1 | 4 | 10 | 14 | 19 | 48 | 3.96 |
| GIS data (e.g., speed limits) | 0 | 6 | 14 | 11 | 16 | 47 | 3.79 |
| Queuing data | 3 | 7 | 7 | 24 | 7 | 48 | 3.52 |
| Output from regional travel demand forecasting models | 4 | 6 | 10 | 17 | 11 | 48 | 3.52 |
| Probe travel time or speed data | 3 | 10 | 15 | 13 | 7 | 48 | 3.23 |
| As-built plans | 2 | 16 | 14 | 10 | 6 | 48 | 3.04 |
| Speed studies | 2 | 15 | 19 | 8 | 3 | 47 | 2.89 |
| Other | 2 | 0 | 2 | 1 | 1 | 6 | 2.83 |
| Manual travel time runs | 5 | 16 | 18 | 7 | 2 | 48 | 2.69 |
| Probe origin–destination data | 9 | 9 | 22 | 7 | 1 | 48 | 2.63 |
| Bluetooth speed data | 9 | 15 | 19 | 3 | 1 | 47 | 2.40 |
| Transit data | 13 | 17 | 15 | 3 | 0 | 48 | 2.17 |
| Drone footage | 17 | 23 | 5 | 1 | 0 | 46 | 1.78 |
* Calculated based on these values: 1 = Never, 2 = Rarely, 3 = Sometimes, 4 = Usually, 5 = Always
Note: Sort order = Average (high to low)
the least frequently used are drone footage and transit data. Other data sources noted in the text responses include incident data, weather data, work zone data, probe speeds, travel times, lane utilization, and truck percentages.
Survey Results for Review and Documentation of Traffic Simulation Models
Four survey questions (15, 16, 17, and 20) related to DOT practices for the review and documentation of traffic simulation models. The results for Question 15, presented in Table 16, show that DOTs most often use reviews of performance measures reported from the model, model input data, and animation, and use independent reviewers less frequently than other review processes.
Questions 16 and 17 sought information regarding the frequency of use of various MOEs as output for operational traffic simulation models for uninterrupted and interrupted flow. The results, presented in Table 17 and Table 18, show that a wide range of MOEs is used for both uninterrupted flow and interrupted flow. Speed, travel time, and density/LOS are most frequently used for uninterrupted flow; delay/LOS and queue length are most frequently used for interrupted flow. Other MOEs noted in the text responses include lane utilization and truck percentages for uninterrupted flow and number of stops and percent served for interrupted flow.
Table 16. Frequency of use of processes for review of operational traffic simulation models (Question 15).
| Process | Never | Rarely | Sometimes | Usually | Always | Total | Average* |
|---|---|---|---|---|---|---|---|
| Review of performance measures reported from model | 2 | 2 | 2 | 13 | 29 | 48 | 4.35 |
| Review of model input data | 1 | 2 | 5 | 16 | 24 | 48 | 4.25 |
| Review of animation | 0 | 1 | 10 | 21 | 13 | 45 | 4.02 |
| Review of model error log | 4 | 4 | 10 | 13 | 15 | 46 | 3.67 |
| Other | 1 | 0 | 0 | 0 | 2 | 3 | 3.67 |
| Completion of model review checklist | 11 | 5 | 4 | 12 | 14 | 46 | 3.28 |
| Use of independent reviewer | 6 | 9 | 11 | 13 | 8 | 47 | 3.17 |
* Calculated based on these values: 1 = Never, 2 = Rarely, 3 = Sometimes, 4 = Usually, 5 = Always
Note: Sort order = Average (high to low)
Table 17. Frequency of use of MOEs as output for operational traffic simulation models for uninterrupted flow (Question 16).
| MOE | Never | Rarely | Sometimes | Usually | Always | Total | Average* |
|---|---|---|---|---|---|---|---|
| Speed | 3 | 1 | 3 | 20 | 20 | 47 | 4.13 |
| Travel time | 3 | 1 | 5 | 19 | 20 | 48 | 4.08 |
| Density/LOS | 3 | 3 | 2 | 19 | 19 | 46 | 4.04 |
| Queue length | 1 | 2 | 8 | 23 | 14 | 48 | 3.98 |
| Volume throughput | 2 | 3 | 10 | 16 | 14 | 45 | 3.82 |
| Visualization of results/animation | 3 | 2 | 8 | 22 | 11 | 46 | 3.78 |
| Delay/LOS | 3 | 9 | 6 | 7 | 21 | 46 | 3.74 |
| Duration of congestion | 3 | 5 | 18 | 16 | 4 | 46 | 3.28 |
| Other | 1 | 0 | 1 | 1 | 0 | 3 | 2.67 |
* Calculated based on these values: 1 = Never, 2 = Rarely, 3 = Sometimes, 4 = Usually, 5 = Always
Note: Sort order = Average (high to low)
Table 18. Frequency of use of MOEs as output for operational traffic simulation models for interrupted flow (Question 17).
| MOE | Never | Rarely | Sometimes | Usually | Always | Total | Average* |
|---|---|---|---|---|---|---|---|
| Delay/LOS | 1 | 0 | 0 | 8 | 38 | 47 | 4.74 |
| Queue length | 0 | 0 | 2 | 18 | 28 | 48 | 4.54 |
| Visualization of results/animation | 2 | 1 | 12 | 19 | 11 | 45 | 3.80 |
| Volume throughput | 3 | 3 | 11 | 17 | 13 | 47 | 3.72 |
| Travel time | 3 | 1 | 18 | 16 | 10 | 48 | 3.60 |
| Other | 1 | 0 | 0 | 2 | 1 | 4 | 3.50 |
| Speed | 3 | 6 | 15 | 16 | 7 | 47 | 3.38 |
| Density/LOS | 6 | 6 | 10 | 13 | 11 | 46 | 3.37 |
| Duration of congestion | 5 | 7 | 18 | 14 | 4 | 48 | 3.10 |
* Calculated based on these values: 1 = Never, 2 = Rarely, 3 = Sometimes, 4 = Usually, 5 = Always
Note: Sort order = Average (high to low)
Table 19. Deliverables required for operational traffic simulation models (Question 20).
| Deliverable | Count |
|---|---|
| Summary of MOEs | 41 |
| Simulation model files | 40 |
| Technical memorandum of results | 38 |
| Volume diagrams | 36 |
| Methods and assumptions document | 34 |
| Calibration tables or memo | 26 |
| Animation files | 18 |
| Quality control checklist | 17 |
| Data archiving plan | 8 |
| Other | 5 |
| Total Number of Respondents | 47 |
Notes: Respondents could select multiple answers.
Sort order = Count (high to low)
Question 20 asked respondents what types of deliverables their DOTs require for operational traffic simulation; the results are provided in Table 19. These results show that the deliverables required by the highest number of responding DOTs are (1) a summary of MOEs, (2) simulation model files, (3) a technical memorandum of results, (4) volume diagrams, and (5) a methods and assumptions document. A data archiving plan is the deliverable required by the lowest number of responding DOTs. Other deliverables noted in the text responses include time/space diagrams, traffic volumes forecasting memo, queue length and/or LOS diagrams, and area of influence maps.
Survey Results for Other Practices for Traffic Simulation Models
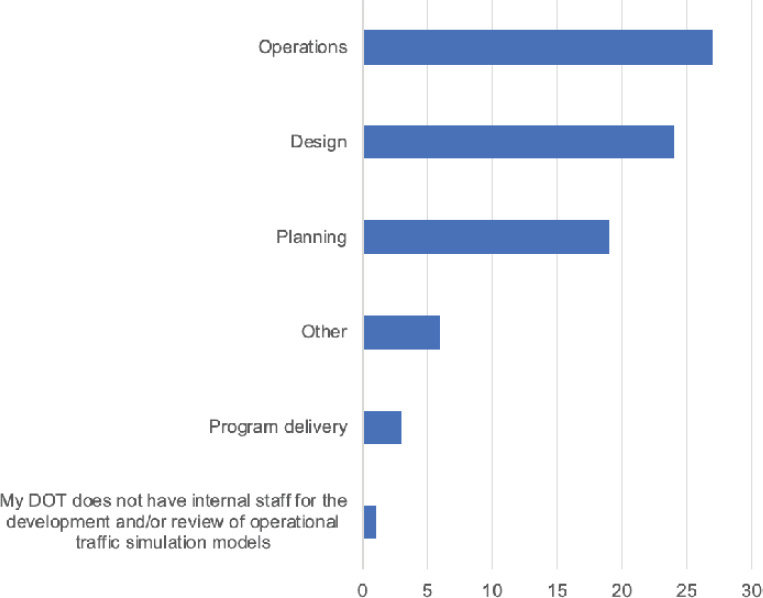
Questions 22 and 23 sought information regarding other DOT practices for operational traffic simulation models, such as staffing, approval processes, data fusion, training, and modeling. The results for Question 22, provided in Figure 30, show that internal DOT staff for the development and/or review of operational traffic simulation models are placed in various divisions, mostly in operations (27 responding DOTs) and design (24 responding DOTs). TSMO and traffic engineering were also noted in the text responses.
Question 23 covered other aspects of DOT practices for operational traffic simulation modeling, and the results are shown in Table 20. Highlights of some of the key findings for this question include the following:
- Almost half of the responding DOTs most frequently use operational traffic simulation models for freeways (23 responding DOTs), fuse data from different sources (22 responding DOTs), and require all simulation results to be reported with a minimum of 10 simulation seeds (22 responding DOTs).
- Eighteen responding DOTs require approval for the use of operational traffic simulation models on each project; 19 responding DOTs provide training on the use of operational traffic simulation models.
- Post-construction verification of operational traffic simulation models is limited (two responding DOTs—Maryland and Utah).
Sort order = Count (high to low)
Total number of responses = 48
Figure 30. Placement of internal staff for the development and/or review of operational traffic simulation models (Question 22).
Table 20. General statements regarding operational traffic simulation models (Question 23).
| Statement | Count |
|---|---|
| My DOT most frequently uses operational traffic simulation models for freeways | 23 |
| My DOT fuses data from different sources for operational traffic simulation models | 22 |
| My DOT requires all simulation results to be reported with a minimum of 10 simulation seeds | 22 |
| My DOT provides training on the use of operational traffic simulation models (e.g., policies and procedures, software) | 19 |
| My DOT requires approval for the use of operational traffic simulation models on each project | 18 |
| My DOT places emphasis on different model parameters based on the modeling software being used or type of application | 17 |
| My DOT updates data inputs for operational traffic simulation models on a regular basis | 12 |
| My DOT spends a lot of resources on researching and updating our state-specific guidance | 7 |
| My DOT sometimes performs post-construction verification of operational traffic simulation models | 2 |
| None of the above | 0 |
| Total Number of Respondents | 41 |
Note: Respondents could select multiple answers.
Sort order = Count (high to low)
Survey Results for Participation in a Case Example
In response to Question 24, 16 DOT respondents indicated that their DOT would be willing to participate as a case example.
Summary of Key Survey Findings by Topic
Key findings from the survey are summarized and organized by topic in this section. A tabular summary of key survey findings by topic is provided in Table 21. Individual survey responses for all questions, including text responses, are available in Appendix B.
Key Survey Findings for Extent of Use and Applications for Operational Traffic Simulation Models
- All 49 responding state DOTs use operational traffic simulation models.
- Twenty-seven responding DOTs apply operational simulation models for 25 or fewer projects annually.
Table 21. Summary of key survey findings by topic.
| Description | Finding |
|---|---|
| Extent of Use and Applications | |
| Number of responding DOTs that use operational traffic simulation models | 49 |
| Average percentage of projects for which responding DOTs use operational traffic simulation models | 31.9% |
| Number of responding DOTs that require approval for the use of operational traffic simulation models on each project | 18 |
| Application used by highest number of responding DOTs | Signal retiming analysis |
| Number of responding DOTs that use operational traffic simulation models most frequently for freeways | 23 |
| Guidance and Other Resources | |
| Guidelines used by highest number of responding DOTs | State-specific guidance |
| Modeling Practices | |
| Most used simulation modeling resolution | Microscopic |
| Most used calibration metric | Volumes |
| Software and Data | |
| Software used by highest number of responding DOTs | SimTraffic |
| Most used data source | Traffic counts |
| Review and Documentation | |
| Most used review process | Reviews of performance measures |
| Deliverable required by highest number of responding DOTs | Summary of MOEs |
| Staffing, Management, and Training | |
| Most prevalent division for DOT staff | Operations |
| Number of responding DOTs that use consultants for more than 75% of their operational traffic simulation models | 27 |
| Number of responding DOTs that have developed training materials | 11 |
- On average, state DOTs use operational traffic simulation models on approximately one-third of all projects.
- Eighteen responding DOTs require approval for the use of operational traffic simulation models on each project.
- At least 35 responding DOTs use operational traffic simulation models to some extent for each of these applications: signal retiming analyses, freeway design alternatives analyses, arterial design alternatives analyses, TIAs, and design visualization and communication. Of these applications, operational traffic simulation models are most often used for freeway design alternative analyses, mixed design alternative analyses, and signal retiming analyses. Seven responding DOTs use operational traffic simulation models for evacuation route analyses. Twenty-three responding DOTs use operational traffic simulation models most frequently for freeways.
- The specialized application used by the highest number of DOTs is signal optimization (38 responding DOTs); the specialized application used by the lowest number of DOTs is for CAV analyses (three responding DOTs). Thirteen responding DOTs indicated the use of hybrid/MRM. Other specialized applications used by state DOTs include validation of existing and future scenario networks, alternatives analysis, and tolling analysis.
Key Survey Findings for Guidance and Other Resources for Operational Traffic Simulation Models
- Responding DOTs most often use state-specific guidance (19 responding DOTs), followed by ad hoc project-based decisions (15 responding DOTs) for the calibration of operational traffic simulation models.
- Six responding DOTs primarily use the 2004 version of the TAT (Dowling et al. 2004); four responding DOTs primarily use the 2019 version of the TAT (Wunderlich et al. 2019).
- Five responding DOTs (those of Missouri, Nevada, New Hampshire, New Mexico, and Oklahoma) use resources from other states.
- Twenty responding DOTs have a process for documenting deviations from modeling guidance on specific projects.
- Responding DOTs have most often developed guidance documents, followed by suggested calibration parameters and procedures for model development and review.
- The availability of documentation for development of procedures for maintenance and archiving of data or performance studies on the benefits of—or return on investment for—the use of operational traffic simulation models is infrequent.
Key Survey Findings for Modeling Practices for Operational Traffic Simulation
- The most frequently used simulation modeling resolution is microscopic, followed by macroscopic.
- The factors believed to be most important for operational traffic simulation models are justifying the need for simulation analysis, scheduling constraints, level of modeling effort, and data availability.
- The following calibration metrics are used, on average, at least sometimes by responding DOTs: volumes, visual inspection, travel times, queue length, intersection LOS, and freeway density. The calibration metrics used most often by responding DOTs are volumes and visual inspection.
- Although nearly all (46) responding DOTs reuse or adapt previously developed operational traffic simulation models to some extent, this practice is used with a frequency of “usually” or “always” by only 13 responding DOTs.
Key Survey Findings for Software and Data for Operational Traffic Simulation Models
- The software packages used by the highest number of responding DOTs are SimTraffic and Vissim.
- Twenty-one responding DOTs adopt new versions of operational traffic simulation software at least every two years; the frequency of adopting new software versions can vary depending on the software, schedule, and costs.
- The most frequently used data sources for operational traffic simulation models are traffic counts, field observations, aerial imagery, and online map data; the least frequently used data sources are drone footage and transit data.
- Twenty-two responding DOTs fuse data from different sources.
Key Survey Findings for Review and Documentation of Operational Traffic Simulation Models
- For review processes, responding DOTs most often use reviews of performance measures reported from the model, model input data, and animation; they use independent reviewers less often than other review processes.
- A wide range of MOEs are used for both uninterrupted flow and interrupted flow. Speed, travel time, and density/LOS are the most often used for uninterrupted flow; delay/LOS and queue length are most often used for interrupted flow.
- The deliverables required by the highest number of responding DOTs are (1) a summary of MOEs, (2) simulation model files, (3) a technical memorandum of results, (4) volume diagrams, and (5) a methods and assumptions document.
- Twenty-two responding DOTs require all simulation results to be reported with a minimum of 10 simulation seeds.
- Post-construction verification of operational traffic simulation models is infrequent (indicated by only two responding DOTs).
Key Survey Findings for Staffing, Management, and Training for Operational Traffic Simulation Models
- Twenty-seven responding DOTs use consultants for more than 75% of their operational traffic simulation models. No responding DOTs perform all simulation modeling in-house.
- Internal DOT staff for the development and review of operational traffic simulation models are placed in various divisions, mostly in the areas of operations and design.
- Eleven responding DOTs have developed training materials for operational traffic simulation models.
Summary of Key Survey Findings by DOT
Key findings from the survey, organized by responding DOT state, are shown in Table 22. The results show that there do not appear to be any strong correlations between the number of projects per year and other aspects of DOT practices for simulation modeling. For example, both the Connecticut DOT (more than 100 projects per year) and the Idaho Transportation Department (0–10 projects per year) require approval for the use of simulation modeling on a project, as denoted by X in the table.
Table 22. Summary of key survey findings by DOT.
| Respondent | Number of Projects per Year | Most Frequent Modeling Resolution | Most Common Guidance | Use of Simulation Requires Approval | Simulation Most Frequently Used on Freeways |
|---|---|---|---|---|---|
| Alabama | 26–50 | Micro | Other | – | X |
| Alaska | – | – | – | – | – |
| Arizona | 11–25 | Macro | State-specific | – | – |
| Arkansas | 11–25 | Micro | State-specific | – | – |
| California | 26–50 | Micro | State-specific | – | – |
| Colorado | > 100 | Macro | State-specific | – | – |
| Connecticut | > 100 | – | Ad hoc | X | – |
| Delaware | 0–10 | Micro | State-specific | – | – |
| District of Columbia | 11–25 | Micro | TAT 2004 | X | X |
| Florida | 26–50 | Micro | State-specific | – | X |
| Georgia | > 100 | Micro | State-specific | – | X |
| Hawaii | – | – | – | – | – |
| Idaho | 0–10 | Macro | Ad hoc | X | – |
| Illinois | 26–50 | – | Ad hoc | – | – |
| Indiana | 26–50 | Micro | TAT 2019 | – | X |
| Iowa | 11–25 | Macro | Ad hoc | X | – |
| Kansas | 11–25 | Micro | TAT 2004 | – | X |
| Kentucky | 11–25 | Micro | State-specific | – | X |
| Louisiana | 11–25 | Macro | TAT 2019 | X | – |
| Maine | > 100 | Micro | Ad hoc | – | – |
| Maryland | > 100 | Micro | Other | X | X |
| Massachusetts | 11–25 | Macro | Ad hoc | X | – |
| Michigan | > 100 | Micro | State-specific | – | X |
| Minnesota | 11–25 | Macro | State-specific | X | X |
| Mississippi | 0–10 | Micro | Ad hoc | – | – |
| Missouri | 11–25 | Micro | State-specific | – | X |
| Montana | 11–25 | Micro | TAT 2004 | – | – |
| Nebraska | 0–10 | – | TAT 2004 | – | – |
| Nevada | 11–25 | Micro, MRM | State-specific | – | X |
| New Hampshire | 0–10 | Micro | TAT 2019 | X | – |
| New Jersey | 26–50 | Macro | State-specific | X | – |
| New Mexico | 0–10 | Macro | Ad hoc | X | X |
| Respondent | Number of Projects per Year | Most Frequent Modeling Resolution | Most Common Guidance | Use of Simulation Requires Approval | Simulation Most Frequently Used on Freeways |
|---|---|---|---|---|---|
| New York | 51–100 | Micro | Other | – | – |
| North Carolina | 51–100 | Micro | State-specific | X | X |
| North Dakota | 0–10 | Micro | Ad hoc | – | – |
| Ohio | > 100 | – | Ad hoc | – | X |
| Oklahoma | 26–50 | Micro | Other | X | – |
| Oregon | > 100 | Micro | State-specific | – | X |
| Pennsylvania | – | – | Ad hoc | – | – |
| Rhode Island | 0–10 | Micro | Ad hoc | – | X |
| South Carolina | 11–25 | Micro | Ad hoc | – | – |
| South Dakota | 0–10 | Micro | TAT 2004 | – | – |
| Tennessee | 26–50 | Macro | Other | X | X |
| Texas | 11–25 | Macro | TAT 2019 | – | X |
| Utah | 51–100 | Micro | State-specific | X | X |
| Vermont | 0–10 | Micro | Ad hoc | – | – |
| Virginia | 51–100 | Macro | State-specific | X | X |
| Washington | 26–50 | Micro | State-specific | X | X |
| West Virginia | 11–25 | Micro | TAT 2004 | – | – |
| Wisconsin | 0–10 | Micro | State-specific | X | X |
| Wyoming | 0–10 | Macro | Ad hoc | – | – |


