Health and Disability Among Working-Age Adults: Trends, Disparities, and Implications for Employment and Federal Programs: Proceedings of a Workshop (2025)
Chapter: 3 Period and Cohort Trends in Disabling Morbidity - Health and Medical Drivers
3
Period and Cohort Trends in Disabling Morbidity—Health and Medical Drivers
Key Points Highlighted by Presenters
- Examining both period and cohort trends in morbidity and disability is complicated by the fact that—after taking into account the nature of the disability and the groups being affected by race, ethnicity, and socioeconomic status—many countervailing trends emerge. (Hiram Beltrán-Sánchez, Anna Zajacova)
- Focusing on overall patterns obscures the fact that recovery is as common as incident impairments among midlife adults. (Hiram Beltrán-Sánchez)
- Increases in excess weight and obesity, the main driving forces behind trends in cardio-metabolic disease in working-age adults, may also be a major factor behind recent rises in mortality and disability. (Neil Mehta)
- Pain is closely associated with disability, explaining roughly 40 percent of the trend in functional limitation estimates. Both pain and disability have surged in the post-COVID-19 era. (Anna Zajacova)
OVERVIEW
This session of the workshop sought to address questions such as the following:
- Among the working-age population, what are the health-related factors driving trends and disparities in disability and disabling morbidity (e.g., obesity, cardiovascular disease, diabetes, physical and psychological pain)?
- What impacts have COVID-19 and long COVID-19 had on projected trends in disability?
- What countervailing trends have emerged for different age/demographic groups? What do the various longitudinal data sources reveal?
- How are disability trends interacting with those for other health and risk factors?
The session, moderated by workshop chair, Emily Agree, included presentations by committee member Hiram Beltrán-Sánchez (University of California, Los Angeles), who discussed disability trends and trajectories in the COVID-19 era; Neil Mehta (University of Texas Medical Branch), who provided overviews of the interactions among disability, physical functioning, and health and of the roles of obesity and related cardio-metabolic conditions; and Anna Zajacova (Western University, Ontario), who discussed disability trends among adults ages 18–44 as well as links between pain and disability.
DISABILITY TRENDS AND TRAJECTORIES IN THE COVID-19 ERA
Hiram Beltrán-Sánchez (University of California, Los Angeles) divided his discussion of recent trends in disability into two parts, first talking about measures of activities of daily living (ADLs) and then addressing measures of functional limitations. Research has found that the prevalence of older adults with activity limitations declined during the 1980s and 1990s (Wolf et al., 2005). However, some studies have indicated an increase in prevalence of self-care limitations among both older and younger adults in the early 2000s (see, also, Crimmins & Beltrán-Sánchez, 2011; Freedman & Spillman, 2021; Zajacova & Margolis, 2024).
Beltrán-Sánchez also described trends in the prevalence of functional limitations as captured by data from the University of Michigan’s Health and Retirement Study (HRS), which made it possible to look at the individual level at each pair of survey waves. Analyses of these data focused on four key functional limitations: walking one block, getting up from a chair
after sitting for a long period, lifting or carrying 10 pounds, and reaching or extending arms above the shoulder level. Using a mixed-effects model, Beltrán-Sánchez was able to look at both the likelihood of developing one of the functional limitations and the likelihood of recovering from one. Table 3-1 presents the overall results, indicating that up to 10 percent of subjects developed a functional limitation from one wave to another, and up to 50 percent of those who had a functional limitation in one time period recovered from that limitation in the next time period.
The statistics presented in Table 3-1 are for an overall population, and it must be noted that important differences appear when one controls for background characteristics such as age, educational attainment, poverty, and marital status. Beltrán-Sánchez noted, for example, that foreign-born Latinos were less likely to develop, and more likely to recover from, limitations compared to other racial/ethnic groups. Black respondents and those in the “Other” racial/ethnic group were, in general, more likely to develop and less likely to recover from physical functional limitations. Higher probabilities of developing a limitation were found to be strongly and significantly associated with being female, of older age, having lower educational attainment, having health insurance (Medicare, Medicaid, or VA), and being separated or divorced. Higher probabilities of recovery from limitations were significantly associated with having higher educational attainment, being male (for standing and lifting), not being separated or divorced (for lifting and reaching), and having employer-based insurance (for most limitations).
Given the rates of recovery shown by respondents from one wave of the HRS to the next, a key takeaway pointed out by Beltrán-Sánchez is
TABLE 3-1 Likelihood of Developing and Recovering from a Functional Limitation (FL)
| Type of Functional Limitation (FL) | Whether or Not Individual Develops an FL | Whether or Not Individual Recovers From an FL | ||
|---|---|---|---|---|
| Percent of Wave-pairs Without This FL at Time 1 | Percent of Those Who Develop the FL by Time 2 | Percent of Wave-Pairs With This FL at Time 1 | Percent of Those Who Do Not Have the FL by Time 2 | |
| Walking | 89.0 | 6.2 | 11.0 | 34.6 |
| Standing | 94.2 | 3.6 | 5.8 | 50.5 |
| Lifting | 79.5 | 10.1 | 20.5 | 32.3 |
| Reaching | 84.7 | 8.7 | 15.3 | 43.0 |
SOURCE: Presentation by Hiram Beltrán-Sánchez on October 15, 2024, based on data from the Health and Retirement Study: 1998–2018.
that treating functional limitation as an “absorbing state” is likely to substantially overestimate the amount of time older adults spend functionally limited.
OVERVIEW OF DISABILITY, PHYSICAL FUNCTIONING, HEALTH AND THE ROLES OF OBESITY AND RELATED CARDIO-METABOLIC CONDITIONS
Neil Mehta (University of Texas Medical Branch) began his presentation by commenting on the trends indicating a general pattern of improvement in health and disability from the 1970s into the 1990s, but a divergence in trends by age groups around the year 2000. While those over age 70 continued to show declines in disability into this century, rates among working-age adults were either stagnant or increasing. Figure 3-1 shows how disability levels (measured as ADLs) have changed for people ages 54–64, by sex and race/ethnicity. Overall, there were increases in disability rates since 2000 for both women and men, and across all three racial/ethnic groups shown. There were also major disparities, with Blacks (the red line) showing the highest levels of disability, and Whites (the blue line) showing the lowest. Blacks showed a large rate of increase in disability rates between 2000 and 2010, and Hispanics showed a large rate of increase since 2010. Similar patterns appeared for instrumental activities of daily living (IADLs), which are more complex tasks than basic ADLs. Other demographic characteristics also mattered. Disability levels were largely flat among those with bachelor’s degrees, but those without bachelor’s degrees showed robust gains in disability levels.
In Mehta’s view, how trends in cardiometabolic risk factors and their medical management are affecting trends in disability among working-age adults is understudied. Researchers increasingly recognize that there is a relationship between diabetes and actual functioning, whether that is in the form of physical functioning, cognitive functioning, or affective functioning. Cardiometabolic risks (obesity, diabetes, blood pressure) are rising across all ages of our population, beginning as early as age 10. On the other hand, the detection of cardiometabolic risks has improved considerably over the past 15 years. The number of medical treatments for cardiometabolic risks has increased, and the effectiveness of these treatments has also appeared to increase.
A number of trends in cardiometabolic risk factors have been observed in recent years. Mehta described how the period after 2010 is one during which average body mass index (BMI) increased faster than in the previous two decades. Mean hemoglobin A1c (HbA1c) levels have increased over time in the population as well, despite better medical management of blood sugars. The prevalence of diagnosed diabetes has been skyrocketing during
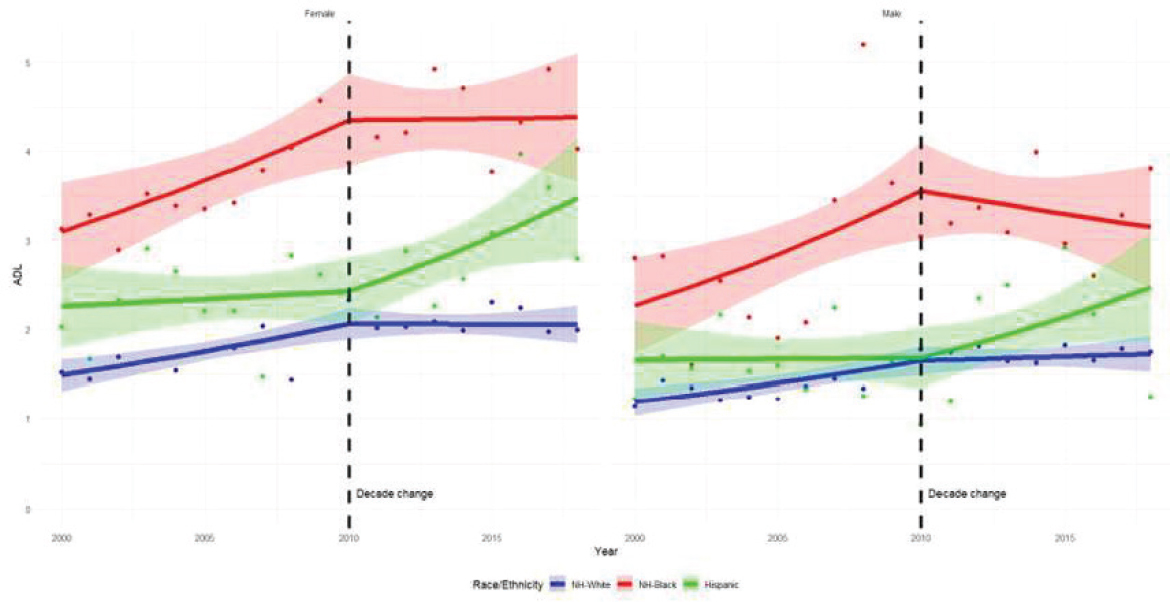
SOURCE: Presentation by Neil Mehta on October 15, 2024.
this period as well. After 2010, levels of mean systolic blood pressure have increased in the adult population, while at the same time cholesterol levels continue to decline, primarily due to use of statin drugs.
Mehta discussed how, balancing against these risk factors, detection of diabetes has improved, and there is evidence of success in treatments for reducing glycemic control and A1cs and blood sugars. Lipid controls have improved as well. From 2000 to 2018, control of blood pressure has improved among those diagnosed with hypertension, though there have been some troubling patterns since 2010. The trend continues of growing numbers of people entering working age while living with obesity. This trend is affecting overall nationwide measures of mortality and, in Mehta’s assessment, is likely a main culprit in the nation’s stagnating life expectancy. Trends in obesity are also likely exerting considerable influence on some of the disability patterns reported by other participants during the workshop.
The details of how trends in disability and cardiometabolic risk factors causally interact with one another are not fully known. But Mehta’s examination of cross-sectional data from the National Health and Nutrition Examination Survey (NHANES) 2013–14 reveals that, for people up to about age 75, 70 percent of disability occurs in people with cardiometabolic risk factors. For men in this age group, hypertension is very strongly correlated with disability measured as a combination of ADLs and IADLs. And in women, obesity and hypertension are the key correlates.
Mehta observed that no society has been able to bend the arc of the obesity trajectory, despite more than 30 years of public health focus on this risk factor. Now, for the first time, novel therapeutics have emerged (most visibly, Ozempic, which received Federal and Drug Administration approval in 2017, albeit for use in adults with type 2 diabetes) with the potential to influence bodyweight trajectories. Based on simulations, if excess bodyweight (all BMI over 25) were eliminated entirely from populations, by age 70 mortality could be reduced by 10 percent to 15 percent.
Mehta closed with comments about research priorities for identifying why disability has been rising among working-age populations. Perhaps most obviously, disability trend studies building on earlier work in demography should be updated. Potential causes to investigate include the migration of Hispanics, incidence of early diabetes and obesity, labor force exposures, sociodemographic changes, and other factors in the broader U.S. context. More information is needed on how changing cardiometabolic risk factors are influencing nationwide patterns in working-age disability. More information is also needed to identify some of the proximal physiological causes of disability—that is, how much disability is related to early stroke, myocardial infarction, musculoskeletal or arthritic conditions, kidney diseases (including early kidney disease), early liver disease, and sensory limitations. Mehta noted further that cancer mortality is rising
among working-age adults, and even among younger adults, and there is a need to learn how that is influencing disability and other health trends.
DISABILITY TRENDS AMONG ADULTS AGES 18–44; TRENDS IN PAIN AND OTHER OUTCOMES AND LINKS BETWEEN PAIN AND DISABILITY
Anna Zajacova (Western University, Ontario) rounded out the session by discussing research on disability trends among working-age adults, trends in pain and related outcomes, and links between pain and disability. An overarching theme in her remarks was that pain is central to disability and needs to be studied in concert, which has not often been done in the literature, especially for younger adults. In response to this research gap, Zajacova and colleagues set out to investigate the topic in several papers using National Health Interview Survey (NHIS) data.
Disability and limitation trends over the period 2000–2018 among adults ages 18–44 were found to be highly variable across different dimensions (Zajacova & Margolis, 2024). For example, there were increases in vision limitations but decreases in hearing limitations, and flat trends for mobility despite increases in BMI and obesity. One conclusion is that combining all these domains into one disability measure has the effect of obscuring the relevant variability that is needed to understand possible strategies to effectively combat negative trends. Adjusting for standard explanatory characteristics (social factors, health behavioral factors, and health conditions) made little difference in these results. Education did stand out as a suppressor; if education had not increased over time, then the concerning disability trends among young adults may have been worse. BMI also carried some explanatory power, increasing in conjunction with the trends. In addition to variability in trends across different disability dimensions, there appears to be variation in trends across different population segments. For instance, in another analysis of adults aged 18 and older, which focused on cognitive limitations drawing on the 2008–2022 American Community Survey data, the limitations decreased among older adults but increased among younger adults.
In addressing the relationship between pain and disability, Zajacova reported findings from numerous studies1 indicating steady increases in chronic pain among U.S. adults of all ages and subgroups. The increases may have slowed or even reversed just before and during the pandemic. At the same time, there is variability in the trends. For example, lower-thresh-
___________________
1 For example, Zajacova et al. (2021) in Demography on pain trends 1997–2018; Zajacova et al. (in preparation) on trends 2010+ across different pain dimensions; and Ruan et al. (2024).
old chronic pain, often measured by pain frequency, appears to increase more than severe or high-impact pain. These findings reinforce the conclusion that measures and analyses need to be highly nuanced to account for these varying trends.
Zajacova explained that some disabilities, such as sensory disability, may have little or nothing to do with pain. However, many disabilities are, to a high degree, defined by pain; difficulty in climbing stairs is one of many examples. As summarized in Figure 3-2, an analysis of NHIS data by Ruan et al. (2024) found that pain and disability are closely linked. Results from this study indicate that the presence of pain doubles, triples, or quadruples the prevalence of functional limitation. The research suggests that, over the 2002–2018 period, pain explains 18 percent to 34 percent of disability disparities across education levels, and 40 percent of the upward trend in functional limitations for adults ages 45–64. Ruan et al. estimated that about 10 million more U.S. adults now have functional limitations attributable to pain than in the early 2000s.
Zajacova next turned to the topic of COVID-19 and how it was connected to pain and disability trends. Prior to the pandemic, roughly 20 percent of the population experienced chronic pain. During the pandemic, there was no significant increase, and there were actually significant decreases for high-impact chronic pain. Post-pandemic, however, major increases were observed with the figure rising to 24 percent, or from 50 million Americans
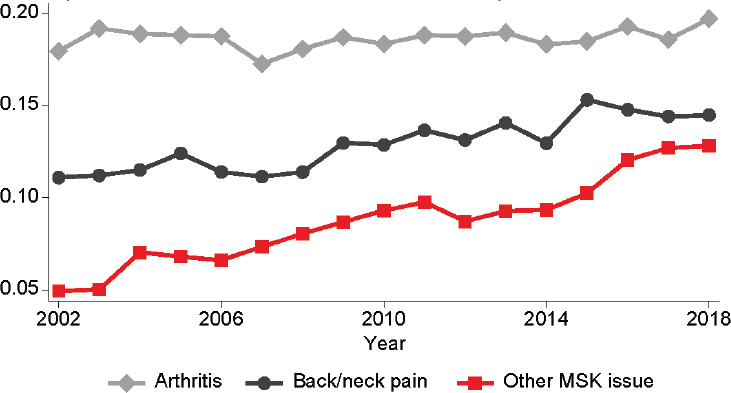
SOURCE: Presentation by Anna Zajacova on October 15, 2024, adapted from Ruan et al., 2024.
to more than 60 million. Disability reporting showed a similar pattern, holding steady during the pandemic, but escalating afterwards.
During follow-up discussion, planning committee member Nicole Maestas asked Zajacova about the role of long COVID-19 in the delayed rise of disability reports after the pandemic. Zajacova replied that long COVID-19 is a powerful predictor of chronic pain, but that even people who did not experience long COVID-19 showed an increase in disability reports. Mullen asked how differential mortality might affect the findings concerning COVID-19. Zajacova responded that COVID-19 would have removed some of the high-risk population, which may help to explain why there was not much increase in pain during COVID-19, but she did not know how that might influence the post-COVID-19 surge.
Zajacova concluded with the following points: (a) Measurement matters. When measuring and tracking disability, it would be highly beneficial to keep track of pain because pain is central in disablement processes and disability trends. (b) Pain might be considered an invisible disability. Without a clear way to diagnose pain other than the sufferers’ words, it is difficult for policies and programs (e.g., Social Security Administration) to treat it as disability.
DISCUSSION
Wrap-up discussion at the end of the session emphasized measurement and research challenges. Philippa Clarke (University of Michigan) commented that disability had been defined in multiple ways during the workshop, reflecting its broad range of applications in the research and policy worlds. For example, it had been defined as a demographic question, and also in relation to pain or cardiometabolic conditions. She wondered how to reconcile the varying definitions. Beltrán-Sánchez agreed that there can be considerable ambiguity as to what “disability” and related terms refer. Functional mobility can transition back and forth for a given individual and is not necessarily a precursor of disability. There was general agreement that, to add greater precision to communication about disability, further attention is needed to add greater nuance to the terminology.
On the measurement front, Ne’eman asked Beltrán-Sánchez if he had tried adjusting separately for age and other more intrinsic characteristics that might provide more insight on mechanisms, as compared with the social determinants of health. Beltrán-Sánchez noted the multiple processes affecting disability: at the individual level one might consider factors such as social and economic status (SES), along with external factors indicative of social support such as family size and types of family members who might assist individuals. He said it would be interesting to disentangle the impacts of these individual and social support factors.
Planning committee member Jennifer Montez asked why SES is important for transitioning into a functional limitation and not for transitioning out of it, and why SES and racial disparities are more associated with upper body disabilities than lower body disabilities. Beltrán-Sánchez responded that lower SES is associated with manual labor, which helps explain why people in that SES category face higher risk of upper-body disabilities. He suggested that because this group faces a pattern of repeated injuries and recovery, looking at longer time intervals might make income a stronger driver of recovery.
Montez also asked why so little research had been performed on disability trends in the past decade. Beltrán-Sánchez explained that one reason may be that much primary research had moved into the study of biomarkers and epigenetics. Biomarkers became a “hot field” a little more than 10 years ago, producing many doctoral students interested in the topic who then became faculty producing a lot of such work. Zajacova responded that the field of researchers is small, and examining trends is too abstract to be of much interest to graduate students. Mehta agreed that, among demographers, the focus has shifted to mortality and that the opioid epidemic shifted a considerable amount of recent research to the examination of pain. Agree commented that disability trends are not making news and added that there has been a shift from looking at population-level trends to development over the life course. Mehta agreed there is increased interest in the life course and noted that learning about longitudinal processes does not provide much information in terms of aggregate population trends. Paradoxically, more data to study disability—for example from NHANES, NHIS, HRS, National Health and Aging Trends Study, and Add Health—are available now more than ever.


