Roadside Encroachment Database and Analysis (2025)
Chapter: 2. Synthesis of Existing and Potential Encroachment Datasets and Collection Methods
2. Synthesis of Existing and Potential Encroachment Datasets and Collection Methods
The purpose of this chapter is to summarize the available literature, both U.S. and international, related to roadside encroachments, encroachment characteristics, and encroachment data collection techniques. There is a focus on both identifying existing and potential new methods of encroachment data collection and assessing the applicability of currently available data for the development of a new encroachment database.
2.1 Introduction
In 2015, there were more than 10,000 traffic-related fatalities in single-vehicle road-departure crashes in the U.S. (NHTSA 2017). Occupants of vehicles that depart the roadway are at risk of sustaining serious or fatal injury from collisions with the trees, poles, roadside slopes, and other hazards they may encounter in ROR crashes. To reduce this toll, the roadside safety community has relied on the concept of a forgiving roadside and the installation of roadside safety devices (e.g., guardrails) to protect motorists in ROR crashes. The optimal placement of these devices, as prescribed by design guidelines such as the RDG (AASHTO 2011), is critically dependent upon the trajectories that motorists are likely to take after encroaching onto the roadside or median (i.e., encroachment trajectory/data).
Previous efforts to collect encroachment data have been extremely challenging and relatively controversial. Traditional methods such as field data collection are expensive, open to controversy, narrowly focused on selected highway segments, and primarily limited to passenger vehicles (i.e., cars, SUVs, and pickup trucks). There is some concern that encroachment characteristics for other vehicle types (e.g., heavy vehicles, motorcycles) may not be well described by passenger vehicle encroachments. In addition, existing data are decades old and potentially no longer representative of either the roadside or the current vehicle fleet. Thus, a new dataset of roadside encroachment data that encompasses the wide range of U.S. highway conditions, vehicle types, and encroachment severities is needed.
2.2 Approach
This review focuses primarily on the available literature related to the following four areas:
- Previously collected roadside encroachment data and associated data collection methods.
- Characteristics of roadside encroachments and/or analysis of previously collected roadside encroachment data.
- Potential technologies/methods that could be used to collect new roadside encroachment data.
- Available data and datasets related to roadside encroachments, including those containing data on vehicle types other than passenger vehicles.
2.3 Encroachment Data Collection Methods
The following sections summarize published research relating to existing methods used to collect roadside encroachment data and potential methods to collect roadside encroachment data. The existing and potential methods are shown in Table 1. The potential methods include methods
investigated or suggested by researchers with no associated data collected, methods used on a small scale to collect encroachment data, and previously undocumented potential methods based on current and near-future technologies.
Table 1. Summary of Encroachment Data Collection Methods
| Method Type | Method | Section/Location |
|---|---|---|
| Existing | Field Collection | 2.4.1 |
| ROR State Crash Data | 2.4.2 | |
| In-Depth Crash Study | 2.4.3 | |
| Potential | Naturalistic Driving Study Methods | 2.5.1 |
| Event Data Recorder Data | 2.5.2 | |
| Google Street View Based Methods | 2.5.3 | |
| Orthoimagery-Based Methods | 2.5.4 | |
| Stationary Video Cameras | 2.5.5 | |
| Infrastructure-Based Instrumentation | 2.5.6 | |
| Vehicle-Based Methods | 2.5.7 | |
| Early Aerial Photography Efforts | Appendix A | |
| Damage Inspection Methods | ||
| Maintenance/Repair Based Methods | ||
| Early Infrastructure-Based Instrumentation Efforts | ||
| Early Video-Based Field Collection Methods |
2.4 Existing Methods for Encroachment Data Collection
Existing methods of collecting encroachment data include the field collection approach, the ROR state crash data approach, and the in-depth crash study approach. A summary of each method is provided in the following sections. In general, this includes a description of the method, a summary of the research studies that employed the method, and any documented challenges and/or limitations.
2.4.1 Field Collection Approach
The traditional method for collecting roadside encroachment data involves direct inspection of roadsides and/or medians for evidence that a vehicle encroached onto the roadside and/or median. Evidence of encroachment typically includes tire marks, soil furrowing, or collision damage to roadside objects. Data collection is generally accomplished through planned, frequent coverage of the entire length of one or more selected roadway segments for a specified time duration. Encroachment data collected generally includes overall encroachment frequency and/or encroachment rate and encroachment characteristics such as encroachment angle, lateral extent of encroachment, and longitudinal encroachment distance. Roadway segments are typically selected to represent a range of traffic volume, roadway, and roadside/median design characteristics.
A study conducted in Illinois (Hutchinson 1962; Hutchinson and Kennedy 1966) was one of the first to document this type of encroachment data collection methodology. Two-person teams of researchers in slow-moving vehicles patrolled selected highway segments and manually recorded evidence of median encroachments (Hutchinson and Kennedy 1966). Generally, these patrols occurred at least weekly (Hutchinson and Kennedy 1966), however, the available encroachment data indicate a range of patrol frequencies from several days to monthly, presumably due to some patrols resulting in no new encroachment observations. To avoid duplicate entries, experimenters
assigned each encroachment a unique number, and that number was painted on the pavement at the encroachment site. Encroachment data was primarily collected during winter months, as researchers believed frequent snow cover increased the teams’ ability to detect encroachments. Despite this assertion, a later publication indicated that less than 20% of the encroachments collected indicated a snow-covered median (McGinnis 1999).
Encroachment data were collected primarily on two four-lane divided roadway sections: Interstate 74 and Kingery Expressway (Hutchinson and Kennedy 1966). Interstate 74 was a rural roadway with lower traffic volume, and the Kingery Expressway was a higher volume urban roadway. The assumption in selecting these two roadway segments was that encroachments are a result of either: (1) a decreased driver alertness in a low-volume situation, or (2) an emergency action by a driver to avoid a collision. Decreased driver alertness was believed to be more likely on a low-volume rural road, while the emergency action would be more likely on a high-volume urban expressway.
The total regularly observed section length was approximately 30 miles, most of which was Interstate 74 (24.6 miles), and the total time duration was approximately 4 years. The vast majority of encroachment data were collected on a 40-foot-wide depressed median (Interstate 74), but the higher volume urban roadways had narrower medians (9 to 40 feet), and one other route investigated (Interstate 57) had an 80-foot-wide median. The speed limits of the observed roadways were not directly indicated in the text of the available reports, but the Hutchinson (1962) report indicated a posted speed limit in the data for 93 encroachments used in the investigation of encroachment characteristics. The majority of these 93 encroachments occurred on Route 66 (69 of 93), with the remaining occurring on Interstate 74 (23) and US 45 (1). Nearly all entries for Interstate 74 had a posted speed limit of 70 mph with only two entries at 65 mph. For Route 66, the posted speed limit ranged from 45 to 70 mph with the average being 66.6 mph. The later study by McGinnis (1999) reported that the 85th percentile speed on Route 74 was 75 mph as measured by students of Hutchinson. To determine encroachment rates, researchers had computed average daily traffic (ADT) volumes by averaging the two-direction traffic counts at each end of the selected roadway segments for a 1-week period (Hutchinson and Kennedy 1966). Traffic volumes on the two primary routes varied from 1,900 to 31,253 vehicles per day (Hutchinson and Kennedy 1966). Roadway alignment, profile, and cross-section information was obtained from construction drawings, while any other road characteristics were collected directly from field investigation.
A copy of the data collection form (Hutchinson and Kennedy 1966) used by the two-person teams can be found in Figure A-1. in Appendix A. The physical characteristics of the encroachment included the encroachment angle, the lateral extent of the encroachment, and the longitudinal distance traveled (Hutchinson and Kennedy 1966). All measurements were relative to the path of the left front wheel of the encroaching vehicle. Encroachment angle was defined as the angle between the roadway pavement edge and the initial path of the vehicle’s left front tire. Lateral extent was defined as the perpendicular distance from the pavement edge to the vehicle’s left front tire path at a specified point (e.g., maximum) in the encroachment. The longitudinal distance traveled was measured along the path of the left front tire according to the original Hutchinson and Kennedy report. McGinnis (1999) indicated that the longitudinal distance traveled in the previous research was measured parallel to the roadway, based on direct correspondence with J.W. Hutchinson. If possible, the extent of braking was also estimated for the encroachment, along with the surface over which the braking had occurred, such as turf or pavement. The raw data contained in the report (Hutchinson and Kennedy 1966) indicate vehicle type as car or truck for each encroachment. A footnote indicates vehicle type was estimated either from the scene evidence,
such as track width of the vehicle and whether the tracks were single or dual tire, or from information in an associated police crash report, if present. No further discussion of vehicle type identification was present in the report. Other collected roadway characteristics included posted speed limit, median width, median surface type, and shoulder width.
The researchers also developed a shorthand notation intended to provide information on the basic encroachment movement pattern once the vehicle first enters the median (Hutchinson 1962; Hutchinson and Kennedy 1966). Encroachments were classified as type A, B, or C depending on the number of direction changes during the median encroachment:
- No direction change
- One direction change
- Two or more direction changes
The shorthand divided the roadway segment into five zones, labelled 1 through 5, or a thru e. The numbers signify the location of the vehicle direction change(s) for type B and C encroachments. Each shorthand description ends with a lowercase letter that signifies the location where the vehicle stopped or regained control. Sample trajectories and corresponding shorthand representation along with a graphic representation of the coded zones are shown in Figure A-2. in Appendix A.
Hutchinson (1962) provided additional insight into the field collection methodology and indicated slight methodology variations depending on the specific purpose of the investigation. The study had three primary focus areas: (1) determination of encroachment frequency, (2) determination of encroachment characteristics, and (3) determination of factors causing and/or influencing encroachments. Table 2 summarizes the methodology for each focus area, all based primarily on field collection of encroachments.
| Focus Area | Method | Roadways/Duration or Road Length |
|---|---|---|
| Encroachment frequency | Field collection/direct observation, exploit frequent median snow cover | Route 74 (10/4/1960 – 4/6/1964) Edens, Calumet and Kingery Expressways (12/1 to 3/31; ’57-’58, ’58-’59, ’59-’60) |
| Encroachment characteristics | Field collection/direct observation with additional information from Police Accident Reports (PARs) | Route 74 (24.6 miles) Route 66 (180 miles +) Route 57 (< 3 miles) |
| Factors causing/influencing encroachments | Examine characteristics of sites that were identified as having a high encroachment frequency | Selected Route 66 and Route 74 sites |
The researchers identified several issues and challenges with the field collection approach for encroachment data. Hutchinson (1962) noted that it was difficult, especially early in the data collection effort, to distinguish unintentional vehicle encroachments from maintenance vehicle activities. The author also noted that frequent contact with maintenance and knowledge of their
operations reduced this potential source of error (Hutchinson 1962). Encroachments with a lateral extent less than 3 feet were omitted from the study due to difficulties detecting encroachments on the 3-foot-wide stabilized (i.e., crushed stone) left shoulder (Hutchinson 1962). Hutchinson (1962) also noted that only unintentional encroachments (and not intentional U-turns) were considered in the investigation of encroachment characteristics, but there was no detailed explanation of how this distinction was made. Other more recent researchers have indicated a general lack of appropriate definition for an unintentional encroachment and found it difficult to distinguish unintentional from intentional encroachments even with available video footage of the encroachment (Calcote et al. 1985).
Along with Hutchinson (1962) and Hutchinson and Kennedy (1966), the other primary encroachment data field collection effort was conducted in 1978 in Canada (De Leuw Cather 1978), and the collected data were analyzed by Cooper (1980, 1981). Similar to the Hutchinson and Kennedy study, teams in this effort examined selected roadway segments for visual evidence of vehicle encroachments at regular weekly intervals. Primary differences from the previous effort included a shorter overall observation duration, non-winter weather conditions, a larger geographic area, longer total observed segment length, wider shoulders, and inclusion of roadside encroachments only.
To obtain encroachment data representative of the entire country, the Canadian study included road sections from five different provinces: New Brunswick, Quebec, Ontario, Saskatchewan, and British Columbia (De Leuw Cather 1978). A total of 59 roadway sections were selected, and each was observed weekly by one of 12 teams. With the exception of one team, each team patrolled five different roadway sections during the 5 months of the study (June to October 1978). Each observed roadway section was approximately 50 miles long, and all sections had posted speed limits of 50 mph or higher. The speed limit restriction essentially eliminated urban roadway sections and produced non-continuous sections; for instance, a portion of a selected roadway that passed through a small town would be excluded if the speed limit was below 50 mph. The researchers noted that when a speed limit change was encountered, 500 meters (0.3 miles) upstream and downstream of the lower speed limit area were excluded from the roadway section length. Selected sections included both four-lane divided highways (60 mph posted speed limit) and two-lane undivided highways (50 mph posted speed limit or higher). Despite the inclusion of divided roadway segments, the study only considered encroachments onto the roadsides. The total roadway length observed was approximately 2,800 miles. Traffic volumes on the selected roadway sections varied from 700 to 29,300 vehicles per day, with variation noted along the 50-mile length of any given section. Although shoulder width varied on the selected sections, the shoulder width was primarily between 2.5 and 3.5 meters (8 to 12 feet).
Data for De Leuw Cather (1978) were collected using a two-tiered approach: researchers in the Canadian study collected background information and hired field teams who collected encroachment information during patrols of selected roadway sections. Background data included roadway traffic volume, base maps, and hazard locations/inventory, which were used to guide the selection of the 59 roadway segments. The researchers were also tasked with interviewing and hiring the field teams, which was accomplished through a temporary employment agency. Each field team member was required to attend a single training session. The researchers participated in the training session and provided direct supervision of the teams for the first week, then checked completeness and correctness of submitted data after that point on.
Each hired field team consisted of three members, with two actively engaged at any one time. The rationale was that rotating members would result in teams with higher levels of concentration throughout the patrol. Each team had a compass, a 20-meter tape, a long-distance measure meter, and a slope measuring device. In the first week, the field team used paint to mark every half and full kilometer of each roadway section along both right roadway edges. Using a different color paint, the teams then marked all instances of apparent encroachments to serve as a baseline. There were no detailed reports of these initial encroachments. In the following weeks, the teams patrolled each assigned section in vans traveling at approximately 40 miles per hour in search of new encroachment evidence.
Each new encroachment location was marked with a painted arrow or a driven stake in the roadside soil if the pavement was wet. The teams recorded new encroachments using the data collection forms (Figure A-4. and Figure A-5.) in Appendix A. Encroachment data elements collected by the field teams were similar to the data collected in the Illinois study (Hutchinson 1962; Hutchinson and Kennedy 1966) and included the encroachment angle, the lateral extent of the encroachment, and the longitudinal distance traveled, posted speed limit, and object(s) struck. The longitudinal distance traveled was clearly defined as parallel to the roadway, not along the length of tire tracks. Unlike the Illinois study that used roadway geometrics from construction drawings, researchers in the Canadian study limited roadway alignment to qualitative descriptors of horizontal (straight, curve left, curve right) and vertical (flat, uphill, downhill, bottom of dip, hill crest) alignment. Other data elements included shoulder type, roadside/ditch slope, vehicle type, and encroachment type (right or left). Similar to the Illinois study, vehicle type was estimated by indicating single or dual wheel tracks. The encroachment type element captured whether a vehicle exited the roadside directly, such as to the right, or if it crossed the median (if present) and opposing traffic lanes before encroaching onto the opposite roadside. Given the other available information, a vehicle that encroached into the median but did not eventually encroach onto the opposing roadside would be excluded from the collected data in the Canadian study.
Each team was also tasked with preparing roadside hazard inventory diagrams for each segment and acquiring relevant police crash reports. A copy of the roadside inventory form (Figure A-3.) can be found in Appendix A. The form uses 500-meter increments parallel to the roadway and 3-meter increments, up to 9 meters, laterally from the roadway edge of pavement to graphically depict off-roadway objects using standardized symbols. Based on the standardized symbols, the teams collected data on guardrails, poles, culverts, bridge abutments, trees/shrubs, ditches, and fences, presumably the bulk, if not all, of the objects located on the roadside. The precision of the lateral offset and length (for line objects like guardrails) was not known. The field teams visited police stations to obtain the crash reports and compared them to the patrol results when possible. In cases where an identified encroachment corresponded with a multi-vehicle crash, the case would be omitted from the data. Also, in a few cases, crashes would be police-reported but not identified during the patrol. In these cases, the team would investigate the location during the next patrol.
Researchers involved with the Canadian study noted several issues and challenges. Cooper (1980) noted that non-geometric or non-traffic variables, which the study did not address, could be just as important to explaining single-vehicle ROR crashes as the geometric design and traffic flow elements considered. These neglected factors included driver age, driver experience, vehicle failure, alcohol, and time of day. Data collection challenges that were noted in the study included difficulty obtaining traffic and roadway data from jurisdictions (no specifics provided), a delay of 2 weeks for the acquisition of police crash reports (due to authorization issues), and approximately
10% of the roadway sections not being established until the second week of the study (De Leuw Cather 1978). Also, there were only 3 weeks available in total to develop procedures, select roadway sections, and hire/train staff to acquire data. There was at least one methodology difference noted, as one team found driving on the shoulder was more effective for identifying encroachment evidence. This team had found a greater number of encroachments when compared to similar sections with similar traffic volumes (De Leuw Cather 1978).
The primary advantages of the field collection of encroachment data include the provision of full vehicle trajectory information and a near-census of encroachments for a given set of roadway geometry and traffic conditions. Despite the age of the currently available data, field collected encroachment data have continually been used as a basis for RDG (AASHTO 2011) guidelines and for roadside design cost-effectiveness determination procedures, suggesting a generally high level of researcher confidence in this approach. The primary disadvantage of the field collection approach was the high cost to collect large quantities of these data for a range of roadway characteristics, including roadway type, geometry, traffic volume, and posted speed limits. Other limitations include the inability to detect certain encroachments depending on the specific roadway characteristics, like an inability to detect encroachments that do not extend beyond a paved shoulder, and the inability to truly differentiate between intentional and unintentional encroachments based solely on residual scene evidence.
2.4.2 ROR State Crash Data Approach
An alternate method to the field collection of roadside encroachment data uses more readily available police-reported ROR crash data to estimate encroachments. Two primary approaches to this method have been documented in the literature: (1) using a multiplier to estimate encroachments from reported ROR crash rates and (2) developing a statistics-based crash prediction model from the available ROR crash data and then using the developed model to estimate encroachments.
Glennon and Wilton (1974, 1976) used the multiplier approach to estimate encroachment rates from available ROR crash data from Missouri. Road sections included 66 urban arterial sections in the Kansas City area and 422 highway sections across the state. For the urban arterials, the posted speed limits were between 30 and 55 mph, inclusive, traffic volumes were between 700 and 32,600 vehicles per day, and the sections were located along the 22 different streets representing 88 miles of total roadway length. The Missouri highway sections had posted speed limits of at least 40 mph, were at least 1 mile long, and had been free of construction for the previous 3 years. The 422 sections included two-lane, multi-lane divided, and interstate highways but excluded multi-lane undivided sections. Kansas City ROR crash data were obtained for a 2-year period, 1972-1973, and resulted in a total of 374 crash reports, while the Missouri state data were collected for a 3-year period, 1971-1973. The traffic volume range or the total number of crashes on the Missouri state sections were not reported.
Using the available crash data, the researchers computed the reported ROR crash rate for each section and then used simple linear regression to determine annual ROR crash rate per mile as a function of traffic volume, such as ADT. The researchers repeated this procedure using several different variables to classify the roadway sections into groups. For urban sections, the classification variables included street type, posted speed limit, fixed object frequency, and curb presence. For rural sections, the classification variables included highway type, roadbed width, and average operating speed. Only rural highway type and roadbed width for two-lane rural
highways were found to provide any crash rate discrimination. Encroachment rates were estimated by multiplying the slope of the developed crash rate as a function of traffic volume relationships by a constant of 5.23. The constant multiplier was found by dividing the estimated number of freeway encroachments by the observed number of freeway crashes (as observed in the study). Researchers estimated all freeway encroachments by doubling the slope of the encroachment rate in Hutchinson and Kennedy (1966) as a function of the traffic volume relationship between 5,000 and 30,000 vehicles per day. All encroachment relationships were also assumed to pass through the origin.
The basic premise of the second approach involves developing a crash prediction model, typically using negative binomial regression, from the available police-reported ROR crash data. Then, after making a number of assumptions, the researcher uses their developed statistical model to provide an estimate of encroachments. This method of estimating encroachment characteristics was most notably proposed by Miaou (1996), with further details provided in two later publications (Miaou 1997, 2001). Note that this method combines the two typical, but disparate, approaches to estimating ROR crash frequency: the crash-prediction method and the encroachment probability model. In the crash-prediction method, statistical methods are used in conjunction with the available crash data to develop a relationship between the dependent variable (ROR crash frequency, in this case) and available explanatory variables (e.g., traffic volume, clear recovery distance available, shoulder width). This approach was the basis for the HSM (AASHTO 2010). For the encroachment probability model, a series of conditional probabilities are used to represent the event sequence that leads to a ROR crash (e.g., vehicle departs lane, departure is such that an impact with a roadside object is possible, the impact conditions are such that the crash results in a certain severity). An estimate of each of these conditional probabilities was used to estimate frequency of ROR crashes. The encroachment probability model serves as the basis for the Roadside Safety Analysis Program (RSAP; Ray et al. 2012).
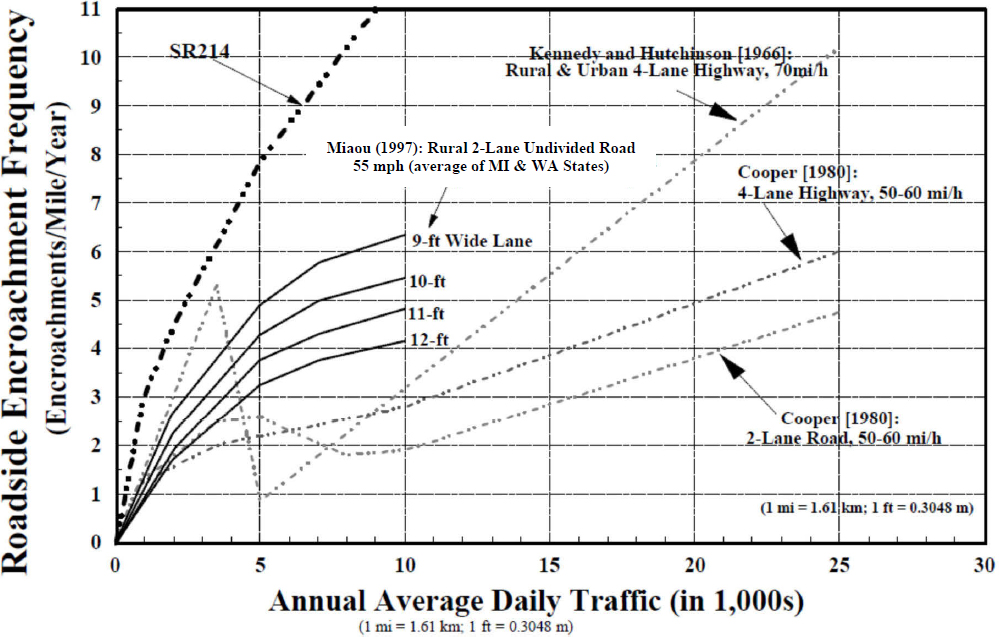
A first step toward the crash prediction model approach described above was present in Appendix F of TRB Special Report 214 (SR 214) (National Academies of Sciences, Engineering, and Medicine 1987). The authors described the development of an encroachment probability model and an attempt to validate the developed model using available police-reported crash data. The authors used a dataset of approximately 9,500 utility pole crashes collected by Zegeer and Parker (1985). The crashes were collected from 1,500 road segments, primarily rural two-lane roadways, representing 2,500 miles of roadway across four states. Ordinary least squares procedures were used in combination with log-transformations to estimate three unknown model parameters and generate a model to predict encroachment frequency based on traffic volume. Miaou (1996) pointed out the limitations of the lognormal distributional assumption used in SR 214 and an exclusion of a necessary adjustment factor. As a result, the SR 214 model provides an overestimate of encroachment frequencies, as evident in Figure 1 (Miaou 1996).
Using negative binomial regression and crash data from 596 rural two-lane undivided road sections from three states (Alabama, Michigan, and Washington), Miaou (1997) developed a model to predict ROR crash frequency. The total roadway length was 1,788 miles, and the majority of sections (530 of 596) had a posted speed limit of 55 mph. Michigan and Washington had 5 years of crash data available (1980 – 1984), while Alabama had approximately 2.5 years of data available. There was a total of 4,632 reported single-vehicle ROR crashes available for all three states. The ROR crash rate was estimated to be 0.61 single-vehicle ROR crashes per million
vehicle miles traveled (MVMT). Predictor variables included traffic volume per lane, lane width, clear roadside recovery area, shoulder width, side slope, terrain type, posted speed limit, intersections per mile, driveways per mile, and bridges per mile. Horizontal curvature and vertical grade were excluded as predictors due to missing data; approximately one quarter of sections did not have horizontal curvature data, and more than half did not have grade information.
Miaou (1997) used the developed model to estimate encroachments by setting the model parameters to match an extremely poor roadside design, that is, the shoulder width and clear recovery area were set to zero and the roadside slope was maximized (a 1:1 slope was the maximum in the model). All other variables were set to the corresponding average value, except lane width and traffic volume, which were varied. In this scenario, any encroachment onto the roadside would theoretically result in an ROR crash (see Equation 1). Equations 1 and 2 (Miaou 1997) below express this notion mathematically:
P(SV RORC|Mainline, “Extremely Bad” Rdside Design) = P(Encro|Mainline) (Equation 1)
P(SV RORC|Mainline, “Extremely Bad” Rdside Design) · V · l = P(Encro|Mainline) · V · l (Equation 2)
In Equation 2, the right-hand side is annual encroachment frequency and the left-hand side is an estimate of expected number of single-vehicle ROR crashes per year. V is traffic volume, and l is section length. The conditional probabilities, encroachment, or single-vehicle ROR crash (SV RORC) are based on a single-vehicle traveling a unit distance (e.g., 1 mile or 1 km) on the segment. Figure 1 shows the Miaou estimated encroachments as well as those observed by Hutchinson and Kennedy and Cooper, and those estimated in SR 214.
The primary assumptions Miaou used in developing this methodology are listed below:
- Probability of having more than one roadside encroachment by a vehicle is zero.
- Roadside design has a negligible effect on the probability of roadside encroachment (also an assumption of the encroachment probability model).
- Extrapolation of conditions (e.g., the extremely poor roadside design does not exist in the available crash data).
In addition to summarizing the previously described work, Miaou (2001) provided a systematic examination of the strengths and weaknesses of the encroachment probability model, potential mean functions for use in their proposed crash-based models, and further development of crash-based models for two specific hazards: guardrails and utility poles. The developed crash-based models used an expanded version of the previously used dataset. Available data included 1,944 rural two-lane undivided roadway sections sampled from seven states: Alabama, Michigan, Montana, North Carolina, Utah, Washington, and West Virginia.
For the guardrail model, road sections with guardrail miles less than 0.1 miles were excluded. There were 272 road sections (841 miles total) with 450 recorded guardrail crashes. ADT was between 160 and 10,000 vehicles per day, and most of the sections, about 90%, had a posted speed limit of 55 mph. For the utility pole model, only road sections with average pole spacing greater than 0.1 miles were included. There were 855 road sections (2,586 miles total) with approximately 20,000 utility poles and 293 total recorded utility pole crashes. The traffic volume range was identical to that of the guardrail model, and most of the sections, about 93%, had a posted speed limit of 55 mph. In general, the models for the line hazard (i.e., guardrail) were found to be viable, but the point hazard model (i.e., utility pole) was not viable, primarily due to a small proportion of utility poles located close to the roadway.
Miaou (2001) proposed a roadside encroachment model for two-lane rural roadways based on Washington state crash data using the previously described crash-based approach. Negative binomial regression was used to develop the model based on 680 road sections and crash data from 1993 to 1995. All segments used had an ADT less than 12,000 vehicles per day. Note that Miaou used the other models described above as reference models to strengthen the developed Washington model when appropriate. In the final proposed model, roadside encroachments are a function of traffic volume, a state-specific constant related to ROR crash rate on low-volume roads, lane width, horizontal curvature, vertical grade, and hazard frequency. Miaou (2001) presented a figure similar to Figure 1 that shows the results of this final model were comparable, albeit slightly higher, to those estimated in their previous work (Miaou 1996). The final model can be found in Figure A-6. in Appendix A.
Both the multiplier approach and the statistics-based crash prediction model approach have several advantages. The primary advantage of both approaches is the ability to estimate encroachments without the high cost of collecting encroachment data in the field. Both approaches require only available police-reported ROR crash data as input, which is typically widely available. While the Miaou approach uses more sophisticated negative binomial statistical modeling, models of this type are now relatively commonplace in crash analysis and are used as the basis for the predictive equations in the HSM (AASHTO 2010). Further, a comparison of the Miaou results with the findings from the two primary field collection encroachment studies seems to indicate reasonable agreement between them for lower annual average daily traffic (AADT) values.
Both methods have several limitations. In addition to the use of simple linear regression to predict crash frequency, the primary limitation of the multiplier approach was an untested assumption that the ratio of encroachments to ROR crashes was constant across different roadway types and roadway/roadside conditions, such as different speed limits and fixed object frequencies/densities. Glennon and Wilton (1974) even cautioned that the developed encroachment estimates are “order of magnitude” only and should be used only in the absence of actual encroachment data. Limitations of the Miaou approach are primarily related to the assumptions made in developing the methodology; for instance, the “extremely poor” roadside design case does not exist in the available crash data, and the hazard density needs to be assumed.
2.4.3 In-Depth Crash Study Approach
Another general method for collecting roadside encroachment data leverages in-depth ROR crash investigation data. Similar to the ROR state crash data approach, only police-reported crashes are included. This method uses typical crash reconstruction techniques to determine encroachment characteristics for a sample of ROR crashes. Encroachment characteristics generally include encroachment speed, encroachment angle, longitudinal distance, and lateral extent. While the method provides specific encroachment characteristics, an estimate of encroachment frequency was generally not possible, as the data were from disparate locations.
Glennon and Wilton (1974, 1976) reviewed collision diagrams from police crash reports to determine encroachment angles and lateral displacements of encroaching vehicles. The researchers examined a total of 67 reports from Kansas City sections and 99 reports from the available Missouri rural two-lane highway sections. Since nearly all the urban arterial ROR crashes involved a fixed object crash, the researchers used the stopping distance equation to estimate the lateral extent assuming a 45-mph vehicle travel speed and the computed encroachment angle. For the Missouri highway sections, the lateral extent was determined using only crashes that did not involve a rigid obstacle impact; a total of 47 of the 99 crashes met this criterion.
Mak and Mason (1980) investigated 1,014 single-vehicle passenger vehicle crashes involving a pole impact, primarily from Texas and Kentucky. The cases were selected using stratified random sampling from approximately 2,400 pole crashes, both reported and unreported, that occurred in the study region over a 20-month period from January 1976 to August 1977. The crashes included impacts with utility poles, breakaway and non-breakaway luminaires, and sign supports. Although the study was not specifically aimed at encroachment data collection, the researchers captured encroachment angle, departure distance, and impact speed for each investigated crash. Mak and Calcote (1983) conducted a similar study reconstructing 124 crashes on bridges. Another dataset of potential interest was the Longitudinal Barrier Special Study (LBSS) completed within NHTSA’s existing National Automotive Sampling System/Crashworthiness Data System (NASS/CDS) framework. The dataset has detailed information on more than 600 vehicle-to-barrier impacts occurring between 1982 and 1986 (Erinle et al. 1994).
One of the largest efforts to obtain detailed crash data for ROR crashes was a combination of the research conducted under three separate studies: NCHRP Project 17-11, the FHWA Rollover Study, and a follow-on NCHRP Project 17-22. All three studies used NHTSA’s existing NASS/CDS framework (Mak et al. 2010). NASS/CDS provides detailed data on a randomly selected, representative sample of tow-away level crashes, approximately 5,000 crashes per year, involving passenger cars, light trucks, vans, and utility vehicles in the United States [National Center for Statistics and Analysis (NCSA) 2015]. While NASS/CDS provides detailed vehicle,
occupant restraint, and occupant injury data, little information was captured relative to highway and roadside characteristics. All three referenced studies retrospectively collected additional roadway and roadside characteristics for each investigated case (Mak et al. 2010). All three studies also used the same sampling criteria, which is summarized in Table 3. The data collected to supplement the NASS/CDS cases was also similar across the three studies and summarized in Table 4. Note that the supplemental information includes additional data collected from the scene—that is, not originally captured by NASS investigators—information gleaned from a manual review of the NASS/CDS case data, and information synthesized through reconstruction of the crash. Except for vehicle impact speed reconstruction, all supplemental data collection, manual case review, and reconstruction tasks were completed by NASS zone center personnel in a 12-month period.
| Attribute | Criterion | Comments |
|---|---|---|
| Land Use | Rural and suburban only | Urban crashes excluded due to less detailed inspections/higher percentage of incomplete data. |
| Crash Type | Single-vehicle ROR crashes only | Multiple vehicle crashes and crashes involving parked vehicles, animals, or pedestrians excluded. |
| Vehicle Type | Passenger vehicles only (gross vehicle weight < 10,000 lbs) | A NASS/CDS case selection criterion. |
| Posted Speed Limit | 45 mph or higher | Lower speed roads typically have lower design standards and significantly different crash characteristics than higher speed roads. |
| Data Availability | Complete vehicle inspection, vehicle trajectory, and occupant injury data available | Crash reconstruction is not possible if the vehicle inspection and trajectory data are not available. Study emphasis was on serious and fatal crashes, so injury severity must be known. |
The NCHRP 17-22 effort collected 388 new in-depth crash cases and combined these with the data previously collected under NCHRP 17-11 and the FHWA Rollover Study for a total of 890 cases. This dataset currently serves as the basis for determining roadside encroachment trajectories in the crash prediction module for RSAP (Ray et al. 2012). The NCHRP 17-22 researchers also developed and pilot tested a plan for a future long-term roadside data collection system within the NASS/CDS framework. The researchers noted that the retrospective supplemental field collection approach was no longer viable within the NASS/CDS framework, as NHTSA’s policy had recently changed such that police crash reports are only kept for 1 year.
| Collection Method | Category | Data Element |
|---|---|---|
| Supplemental Field Collection | General Highway | Functional classification |
| Number of lanes | ||
| Lane width | ||
| Horizontal curvature (point of departure and maximum) | ||
| Vertical grade (point of departure and maximum) | ||
| Roadside | Shoulder type/width | |
| Roadside slopes – widths and slope rate | ||
| Median type, width, and slope | ||
| Traffic Characteristics | ADT | |
| Percent trucks | ||
| Struck Object | Object type | |
| Impact performance | ||
| Manual Case Review/Reconstruction | Encroachment Conditions | Speed |
| Departure angle | ||
| Vehicle heading angle | ||
| Pre-Impact Vehicle Trajectory | Vehicle path | |
| Maximum lateral extent of encroachment | ||
| Total longitudinal distance | ||
| Impact Conditions (first and most harmful events) | Impact speed | |
| Impact angle | ||
| Vehicle heading angle at impact | ||
| Separation Conditions | Location of separation | |
| Separation angle | ||
| Vehicle heading angle at separation | ||
| Post Impact/Final Rest | Post-impact vehicle trajectory | |
| Final rest location | ||
| Vehicle heading angle at final rest | ||
| Driver Action | Steering – vehicle path | |
| Braking |
As a follow-on to the work of NCHRP Project 17-22, NCHRP Project 17-43 (Gabler et al. 2012) was tasked with supplementing the existing NCHRP 17-22 database with more recent crash cases, demonstrating possible analyses that can be conducted with the data, developing improved barrier length-of-need procedures, and making recommendations for the ongoing collection of detailed roadside crash data. Like with NCHRP 17-22, the data collected under NCHRP 17-43 leveraged NHTSA’s existing NASS/CDS framework and collected supplemental roadway and roadside data elements. The research team collected supplemental data by manually extracting roadside data elements from available NASS/CDS scene diagrams and photographs. The data elements collected were similar to those collected under NCHRP 17-22, but there were some additions based on a systematic comparison of the NCHRP 17-22 data elements to other existing database elements, a list of roadside safety data needs, and interviews with roadside safety researchers. A listing of the
NCHRP 17-43 data elements that were not originally collected under NCHRP 17-22 are shown in Table 5. The NCHRP 17-43 database contains 1,581 road departure crashes extracted from NASS/CDS, with full reconstructions and trajectories. The dataset is primarily comprised of NASS/CDS cases from 2011 to 2015. In contrast, NCHRP 17-22 includes cases from 1997 to 2000, with a small number of cases from 2004. An effort analogous to that conducted under NCHRP 17-22 and the ongoing NCHRP 17-43 has been conducted in Europe under the Roadside Infrastructure for Safer European Roads (RISER) Project (Naing and Hill 2004). The RISER project examined single-vehicle police-reported crashes from seven countries (Austria, Finland, France, Spain, Sweden, Netherlands, and United Kingdom) and provided details on the development of a detailed single-vehicle crash database. The detailed database includes 211 crashes, with at least 10 crashes from each of the seven participating countries (Thomson et al. 2006). Crashes in the database generally occurred over a 5-year period starting in 1999. The case selection criteria for the RISER detailed database are summarized in Table 6 and are approximately the same as the criteria used for the analogous U.S. in-depth databases already discussed. One notable difference is the inclusion of all vehicle types (although there was a noted focus on passenger cars), whereas the U.S. datasets focus on passenger vehicles (e.g., cars, light trucks, and sport utility vehicles). Similar to the U.S. in-depth datasets, additional data collection was required in the RISER project to obtain specific highway information, impacted infrastructure information, and crash causation details to supplement the available vehicle and occupant injury information.
Table 5. NCHRP 17-43 Supplemental Data Elements Not Included in NCHRP 17-22 (Gabler et al. 2012)
| Data Table | Data Element |
|---|---|
| Road | Roadway type (divided/undivided) |
| Crash location (latitude/longitude) | |
| Median width | |
| Presence of intersection | |
| Work zone area? | |
| Roadside | Rumble strip presence |
| Clear area width | |
| Curb face slope | |
| Barrier flare dimensions and relation to travel way/nearest object | |
| Roadside soil condition | |
| Object at end of last slope? | |
| Trajectory | Relation to horizontal curve (inside/outside) |
| Longitudinal offset to trajectory profile | |
| Metal Barrier/Bridge Rail/Concrete Barrier | Barrier type and location |
| Shielded hazard | |
| Non-tracking impact (end terminal impact only) | |
| Impact location (with respect to end terminals) | |
| Point of initial contact (if within 10 meters of the end terminal) | |
| Pre-existing barrier condition | |
| Rail rupture?/distance to rail rupture location (if not splice) | |
| Post type and embedment material |
| Data Table | Data Element |
|---|---|
| Blockout type and dimensions (width/depth) | |
| Rail type/dimensions | |
| Number of rail elements/height to each rail (metal only) | |
| Width of rail face parallel to posts (metal only) | |
| Length of direct and total damage to barrier (metal only) | |
| Maximum barrier deflection (metal only) | |
| Barrier failure mechanism | |
| Barrier shape, height, and top width (concrete and bridge rails only) | |
| Barrier section length (concrete only) | |
| Temporary barrier? (concrete only) | |
| Poles/Trees Poles/Trees |
Lateral offset/location |
| Breakaway?/breakaway type Object performance | |
| Pre-existing condition of object | |
| Pole spacing | |
| Sign support/tree configuration | |
| Crash Cushion | Location/lateral offset |
| Width at nose and base | |
| Shielded hazard/width | |
| Pre-existing condition of object | |
| Crash cushion performance | |
| Impact location | |
| Deformed length | |
| Embankments | Embankment location |
| Lateral offset to toe from edge of travel way | |
| Length along surface of embankment | |
| Embankment height and slope | |
| Pre-existing condition | |
| Object performance |
Table 6. Summary of RISER Detailed Database Sampling Criteria (Naing and Hill 2004)
| Attribute | Criterion | Comments |
|---|---|---|
| Roadway Type | Major arterial roadways | No minor rural roads or urban roads were selected. |
| Crash Type | Single-vehicle ROR crashes involving objects (all crash severities) | Multiple vehicle crashes and crashes involving pedestrians were excluded. Applicable objects impacted include longitudinal barrier (all types), crash cushion, signs/poles, embankments, trees, and bridge piers. Rollovers could be included if initiated off the traveled way. |
| Attribute | Criterion | Comments |
|---|---|---|
| Vehicle Type | All production vehicle applicable | Despite no limitation on vehicle type, it was noted that the focus was on passenger cars. |
| Data Availability | Detailed roadside infrastructure data and complete vehicle damage and occupant injury data available | Crash reconstruction was not possible if vehicle damage data was not available. Preferable that occupant seat belt status be known (at least for the driver). |
The primary advantage of the in-depth crash approach is the provision of detailed encroachment condition data, including vehicle speed and angle. A primary limitation of this method is that the available trajectories are for instances where a crash, and in most cases a tow-away-level crash, has occurred. While valid for this subset of encroachments, the trajectories may not be representative of encroachment trajectories for unreported crashes or encroachments not resulting in a collision. Encroachment rate determination was also not possible using this methodology. For the retrospective method of supplementary data collection used in the NCHRP 17-11, FHWA Rollover, NCHRP 17-22, and NCHRP 17-43 studies, there was an implicit assumption that the collected supplementary information would remain the same between the initial site visit and the secondary site visit to obtain the supplementary information. While this was likely a reasonable assumption for highway geometric characteristics and some roadside design features (provided no construction activities occurred in the interim), actual crash evidence (e.g., vehicle skid marks, damaged roadside hardware) would no longer be present, and thus researchers must glean information from available crash scene photographs.
2.5 Potential Methods for Encroachment Data Collection
This section summarizes several potential methods for the collection of encroachment data. It should be noted that roadside safety researchers investigated numerous methods for improved collection of encroachment data in the 1960s and 1970s. However, many of these experimental methods, while innovative, were hampered by limits to the technology or computational methods available at that time. These early experiments are summarized in Appendix A. The discussion that follows considers potential methods based on current and near-future technologies for enhanced collection of encroachment data.
2.5.1 Naturalistic Driving Study (NDS) Methods
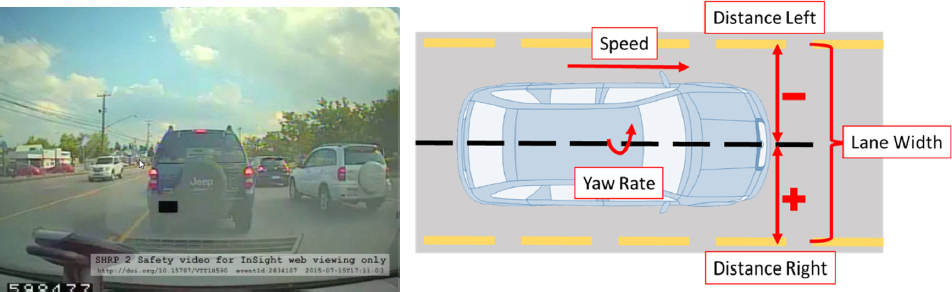
This method uses available naturalistic driving study (NDS) data to detect and estimate encroachment characteristics. As shown in Figure 2, private vehicles are equipped with cameras, radars, and other sensors that collect detailed driving data for a set number of participants. The most notable NDS study was conducted under the Second Strategic Highway Research Program (SHRP 2).
The SHRP 2 NDS was a recent NDS led by the Transportation Research Board (TRB) of the National Academies of Science. In SHRP 2, over 3,300 private vehicles were equipped with cameras, radars, and other sensors to collect over 3 years of data, including a total of 6,650,519 trips and nearly 50 million miles of driving. Our previous research has indicated that the SHRP 2 NDS has captured a substantial number of roadside encroachments, with the vast majority being non-collision encroachments. These data can provide a source of non-collision encroachments and
collisions across the range of severities from unreported collisions (e.g., minor sideswipes of guardrail) to serious crashes into roadside hazards.
The research team has examined the characteristics of road and lane departures in three NDS databases: SHRP 2, 100-Car, and the Integrated Vehicle-Based Safety Systems (IVBSS) NDS. Johnson et al. (2016a) identified 12,760 unintentional drift-out-of-lane departure events (most were minor) in the IVBSS and found that the frequency of road departures was highly dependent on the radius of curvature. Lane width was not a significant factor; however, most miles traveled in this study were on freeways in which there was little variation in lane width. Johnson et al. (2016b) found similar results from an analysis of the 100-Car NDS. Kusano and Gabler (2013) examined a dataset comprised of 32 encroachments from the 100-Car NDS. In each of these events, a vehicle left the lane, either onto the roadside or into opposite lanes, and the driver had to make an emergency maneuver to steer the vehicle back to the road. Driver responses to recover from the encroachments were examined by video analysis of the driver. Bareiss et al. (2015) has developed a methodology for automated detection of encroachments from analysis of NDS external camera video.
Hallmark et al. (2012) collected NDS data from 11 vehicles and used these data to determine the number of right-side and left-side lane departures for the purpose of developing a logistic regression model to predict lane departure presence based on driver and roadway characteristics. A total of 51 left-side and 22 right-side lane departures were found in the available NDS data. Note that these lane departures include encroachments onto the roadside, median, and other adjacent lanes. The report was not clear on exactly how the researchers identified the encroachments, but an encroachment was defined as the vehicle wheel path crossing the lane line by 1 meter or more. As the focus of the study was not on encroachment characteristics or frequency, no details in this regard were presented in the available report.
The primary advantage to the NDS approach is the ability to provide encroachment rate and detailed information for each encroachment, including angle, speed, and maximum lateral and longitudinal encroachment extent. Another advantage over the other methods discussed is the ability to capture very shallow encroachments, such as those not extending beyond a paved shoulder. A difference with previous attempts to collect encroachment data is that NDS data are collected on a per-vehicle basis instead of on a per-roadway section basis.
2.5.2 Event Data Recorder (EDR) Data
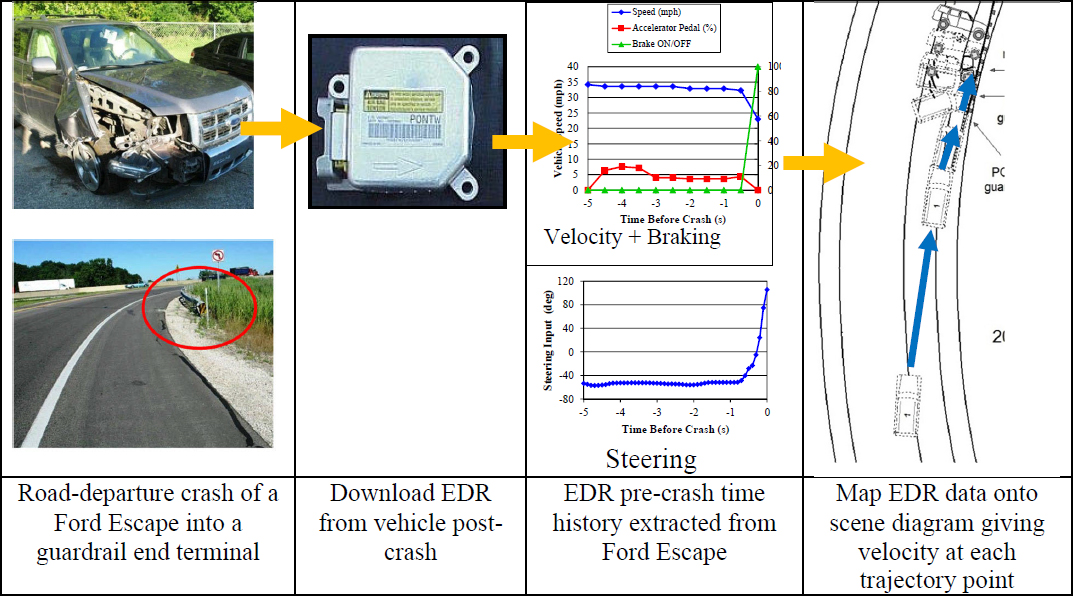
Virginia Tech has developed a unique dataset of over 11,000 EDR downloads from NASS/CDS cases. An EDR in a vehicle can provide a comprehensive snapshot of the entire crash event—precrash, crash, and post-crash events, including vehicle speed, brake status, and engine throttle position. As illustrated in Figure 3, the research team has developed a novel method to map the pre-crash EDR data onto crash scene diagrams available from field investigators (Riexinger et al. 2018), which can be used to obtain a detailed record of vehicle velocity and driver crash avoidance actions throughout an encroachment. The research team has applied these methods to a subset of encroachments to examine road departure impact conditions (Riexinger and Gabler 2019) and evasive maneuvers taken by drivers attempting to avoid a crash following an encroachment (Riexinger and Gabler 2018).
2.5.3 Google Street View Based Methods
This method examines publicly available street-level photographs (from sources like Google Street View) to detect encroachments along a specified roadway section. Available photogrammetric software could be used to estimate the encroachment characteristics, most notably encroachment angle.
Roque and Cardoso (2016) used publicly available omnidirectional imaging (i.e., Google Street View) to identify and estimate characteristics of encroachments on seven motorways, primarily rural, across Portugal. The methodology consisted of two basic steps: (1) visual examination of the available aerial and street view images along a selected roadway segment and (2) estimation of encroachment characteristics through available photogrammetric software. The visual examination of the route was accomplished using available self-advancing web tools that automatically advance through the Google Street View images along a specified route. When
researchers observed evidence of an encroachment (the authors specifically note skid marks on paved shoulders), they would pause the automatic advancing and manually capture an image of the encroachment. For the second step, the researchers used the Georeferencer plugin to the Quantum GIS software to make scaled measurements of observed tire skid marks, including the encroachment angle, length, and track width. Ground control points with known distances between them are required to properly scale the available images. The researchers recommended a minimum of five of these points and suggested using known distances such as lane widths, spaces between dashed lane lines (standardized in Portugal), and guardrail posts. Based on the tested roadway segments, the researchers noted that approximately one encroachment skid mark was detected every 10 to 15 minutes. The researchers collected data from June to September 2014, although the images used in the study were generally from 2009. All roadway segments had full access control, at least two lanes, and paved shoulders. The maximum left shoulder and right shoulder width was noted as 2.5 and 4.0 meters, respectively. A total of 29 skid marks were collected using the developed framework (Roque and Cardoso 2016).
The primary advantage of this approach is the ability to collect encroachment data from a range of roadway sections using readily available imagery and photogrammetric techniques. While the researchers demonstrated that this approach can be used to measure encroachment angle, the methodology appears limited to roadways with paved shoulders and may not accurately estimate other typical encroachment parameters such as maximum lateral extent and longitudinal distance (Roque and Cardoso 2016). The method is also limited, to some extent, by the frequency at which Google Street View images are acquired, as encroachment evidence is often fleeting. Other limitations noted by the researchers were related to encroachment angle measurement accuracy. Google Street View images are often a combination of several images, which causes issues with scaling and obtaining accurate measurements. The researchers noted that encroachment data were only collected in instances where the observed skid marks and relevant ground control points were in the same image. In addition, skid marks that suggested high yaw rotational speeds and trajectories were discarded from the dataset. The researchers did not note the total number of discarded observations for either reason (Roque and Cardoso 2016).
2.5.4 Orthoimagery-Based Methods
Previous methods of developing vehicle road departure trajectories included tracing vehicle tire tracks left in highway medians (Hutchinson and Kennedy 1966). This method could be updated for future use by using orthoimagery of the ground to locate tracks in the soil/snow from above. Orthoimagery (sometimes called orthorectified imagery) refers to any type of ground imagery that corrects for camera and lens effects to present an idealized view of the ground from a position directly above the ground aligned with a known coordinate system. The size and location of visual features in orthoimagery can be directly related to physical measurements on the Earth. Using orthoimagery improves upon the method in Hutchinson and Kennedy (1966) by making a larger study area available than what could be captured from the ground. Capturing aerial imagery using an unmanned aerial vehicle (UAV) or traditional plane is capable of producing images at high resolution and with a flexible time schedule. Satellite imagery has the potential to consider a significant portion of the United States with limitations in resolution and time of acquisition. Both methods would benefit from recent advances in computer vision, which would considerably reduce the amount of time and expense required to conduct the study compared to manually locating tire tracks in images.
Aerial Imaging Methods
Aerial imaging methods capture orthoimagery using airborne cameras that are not in space, such as on aircraft, helicopters, or UAVs. Some systems that collect aerial orthoimagery offer approximately 7.5 cm pixel resolution (Nearmap n.d.). UAV-based systems vary in resolution depending on the UAV flying height and camera equipment, with some work citing a 1.6 cm pixel resolution (Liu et al. 2018). One limitation is that aerial imagery is not normally collected on snowy days or days with heavy cloud cover. However, data collection from a low-flying UAV may be possible in these conditions. The relevance of this technology will be highly dependent upon the frequency with which aerial images are collected: tire tracks in snow- or grass-covered roadsides have a very limited lifetime. Encroachments onto pavement would, of course, not be possible to collect.
Although still in the research domain, aerial photography is beginning to make inroads into traffic engineering on a pilot basis. This technique has been used to determine real-time traffic parameters including level-of-service (LOS) and AADT (Angel et al. 2003; Coifman et al. 2006). Much of the technology required to conduct an aerial imagery-based road departure study is currently available. The goal of this study design would be to recreate the Hutchinson and Kennedy (1966) study methodology of examining tracks in the soil/snow but acquire the tracks using a UAV. Overcoming regulatory hurdles related to large-scale research UAV usage and designing and validating a study are the largest obstacles to completing a study of this design. Flying large UAVs necessary to perform a study of this nature requires a significant investment in the cost of the UAV and a license from the FAA (“Getting Started” n.d.). It may be possible to begin an aerial imagery-based road departure study in 2 to 5 years.
Satellite Imaging Methods
Satellite imaging methods capture orthoimagery using cameras located in space on satellites. The goal of a satellite imagery-based study would be to capture satellite imagery of an area of the United States in clear weather. One hypothesis was that tire tracks from an ROR departure would be better determined immediately after a snowstorm. However, this hypothesis would need to be confirmed in a pilot study using satellite imagery. Then, road departures in snow tracks would be detected and analyzed similarly to the Hutchinson and Kennedy (1966) study. Early satellite imagery was frequently conducted for intelligence gathering purposes. A large amount of satellite imagery was collected and made publicly available in the United States as a part of the National Map (“Components of NGP” n.d.). The National Map has a maximum resolution of 1 meter. Some states have more accurate data collection. For example, New York State supplies orthoimagery with a 15 cm (0.5 foot) pixel resolution (“NYS High Resolution Data Set Description” n.d.). In the future, other states may follow New York’s lead and begin to pursue higher resolution orthoimagery that may be suitable for collecting encroachments.
Like aerial imagery, relevance of this technology will be highly dependent upon the frequency with which satellite images are collected. Evidence of off-road trajectories can disappear rapidly. Imaging satellites are typically in sun-synchronous orbits, which visit a given location on the Earth once per day around noon in the local time zone. Satellites may not be capturing images continuously, and the ability to schedule a capture on short notice (after a snowstorm) may be limited. Decreasing costs in launching satellites and advancements in data processing and satellite design may make a satellite-based road departure study possible in 5 to 10 years. As a clear view of the ground was typically the goal of capturing satellite imagery, it may be expensive to request imagery at an atypical time.
Processing Methods
Recent advancements in computer vision potentially allow automatic marking of off-road tire tracks in imagery. Deep learning methods have been shown to have excellent performance in the task of semantic segmentation (Längkvist et al. 2016). Semantic segmentation is the task of assigning a class label (grass, dirt, roadway, etc.) to each pixel in an image. Semantic segmentation requires a training dataset of labeled images. For the tire track detection problem, this dataset would be manually labeled. However, once a semantic segmentation algorithm is trained, it can be used for an unlimited amount of satellite imagery. Automated evaluation by the semantic segmentation algorithm on an area of land can be completed more quickly than manual labeling. The technology to implement modern processing methods was mature enough for a research study, and 2 to 5 years would be needed in conjunction with an aerial- or satellite-based study to validate the usage of modern deep learning methods to detect road departure tire tracks.
2.5.5 Stationary Video Cameras
One method for characterizing road departure encroachments or trajectories is via video cameras installed at fixed locations. Video cameras can be mounted to poles along the roadway to observe traffic flow. The high position of the camera gives a clear view of a larger length of roadway. To identify possible encroachments, the post-processing must be capable of identifying both the road edge and the trajectory of each vehicle. Previous studies, such as the Next Generation SIMulation (NGSIM) project, have used stationary cameras to record highway traffic and determine vehicle trajectories in a few select areas (Halkias and Colyar 2016).
One major benefit of using stationary video footage is that many roadside cameras already exist through the 511 program. The 511 program is present in all but 11 U.S. states and aims to provide live traffic information that includes video footage (“FHWA 511 Travel Information Telephone Services” n.d.). For example, in Pennsylvania there are over 700 cameras already deployed. The video footage from 511 programs is free for public use. For research, a short application is required to use the video streams, but there is no associated charge (“Developer Resources” n.d.). However, the 511 traffic camera system is limited to major roadways with high traffic volumes. Smaller roads, low-speed roads, and rural highways would need to be instrumented to capture a variety of encroachment types. The 511 systems only stream the video footage, which means that a system would need to be developed to “watch” all the video streams and save clips with a road departure for later analysis. A challenge to this method is the wide range of video quality and frame rate across the available cameras. At least one researcher has recently collected and stored 511 footage across Virginia (Bareiss 2023). A study using live 511 traffic cameras would be possible in the next 2 to 5 years.
Collection of encroachment data would require development of methods to extract encroachment frequency and trajectories after traversing the road edge. Two possible methods for identifying the road edge for stationary cameras are road segmentation detection and feature driven detection (Kastrinaki et al. 2003). Road segment detection utilizes machine learning algorithms to detect differences in color and texture between the road and the roadside. Feature driven detection typically uses machine learning algorithms to detect intensity discontinuities such as lane lines. These features are aggregated together to identify the road edge. Then, the vehicle encroachment trajectory can be extracted from the video. The position of objects in 3D space can be inferred based on the relative size of each object (e.g., a closer object appears larger). Using both the 2D projection and temporal information from the video with a Kalman filter, previous studies have estimated vehicle trajectories from stationary cameras (Schick and Dickmanns 1991).
2.5.6 Infrastructure-Based Instrumentation
This section explores other potential infrastructure-based methods for determining frequency of road departure and/or data on the trajectory of road departures.
Guardrail Impact Monitors
Michie and Bronstad (1994) estimated that approximately 90% of guardrail impacts are unreported. To better understand and document these road departure crashes, accelerometers with associated communications ability could be attached to guardrails or guardrail end terminals. The sensors could record the frequency, location, and severity of any impacts. Calcote et al. (1985) installed six prototype Guardrail Encroachment Monitor (GEM) units at rural Texas locations in 1979. The concept did not experience widespread use, but the Calcote system may have simply been before its time. Recent advances in low-power microcontrollers, solid-state accelerometers, and wireless communication may mean these devices are now feasible. A major constraint would be device cost, and the population of installed devices would need to collect sufficient encroachment data.
The technology for guardrail impact monitors already exists. The challenge in using this method is designing a detector that is both accurate and low cost. These devices must be cost efficient because they need to be installed on as many guardrails as possible, and they would have to be replaced after one catastrophic hit. In addition, the device would have to be validated with different barrier types, vehicle types, speeds, and impact locations. We do not expect this method to be feasible at a production scale for at least 5 years.
Pneumatic Road Tube Arrays
Pneumatic road tubes are commonly used to determine vehicle traffic counts and speed on a road (Vehicle Detector Clearinghouse 2007). A pneumatic road tube is an air-filled tube generally placed across the road perpendicular to the direction of travel. When a vehicle crosses the tube, embedded sensors can detect the resulting pulse of air that indicates the traversal of a vehicle. To calculate the speed of a vehicle, two pneumatic road tubes are placed parallel to each other at a set distance. Each tube records when the vehicle crosses it, allowing a travel speed to be calculated (Fitzsimmons et al. 2013; Vehicle Detector Clearinghouse 2007). In an alternate configuration, these tubes could potentially record when a vehicle departs the road and its lateral speed at that time. To record road departures, the tubes would be aligned parallel to the direction of travel. Using two tubes in tandem aligned with the direction of travel, the tube could collect departure and lateral velocity. The departure angle and the distance departed would be unknown, but, as with the other infrastructure-based methods, this method would provide information on the incidence of encroachments. A major constraint would be the cost of long lengths of pneumatic road tubes needed to collect sufficient encroachment data, although this technology may be suitable on a pilot basis in areas of high encroachment frequency. To our knowledge, this concept has not yet been tested either in the laboratory or in the field.
Pneumatic road tubes are already commercially available. As this method uses pneumatic road tubes and has not been validated previously, validation would be required to show that the tubes are accurate for this purpose. The pneumatic road tubes would need to be tested with different severities of road departure, such as partial road departure or total road departure, vehicle types, vehicle speeds, and road curvatures. We expect that validation could take about 2 years. Signal processing time could be affected if there are synchronization issues between the pneumatic tubes. Shorter pneumatic road tubes would be preferred for this method, as they would provide higher
spatial resolution. If these were to be developed, the potential time until this method could be used would increase to an expected 5 years.
Rumble Strip Sensor Arrays
Rumble strips have been shown to be effective at reducing road departure crashes (FHWA 2015). When a vehicle traverses a rumble strip, the tire emits a characteristic rumbling sound. In concept, microphone arrays could be placed near rumble strips to record road departures (HDR Engineering, Inc. 2014). In addition, there may be an opportunity to estimate the speed at which the vehicle was traveling based on the frequency content of the sound emitted by the tire. This would result in valuable information on low severity road departures and the speeds at which they occur. To our knowledge, this concept has not yet been tested either in the laboratory or in the field. As with the previous infrastructure-based sensors, a major constraint would be the cost of the sensors and the population needed to collect sufficient encroachment data. However, this technology may be suitable on a pilot basis in areas of high encroachment frequency.
The technology needed for rumble strip sensor arrays already exists. The challenge is developing a microphone array that can cover a large area accurately, withstand different weather conditions, and that is cost effective. Signal processing could present some challenges, which would extend the time needed for validation. The device would have to be validated with different rumble strip types, vehicle types, speeds, weather conditions, and ambient noise. We do not expect this method to be feasible at a production scale for at least 5 years. Even then, we expect that site-specific professional installation would be required.
2.5.7 Vehicle-Based Methods
Many late-model vehicles are now equipped with a suite of technologies capable of collecting detailed measurements of the location of the vehicle with respect to the road edge when the vehicle is in operation. The data collected by these vehicle-based sensor suites could be used to characterize road edge encroachments and roadway departure trajectories. Although the raw data for these systems are not currently available for download, future government regulations (e.g., 49 CFR Part 563 for EDRs) may require these data to be publicly available.
Machine Vision and Lane Marking Identification Methods
Vehicle-based machine vision will increasingly be a key technology for the automotive industry, and this technology can be used to identify and characterize road edge encroachments (Kastrinaki et al. 2003). From a vehicle perspective, machine vision is primarily used to detect objects, among which lane markings are included. NDS such as SHRP 2 have retrofitted vehicles with lane-tracking cameras and onboard machine vision to monitor for road departures. This technology is the basis for lane keeping support systems. Many late model vehicles now offer lane departure warning systems, either as a standard or optional feature, that rely on factory-installed lane-tracking cameras to warn drivers of potential encroachments (Shaout et al. 2011). Many automakers record and store the machine vision data collected by their vehicles. One example of the data collected by advanced driver assistance systems can be seen in the NTSB report of the Tesla Model S crash that occurred in May 2016 (NTSB 2017). However, Tesla has maintained that the databases on their vehicles’ driver assist performance are proprietary. To date, these data are not publicly available.
To study road edge encroachments, data collected by a vehicle equipped with machine vision capable of capturing lane markings—but without the lane keeping warning system activated—could be examined to identify points at which the vehicle crossed a lane marker. In addition to
knowing that an encroachment has occurred, these machine vision algorithms have increasingly accurate measures of distance, so the extent of encroachment would also be readily available from this type of data. If automakers like Tesla were to make their data publicly available, validation in a controlled laboratory environment and in the field would require approximately 2 years.
In addition to collecting data on encroachments performed by a subject vehicle, there is also a possibility to use an equipped vehicle’s machine vision data to identify encroachments made by other nearby vehicles. An equipped vehicle can capture lane markings within a specific bounded area around itself and detect any other surrounding vehicles, usually via radar and/or camera data. These two data points, lane marking and other vehicle position, when looked at together, can determine if the other, non-equipped vehicle is encroaching on the road edge. The data needed for this type of methodology exist today, but, as previously mentioned, it can be challenging to obtain a large enough dataset (preferably publicly available) from these types of equipped vehicle systems to draw meaningful conclusions.
If machine vison data become available, they could also be used to study differences in encroachment characteristics between vehicles with and without lane keeping warning systems. One would expect vehicles with these systems present and enabled would have very different encroachment characteristics than vehicles without these systems present or enabled. If the proportion of vehicles with these systems as standard equipment is large enough, this could potentially have a large influence on the encroachment characteristics of the vehicle fleet.
GPS Methods
Vehicle GPS data (i.e., latitude and longitude) may also offer an avenue to identify road edge encroachments. If GPS data are recorded by a vehicle with sufficiently high resolution, it may become feasible to determine the location of a vehicle with respect to the roadway edge and establish whether a lane or roadway departure has occurred (Wang et al. 2005). Currently, GPS in consumer devices has a resolution of approximately 10 meters, which would rarely be sufficient to detect encroachments. However, GPS resolution is expected to improve with the introduction of GPS Block III satellites, which are projected to be in full operation by mid-2023. Studies have shown real-time object positioning within centimeters to be possible (Chen et al. 2016; FHWA n.d.), which may be used to track precise vehicle location. Additionally, because roads are static, long-term GPS measurements are possible at the millimeter level. When this accuracy is more widely achieved, which is likely within the next 4 to 6 years, researchers will be able to compare vehicle GPS data to roadway position mapping to identify road edge encroachments.
2.6 Available Encroachment Data Sources
2.6.1 Passenger Car Encroachment Data
Table 7 summarizes encroachment data found in the available published literature. Data are organized chronologically, and the author(s) and year of each study are noted to provide a link with the associated citation in the reference list. For each study, we have indicated the general type of data collection method and where the data were collected, the specific route (or applicable route type for studies observing many roadway sections), the total number of encroachments (or crashes), encroachment rate, and traffic volume or traffic volume range. Note that the in-depth study methodology was excluded from this table, as this methodology does not permit an estimate of encroachment rate. The encroachment rates were computed using the published information and
the equation shown below (Equation 3). The rates shown represent encroachment frequency per MVMT.
| (Equation 3) |
While most of the data shown are passenger vehicle encroachments, some heavy vehicle encroachments are likely present. The Hutchinson and Kennedy (1966) and Cooper (1980, 1981) studies specifically mentioned differentiating between passenger vehicle and heavy truck encroachments; however, the available data were not sufficient to compute separate passenger vehicle and heavy vehicle encroachment rates. As an example, the Hutchinson and Kennedy data for Route 74 indicated approximately 15% of the 302 encroachments were trucks, but the percentage of trucks in the traffic stream was not reported for Route 74, so the computation of a separate rate for passenger vehicles and heavy trucks was not possible. For the expressways in the Hutchinson and Kennedy study, the percentage of trucks in the traffic stream was indicated, but only a total number of encroachments was reported with no indication of how many were heavy vehicles. For the Cooper study, the published reports provide only summaries of the collected data, and the research team has been unable to obtain a copy of the entire original study dataset. In addition, due to the data collection methodology, other studies listed may include heavy vehicle impacts. As an example, the studies that are based on examining barrier damage are not able to distinguish between passenger vehicle and heavy truck impacts, so both are likely included.
Excluding the studies relying solely on police-reported crash data, a total of 3,903 encroachments have been collected. The encroachment rate varies from a low of 0.47 to a high of 18.9 encroachments per MVMT. Traffic volume on the routes varied from 1,000 to 161,000 vehicles per day, but the majority of the collected encroachments (approximately two thirds) were on roadways with traffic volumes of 40,000 vehicles per day or less. The most recent data used to determine encroachment rate are from 20 years ago, and the vast majority of the studies presented in Table 7 are more than 30 years old.
Table 8 summarizes the reported encroachment characteristics. Most studies we found captured one or more of the following encroachment characteristics: maximum lateral extent, longitudinal distance traveled, and encroachment angle. We have excluded study methodologies that limit encroachment data collection to encroachment rate only from the table, as none of these characteristics were available for those studies. The Mak and Mason (1980), Mak and Calcote (1983), and LBSS (Erinle et al. 1994) datasets have also been excluded from Table 8 because they all had a relatively narrow focus on specific ROR crash types and did not include all types of ROR crashes.
A total of approximately 2,300 true encroachment trajectories were available, with the remainder of the encroachment characteristics based on data from nearly 8,200 ROR crashes. Considering all available data, the average encroachment angle ranged from 5.3 degrees to as high as 22.3 degrees. The average lateral extent of encroachment varied from 15.5 to 23 feet for the field collection studies available and from 2.4 to 30.5 feet for the crash-based studies available. The average longitudinal distance varied from approximately 300 to 500 feet for the field collection studies and from approximately 100 to 150 feet for the crash-based studies. As expected, the field collection method average lateral and longitudinal distances were larger than those reported by the crash-based studies. Note that in some cases the lateral extent was limited by the roadway geometry; for
example, median width in the Hutchinson and Kennedy (1966) study was 40 feet, so the highest lateral extent value recorded was 40 feet.
Table 7. Summary of Encroachment Data and Reported Rates from Previously Published Studies
| Study (Date) | Collection Method | Data Collection Location/Year(s) | Route or Route Type | Total Encroachments (or Crashes) | Encroachment Rate (per MVMT) | Traffic Volume (1,000s vpd) | Comments |
|---|---|---|---|---|---|---|---|
| Hutchinson and Kennedy (1966) | Field Collection | IL, 1960 -1964 | Route 74 | 302 | 0.47 - 5.61 | 2 to 6 | Median encroachments only, includes passenger cars and trucks. Exact traffic volume for Route 57 not reported, so the maximum value of 2,000 vpd was used to compute rate. |
| IL, 1957 - 1960 | Kingery Expressway | 30 | 1.07 -1.23 | 17.8 to 31.5 | |||
| Calumet Expressway | 183 | 0.58 | 9.5 to 26.7 | ||||
| Edens Expressway | 84 | 0.61 | 23 to 41 | ||||
| IL, 1962 - 1964 | Route 57 | 26 | 1.03 | < 2 | |||
| Moskowitz and Schaefer (1961) | Maintenance | CA, 1960 | Santa Ana Freeway | 60 | 0.55 | Hutchinson and Kennedy (1966) used these data to estimate encroachment rate. Median encroachments only. | |
| Nimitiz Freeway | 91 | 0.68 | 90 to 100 | ||||
| Galati (1967) | Photographic/Maintenance | PA, 1964 - 1965 | Interstate 76 (Phila County) | 693 | 1.95 | 130 | Median encroachments only and based on visual barrier damage. |
| Interstate 76 (King of Prussia) | 392 | 2.05 | 42 | ||||
| Glennon and Wilton (1974, 1976) | ROR State Crash Data | MO, 1971-1973 | Rural Multi- Lane Divided Highways | 422 total sections (Total # of crashes not reported) | 1.62 | 1.7 to 40 | All encroachments. Estimated assuming a constant ratio between encroachments and crashes (used Hutchinson and Kennedy encroachments and observed rural freeway crashes to compute ratio). |
| Rural 2-Lane Highways (≥ 36' wide) | 2.03 | 1.9 to 7 | |||||
| Rural 2-Lane Highways (< 36' wide) | 3.32 | 1 to 6 | |||||
| Kansas City, 1972-1973 | Urban Arterials | (374) | 3.64 | 1 to 27.5 | |||
| De Leuw Cather (1978) | Field Collection | Canada (5 Provinces), 1978 | Hwy #23 & #9 (Max) | 83 | 4.33 | 2.6 | Roadside encroachments only. 59 total roadway sections. Max encroachment rate from London, ON; Min from Moncton, NB |
| Hwy #2 (Min) | 6 | 0.19 | 5.6 | ||||
| All Routes (Average) | 1937 | 1.1 | 1.2 to 23 |
| Study (Date) | Collection Method | Data Collection Location/Year(s) | Route or Route Type | Total Encroachments (or Crashes) | Encroachment Rate (per MVMT) | Traffic Volume (1,000s vpd) | Comments |
|---|---|---|---|---|---|---|---|
| Calcote et al. (1985) | Video-Based Field Collection | TX, 1979-1980 | Urban Freeways (7 locations) | 6,358 intentional, 12 unintentional | 0.65 - 1.72 | 17.9 to 92.3 | All encroachments. 2 locations had zero unintentional encroachments. |
| Trigger method (GEM) | 4-Lane Rural Divided | 2,922 intentional, 9 unintentional | 2.33 - 5.1 | 4 to 14.7 | Rates based on unintentional encroachments. | ||
| 2-Lane Rural | 239 intentional, 22 unintentional | 10.6 - 18.9 | 7.5 to 8.1 | ||||
| SR 214 (1987) | ROR State Crash Data | MI/NC/WA/CO, 6-10 years of data for each section | Rural 2-Lane Highways | (9,500) | 3.24 - 8.27 | Not reported | All encroachments. Based on utility pole crashes. |
| Miaou (1996, 1997) | ROR State Crash Data | MI/WA/AL, 1980-1984 | Rural 2-Lane Highways | (4,632) | 1.15 - 1.73 | up to 10 | All encroachments. Reported rate based on 10,000 vpd traffic volume. |
| Fitzpatrick et al. (1999) | Photographic/Maintenance | CT, 1998 | I-84 EB (Hartford, entire section) | 62 | 3.49 | 112 to 161 | Median encroachments only and based on visual concrete barrier damage. |
| I-84 EB (curves only) | 44 | 5.58 | 144 | ||||
| I-84 EB (tangents) | 18 | 1.81 | 121 | ||||
| Miaou (2001) | ROR State Crash Data | WA, 1993 - 1995 | Rural 2-Lane Highways | (941) | 1.64 | 1 to 12 | All encroachments. Reported rate based on 10,000 vpd traffic volume. |
Table 8. Summary of Primary Encroachment Characteristics from Previously Published Studies
| Study (Date) | Collection Method | Route or Route Type | Total Encroachments (or Crashes) | Min/Average/Max Encroachment Angle (°) | Min/Average/Max Lateral Extent (ft) | Min/Average/Max Longitudinal Distance (ft) | Comments |
|---|---|---|---|---|---|---|---|
| Hutchinson and Kennedy (1966) | Field Collection | Route 74 | 289-296 | 0.4/11.0/90 | 3/23/40 | 15/291/2,000 | Median encroachments only and includes trucks. Not all encroachments had all elements measured. |
| Route 57 | 25 | 1.6/10.2/45 | 7/23/40 | 39/291/850 | |||
| Glennon and Wilton (1974, 1976) | ROR State Crash Data | Rural 2-lane Highways (all) | (99) | 0.1/7.2/29.9 | 5/27/1,970 | Not reported | Lateral extent for urban arterials discarded as unrepresentative since all involved a collision. Lateral extent only reported for crashes with non-rigid obstacles for rural 2-lane highways. |
| Rural 2-lane Highways (right) | (57) | 0.3/5.3/29.9 | 5/23.7/60 | ||||
| Rural 2-lane Highways (left) | (42) | 0.1/9.8/23.6 | 12/30.5/70 | ||||
| Urban Arterials | (67) | 0.9/7.0/39.4 | N/A | ||||
| Cooper (1980) | Field Collection | 59 road segments | 1,937 | 16* | 16* | Not reported | Roadside encroachments only. * 50th percentile values reported as raw data not available. |
| Calcote et al. (1985) | Video-Based Field Collection | Urban Freeways (7 locations) | 12 | 2/11.4/41 | 5/15.5/60 | 0/515/1800 | Despite the GEM units having capability of computing encroachment characteristics, no data were provided in the available report. Only average values shown for the encroachment characteristics based on the in-depth crash data. |
| Trigger method (GEM) | 2-Lane Rural and 4-Lane Rural Divided | 31 | No summary data reported | ||||
| In-depth | All encroachments | (203) | 19.9 | 23.2 | 115.9 | ||
| Right side departures | 16.4 | 27.7 | 135.8 | ||||
| Left side departures | 22.3 | 20 | 101.5 | ||||
| Miaou (1996, 1997) | ROR State Crash Data | Rural 2-Lane Highways | (4,632) | N/A | 9.25* | N/A | All encroachments. * 50th percentile values reported. |
| Study (Date) | Collection Method | Route or Route Type | Total Encroachments (or Crashes) | Min/Average/Max Encroachment Angle (°) | Min/Average/Max Lateral Extent (ft) | Min/Average/Max Longitudinal Distance (ft) | Comments |
|---|---|---|---|---|---|---|---|
| Miaou (2001) | ROR State Crash Data | Rural 2-Lane Highways | (941) | N/A | Not reported | N/A | Although encroachment rate computed in this study, no analogous distribution of lateral extent was shown in the available report. |
| NCHRP 17-11 + FHWA Rollover | In-depth | Rural and Suburban roadways only | (485) | 16.9 | 3.35 | 147.1 | Average angles and distances shown. |
| NCHRP 17-22 | In-depth | Rural and Suburban roadways only | (890) | 0/16.9/84 | 2.4 | 149.4 | Characteristics for the combined 17-11, FHWA Rollover, and 17-22 studies. Averages only for lateral and longitudinal distances. |
| NCHRP 17-43 | In-depth | Rural and Suburban roadways only | (1,125) | 16.2 | Not reported | Averages only. Includes right and left departures. | |
| RISER | In-depth | Major rural/suburban arterials only | (211) | 6.1* | Not reported | * 50th percentile value reported. | |
| Roque and Cardoso (2016) | Photographic Field Collection | Freeways | 29 | 4.3/15*/50 | Not reported | * 50th percentile value reported. |
2.6.2 Large Truck Encroachment Data
There was very little published information on large truck encroachment characteristics in the available literature. Both the Hutchinson and Kennedy (1966) and Cooper (1980) studies reported that collected encroachments were combinations of passenger vehicle or large truck encroachments. The raw Cooper study data are not available in the published reports, so it was not possible to separate large truck and passenger vehicle encroachment characteristics for this dataset. The Hutchinson and Kennedy (1966) raw data, however, are available in the published report. A single footnote in the report indicates vehicle type was estimated either from the scene evidence (i.e., track width of the vehicle and whether the tracks were single or dual tire) or from information in an associated police crash report, if present. The accuracy of this method was not known. Nevertheless, for completeness, a comparison of the Hutchinson and Kennedy observed passenger vehicle and large truck encroachment characteristics is presented in Table 9. Based on the available data, large trucks appear to depart the roadway at shallower angles, travel farther both laterally and longitudinally, and are more often involved in collisions compared to passenger vehicles. Using standard t tests, no statistical difference was found between the average passenger vehicle and large truck encroachment characteristics, that is, average encroachment angle (p = 0.25), average maximum lateral distance (p = 0.44), or average maximum longitudinal distance (p = 0.19).
| Data Source (N) | Vehicle Type (N) | Average Encroachment Angle (°) | Average Maximum Lateral Distance (ft) | Average Maximum Longitudinal Distance (ft) | Percent Involving Collision (%) |
|---|---|---|---|---|---|
| Route 74 Test Section Only (302) | Car (257) |
11.2 (N = 244) |
23.1 (N = 252) 19.6 (excluding 43 observations > 40 ft) | 290 (N = 246) |
11.7 |
| Truck (45) |
9.7 (N = 45) |
24.0 (N = 44) 19.8 (excluding 9 observations > 40 ft) | 317 (N =44) |
13.3 | |
| All available data (451) | Car (385) |
10.8 (N = 363) |
22.5 (N = 376) 19.2 (excluding 67 observations where lateral extent > median width) | 275 (N = 368) |
15.1 |
| Truck (66) |
8.3 (N = 66) |
23.3 (N = 65) 20.3 (excluding 10 observations where lateral extent > median width) |
325 (N =65) |
15.2 |
The most notable in-depth crash database involving large trucks is the Large Truck Crash Causation Study (LTCCS). The LTCCS provides detailed information for approximately 1,000 large truck crashes that occurred in the U.S. between 2001 and 2003 (FMCSA et al. 2006). To be included as a case in the LTCCS, a crash had to involve at least one vehicle with gross vehicle weight in excess of 10,000 pounds and result in a fatality or injury. Similar to the previously discussed in-depth data sources, the LTCCS also used the NASS/CDS framework. Data for each case were publicly available through a NHTSA-maintained web-based interface, including scene diagrams and crash scene photographs.
Ray et al. (2017) examined the LTCCS data for possible incorporation into the current RSAP version. Prior to this study, RSAP used a limited set of passenger vehicle encroachments to represent the trajectories of single-unit trucks (315 of the available 890) and tractor-trailer units (253 of the available 890) departing the roadway. A total of 68 LTCCS cases involving left departure were examined; it was not clear why the researchers included only left departures instead of both left and right departures. For each case, departure angle was measured using the scaled scene diagrams available in the LTCCS data. The researchers used the posted speed limit as a proxy for vehicle departure speed in their analysis and also estimated roadside terrain using the available case photographs and associated case information. The results of the LTCCS analysis had reasonable agreement with the encroachment characteristics of the limited passenger vehicle encroachments intended to serve as a surrogate for unknown heavy vehicle encroachments. A combination of the LTCCS and limited passenger vehicle trajectories are now used in RSAP.
The only other possible source of large truck encroachment data gleaned from the available literature was the detailed RISER database. Of the 211 cases, there were a total of 10 large vehicle crashes identified, six with large trucks and four with buses/motorcoaches (Thomson et al. 2006). This source may provide some additional anecdotal evidence regarding large vehicle encroachments, but any differences between U.S. and European encroachments are unknown.
2.6.3 Motorcycle Encroachment Data
Until recently, the Hurt study (Hurt et al. 1981a) represented the most comprehensive in-depth motorcycle crash data available in the United States. A particular focus of this study was the cause(s) of the crash and subsequent rider injuries, the effectiveness of protective equipment such as helmets, and determination of appropriate countermeasures to prevent these crashes and/or reduce injuries. Data were collected primarily from 1976 to 1979 in a 470-square mile area in Los Angeles, California. Data collected for the study fall into one of four categories:
- On-scene, in-depth (OSID) crash investigations
- Police-reported crash records
- Exposure site data
- Motorcycle rider exposure interview data
A total of 900 OSID cases were investigated, with approximately two thirds of investigations occurring immediately after the crash and the remaining third within 24 hours. The investigations were conducted by multidisciplinary teams consisting of engineers, psychologists, medical doctors, and data processing specialists. All team members were required to have motorcycle riding experience and had a minimum of 6 months of motorcycle crash investigation training. For each OSID crash, approximately 1,000 data elements were recorded. A total of 3,600 police
accident reports were collected from the study area from the same period, including most but not all of the 900 OSID crashes. Exposure data were collected at 505 of the 900 OSID crash sites and included traffic counts and interviews of 2,310 non-crash involved motorcycle riders. To collect the exposure data, the investigators returned to the crash scene at the same time of day and approximate weather conditions present for the crash and recorded data for 30 minutes before and 30 minutes after the time of the crash.
Although the Hurt study was not specific to ROR motorcycle crashes, additional data provided in the appendices of the Hurt report (Hurt et al. 1981b) may provide some insight into these crashes. Of the 900 OSID cases, 230 were single-vehicle collisions. Single-vehicle collisions, however, are not all ROR crashes and could include non-ROR crashes, such as when a rider slides the bike into a horizontal position on the roadway. There are presumably at least 40 ROR motorcycle crashes present in the data, as 40 were reported to involve a fixed object, but it is not possible to determine the exact number of ROR crashes from the data available in the appendices. From the injury data available, there were 188 reported contacts with roadside objects such as barriers, poles, and embankments. Motorcycle speed distributions were also available for all the single-vehicle crashes, but these would also include some unknown number of non-ROR crashes. The data presented in the appendices of the Hurt report are only tabulations of the available data, and given the age of the study, it is unlikely that the scene diagrams for each crash are still available for use in determining typical trajectories for ROR crashes involving motorcycles. No other encroachment data, such as angle, maximum lateral encroachment, or maximum longitudinal distance, were present in the appendices of the report.
More recently, Oklahoma State University collected in-depth motorcycle crash data for approximately 350 crashes, primarily from Orange County, California (Nazemetz et al. 2016). The researchers generally followed the European Organization for Economic and Community Development procedures for data collection, which are similar to the approach used in the Hurt study described above. Each available case includes detailed crash-related scene data, associated diagrams and photographic documentation, and detailed documentation of occupant injuries. A total of 82 single-vehicle crashes are available, which likely include ROR and non-ROR crashes. As the study was recent and in part based on the NASS/CDS methodology for collecting scene data, crash scene diagrams are likely available along with the coded data elements for each case.
2.7 Summary
The two primary existing methods to determine vehicle encroachment frequency and encroachment characteristics (e.g., departure angle, maximum lateral and longitudinal departure extent) have been field collection and in-depth crash investigations. The Hutchinson and Kennedy (1966) and Cooper (1980, 1981) field collection encroachment studies conducted in the 1960s and 1970s continue to serve as the basis for the guidelines in the RDG (AASHTO 2011) and for the base encroachment frequencies and many of the encroachment frequency adjustments in the latest version of RSAP (version 3; RSAPv3). Also, the ROR crash vehicle trajectories present in the NCHRP 17-22 in-depth dataset serve as the basis for modeling encroaching vehicles in RSAP (Ray et al. 2012). The third primary encroachment data collection method, the ROR state crash data approach, has been less widely used, but a similar approach has been used to generate some of the base encroachment modifiers present in RSAP. Table 10 summarizes the strengths and limitations of these three primary encroachment data collection methods.
Table 10. Strengths and Limitations of Existing Roadside Encroachment Data Collection Methods
| Method | Strengths | Limitations |
|---|---|---|
| Field Collection |
|
|
| ROR State Crash Data |
|
|
| In-Depth Crash Study |
|
|
The following is a list of observations regarding existing encroachment data limitations based on a review of the available encroachment data:
- The most recent data used to determine encroachment rate are now 20 years old, and the vast majority of the available encroachment data are now in excess of 30 years old.
- Although traffic volume varied from approximately 1,000 to 161,000 vehicles per day, the vast majority of the collected encroachment data to date (approximately two thirds) were collected on roadways with traffic volumes of 40,000 vehicles per day or less.
- Very little is known about encroachment characteristics of other vehicle types, such as large trucks, buses, and motorcycles. Although the Hutchinson and Kennedy (1966) and Cooper (1980, 1981) studies differentiated between passenger vehicle and heavy vehicle encroachments, little raw data were available for examination. No motorcycle- or bus-specific encroachment data were found.
- Excluding studies that relied solely on police-reported crash data, there was a roughly equal distribution of encroachments collected on rural (59%) versus urban roadways (41%) and encroachments collected on divided (60%) versus undivided roadways (40%). Including the police-reported crash studies, these distributions were much more skewed toward rural roadways (89%) and undivided roadways (88%).
- The vast majority of the existing encroachment data were collected on higher speed roadways with posted speed limits of 50 mph or higher.
The exploration of potential new methods to collect encroachment data based on current and near-future technologies revealed at least seven potential methods. The strengths, limitations, and estimated timeline for implementation of each method are summarized in Table 11. Only three of these methods were found to be feasible at present for the current project: NDS data, EDR data, and Google Street View methods. The NDS approach was included in the present project.
The exploration of existing datasets that could be used to determine encroachment characteristics of non-passenger vehicles revealed two promising options. For heavy vehicles, the LTCCS will provide vehicle trajectory information (FMCSA et al. 2006), while the Oklahoma State University motorcycle study will provide motorcycle trajectory information (Nazemetz et al. 2016).
Table 11. Strengths and Limitations of Potential Roadside Encroachment Data Collection Methods
| Method | Strengths | Limitations | Timeline |
|---|---|---|---|
| NDS Methods |
|
|
Present |
| EDR Data |
|
|
Present |
| Google Street View Methods |
|
|
Present |
| Method | Strengths | Limitations | Timeline |
|---|---|---|---|
| Orthoimagery-Based Methods |
|
|
5-10 years |
| Stationary Video Cameras |
|
|
2-5 years |
| Infrastructure-Based Instrumentation |
|
|
5 years + |
| Vehicle-Based Methods |
|
|
4 – 6 years for GPS, Unknown for lane departure warning |


