Roadside Encroachment Database and Analysis (2025)
Chapter: 3. Development of the Encroachment Database
3. Development of the Encroachment Database
3.1 Background
The objectives of NCHRP Project 17-88 were (1) to develop a database of roadside encroachment characteristics for a variety of roadside conditions and roadway types, and (2) to analyze the database to evaluate (a) the factors that influence the nature and frequency of roadside encroachments, (b) the relationship between unreported and reported crashes, and (c) whether heavy vehicle, bus, and motorcycle encroachments resulting in a crash differ from passenger vehicle encroachments resulting in a crash.
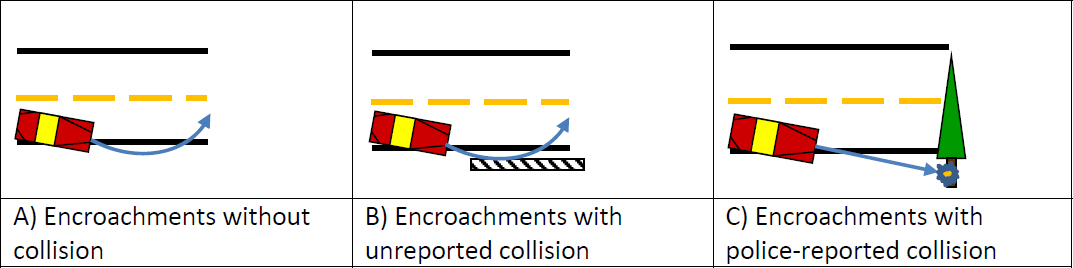
The NCHRP Project 17-88 encroachment database recorded encroachments across the full range of highway vehicle types, including passenger vehicles, heavy vehicles, buses, and motorcycles, along with the entire spectrum of encroachment severities. As shown in Figure 4, roadside encroachments can be broadly grouped into three categories: (a) encroachment without collision, (b) encroachments with unreported collisions, and (c) encroachments with police-reported collisions. Each encroachment category requires a different data source.
The objective of this section is to describe the development of the roadside encroachment database.
3.2 Development of the NCHRP 17-88 Database
3.2.1 Approach
Our approach was to systematically compile a tabulation of data element needs for roadside encroachment analyses by examining the RDG (AASHTO 2011), the MASH (AASHTO 2016), the underlying data on which both guidelines were developed, additional data elements requested by the Project Panel, and additional data elements correlated with encroachment as identified in the roadside safety literature. Second, potential sources for encroachment data were identified as part of the literature review and summarized in the previous chapter. Finally, a data catalog of proposed data elements was assembled, along with potential data sources for each element.
3.2.2 Data Element Needs
The two most immediate applications of the encroachment data collected under NCHRP Project 17-88 will support potential updates to (1) the RDG (AASHTO 2011) and (2) the MASH (AASHTO 2016). In addition, the research team used the encroachment database to investigate factors that lead to encroachment, compare encroachment crashes as a function of vehicle type, and examine the relationship between reported and unreported crashes. The data needed to investigate these research questions drove the design of the data collection efforts.
Data Needs for the RDG
AASHTO’s RDG presents current roadside design practices and current safety treatments intended to minimize the likelihood of serious injuries in roadway departures. Historically, both the current and previous versions of the RDG were based on encroachment data collected by Hutchinson and Kennedy in Illinois in the 1960s (Hutchinson 1962; Hutchinson and Kennedy 1966) and encroachment data collected in Canada in the late 1970s as reported by Cooper (1980). Although now decades old, the two datasets provide a guide to the minimum dataset needed for the NCHRP 17-88 encroachment database. The RDG itself provides a table (AASHTO 2011, Table 5-10) of suggested runout lengths for barrier design as a function of design speed and traffic volume (ADT). These runout lengths are needed to compute the required barrier length. Table 12 presents a combined listing of data elements from these three sources that should be considered for a potential update of the RDG.
Table 12. Combined Data Elements from Hutchinson and Kennedy (H&K), Cooper, and the RDG Runout Table
| Data Element | Description/Notes | H&K | Cooper | RDG |
|---|---|---|---|---|
| Number | Unique encroachment identifier (equivalent to CaseNo in crash data) | X | X | |
| Date | Month/day/year format | X | X | |
| Roadway Identifier | Roadway name/designation where encroachment was observed | X | X | |
| Roadway Configuration | Divided vs. undivided. All segments in H&K study were divided | X | X | |
| Median Width | H&K included divided roads only. Cooper included | |||
| divided and undivided roadways but observed only | X | |||
| roadside encroachments | ||||
| Median Depth | All H&K medians were depressed | X | ||
| Median Surface Type | Distinguished turf from pavement | X | ||
| Specific Location | Station/chainage along roadway segment where encroachment occurred | X | X | |
| Travel Direction | Compass direction of encroaching vehicle | X | X | |
| Posted Speed Limit (PSL) | Cooper: PSL ≥ 50 mph. H&K reported PSL: 60 to 70 mph, inclusive | X | X | |
| Advisory Speed Limit | No detailed description provided. Likely speed reduction due to geometry | X | ||
| Design Speed | Design speed of the roadway segment | X | ||
| Traffic Volume | Vehicles per day on roadway segment | X | X | X |
| Horizontal Alignment | At point of encroachment. H&K had as-built plans for the roadway sections. *Qualitative only (curve, no curve, uphill, etc.) for Cooper* | X | X* | |
| Vertical Alignment | X | X* | ||
| Collision/Object Struck | Object struck identified (if applicable). Cooper collected up to three objects | X | X | |
| Object Influence | Object that influenced the encroachment (e.g., driver swerves to avoid a median obstacle) | X |
| Data Element | Description/Notes | H&K | Cooper | RDG |
|---|---|---|---|---|
| Vehicle Type | H&K distinguishes “car” from “truck” (e.g., heavy trucks). Cooper indicates “light” or “dual wheel” | X | X | |
| Departure Designation | Right or left encroachment. H&K included only left departures | X | X | |
| Angle (departure) | Encroachment/departure angle (degrees) | X | X | |
| Angle (re-entry) | Limited detail provided. Likely the angle at which vehicle returns to road | X | ||
| Longitudinal Extent | Maximum longitudinal distance of encroachment | X | X | X |
| Lateral Extent | Maximum lateral distance of encroachment | X | X | |
| Lateral Extent, Initial | Lateral distance to first point of recovery in median. No further details | X | ||
| Long. Extent, Initial | Longitudinal distance to first point of recovery in median. No further details | X | ||
| Encroachment Type | Encroachment trajectory classified based on an alphanumeric scheme | X | ||
| Police Report Available? | Indication of reported or unreported (subset of encroachments only) | X | ||
| Driver Action | Up to two driver actions recorded (subset of encroachments only) | X | ||
| Braking Extent | Estimated extent of braking, distance (subset of encroachments only) | X | ||
| Roadside/Median Slope | Slope of roadside/median at encroachment location | X | X | |
| Roadside Cross Section | Sketches depicting configuration. H&K provided typical sections | X | X | |
| Shoulder Type/Width | Width and type of shoulder (paved, unpaved) | X | X |
Data Needs for the MASH
AASHTO’s MASH provides guidelines for crash testing of both permanent and temporary roadside safety features and recommends evaluation criteria to assess test results (AASHTO 2016). Specifically, MASH prescribes crash test conditions to evaluate roadside safety hardware. The test conditions were chosen to be representative of a practical worst-case crash, typically defined to be the 85th percentile of real-world crash severities. Table 13 presents a list of the data elements that would be needed for a potential update of these crash test conditions.
Table 13. Data Needs for an Update to MASH Crash Test Conditions
| Data Element | Description/Notes |
|---|---|
| Impact Speed | Speed at which the vehicle struck the fixed object |
| Impact Angle | Angle between the vehicle longitudinal axis and the fixed object orientation |
| Vehicle General Area of Damage (GAD) | General area of damage on the vehicle [i.e., front, left side, right side, or rear (using SAE J224 definition)] |
| Specific Horizontal Location (SHL) of Impact on Vehicle | Specific horizontal location using SAE J224 definition. On front plane, for example, L=left corner, R=right corner, C=centerline, D=distributed damage |
| Object Struck | Description of roadside object struck. This allowed subsequent analyses to compare real-world distributions of object struck with MASH test conditions by category of object struck (e.g., longitudinal barriers vs. breakaway poles) |
| Departure Speed | Resultant velocity of the center of gravity of the vehicle at departure from the roadway |
| Departure Angle | Travel direction of the center of gravity of the vehicle with respect to a tangent to the road edge at departure from the roadway |
| Vehicle Orientation at Impact | Angle between the longitudinal axis of the vehicle and the direction of travel at impact |
| Vehicle Orientation at Departure | Angle between the longitudinal axis of the vehicle and the direction of travel at departure from the roadway |
| Vehicle Type | Car, light truck, motorcycle, heavy truck, bus |
Additional Research Data Needs
In addition, there were several project-specific data elements needed to support specific objectives of the NCHRP Project 17-88. The NCHRP 17-88 Request for Proposal (RFP) included a list of data elements that the Project Panel requested for inclusion in the data collection effort. Our research team developed a second set of elements for our encroachment analysis via inspection of the HSM, discussions with the research team who had developed RSAP under NCHRP 22-27 and was considering roadside features for inclusion in the HSM under NCHRP 17-54, and the NCHRP 17-43 Interim Report, which developed an exhaustive list of data elements for analysis of roadside departures of light passenger vehicles. Table 14 presents this list of data elements.
Table 14. Additional Research Data Elements
| Data Element | Description/Notes | Panel Request | Added Elements |
|---|---|---|---|
| Land Use | Rural, suburban, urban | X | |
| Vehicle Type | Car, light truck, motorcycle, heavy truck, bus | X | |
| Traffic Volume | Traffic volume | X | |
| Presence of Curbs | Binary (yes or no). Include type (perpendicular or sloped) if available | X | |
| Presence of Roadside Hardware | Binary (yes or no). Include type of hardware | X |
| Data Element | Description/Notes | Panel Request | Added Elements |
|---|---|---|---|
| Cross-sectional Elements | Side slope and back slope. Include ratio of horizontal-to-vertical dimensions if available | X | |
| LOS | Quality of service for motor vehicle traffic using the TRB Highway Capacity Manual conventions (i.e., letters A through F, with A being the highest and F being the lowest). | X | |
| Crash Location | GPS, or Route/milepost | X | |
| Vehicle Orientation at Road Departure | Angle between longitudinal axis of vehicle and direction of travel | X | |
| Vehicle Stability at Road Departure | Tracking/Non-tracking | X | |
| Departure Side | Left/Right | X | |
| Objects Struck | Object(s) struck by encroaching vehicle | X | |
| Offset to Object Struck | Lateral distance from road edge to object struck | X | |
| Crash Severity/Injury Severity | Maximum injury level in the vehicle (use Abbreviated Injury Scale if possible) | X | |
| Police Reported | Binary (yes or no) | X | |
| Intentional Encroachment | Binary (yes or no) | X | |
| Rollover (yes/no) | Binary (yes or no) | X | |
| Involvement of Another Vehicle | Binary (yes or no) | X | |
| Roadway Geometry | Number of lanes, lane width, horizontal and vertical alignment | X | |
| Design Speed | Design speed of roadway segment | X | |
| Vehicle Volume by Vehicle Type | Vehicle volume by vehicle type (i.e., vehicle mix) | X | |
| Weather | Weather at time of encroachment (sun, rain, snow) | X | |
| Lighting | Light at time of encroachment (day, night with illumination, night without illumination, dawn, dusk) | X | |
| Driver Condition | Nominal, alcohol-involved, drowsy, asleep, distracted (if available) | X | |
| Driver Actions | Driver recovery/crash avoidance actions | X | |
| Trajectory | Trajectory of vehicle from departure to either impact or recovery | X | |
| Work Zone | Presence of work zone (yes, no) | X | |
| Access Control | Level of access control (full, partial, none) | X | |
| Access Density | Access points per unit length of roadway | X | |
| Lane Markings | Lane marking type and color; right and left | X |
| Data Element | Description/Notes | Panel Request | Added Elements |
|---|---|---|---|
| Point of Departure Markings | Lane marking style at the point of departure | X | |
| Soil Condition | Soil condition at point of impact (normal, muddy/waterlogged, frozen) | X | |
| Rumble Strip | Presence of rumble strip at POI (yes, no) | X | |
| Encroachment Time | Time of day of encroachment to infer associated traffic conditions (i.e., peak or off-peak) | X |
Note that LOS varies temporally just as traffic varies with time (e.g., LOS could be closer to F during rush hour and then closer to A throughout the late-night hours on the same roadway). AADT has been used as a proxy for traffic, but some researchers have suggested that the amount of traffic presented at the time of encroachment may have a strong influence on encroachment probability and could not readily be modeled (Roque and Cardosa 2016).
Combined Set of Data Needs
Table 15 presents a combined set of data needs assembled from the preceding data elements either (a) collected by Hutchinson and Kennedy (Hutchinson 1962; Hutchinson and Kennedy 1966) and Cooper (1980, 1981), (b) necessary for potential updates to the RDG and MASH, or (c) necessary to conduct project-specific analyses on the nature of roadside encroachments. The data element names and descriptions have been adjusted for uniformity and grouped into five broad categories: case identifiers, roadway data elements, roadside data elements, trajectory elements, and driver/vehicle elements.
Table 15. Combined Set of NCHRP 17-88 Data Needs
| Group | Data Element | Description/Notes | H&K | Cooper | RDG | MASH | Additional Research Needs |
|---|---|---|---|---|---|---|---|
| Case | Case Identifier | Case number or encroachment identifier | X | X | X | ||
| Date | Date of encroachment/crash | X | X | ||||
| Police Reported | Binary (yes or no) | X | X | ||||
| Encroachment Time | Time of day of encroachment | X | |||||
| Roadway Description | Roadway Identifier | Roadway name/designation where encroachment was observed | X | X |
| Group | Data Element | Description/Notes | H&K | Cooper | RDG | MASH | Additional Research Needs |
|---|---|---|---|---|---|---|---|
| Roadway Description | Encroachment Location | GPS, or Route/milepost | X | X | X | ||
| Travel Direction | Compass direction of encroaching vehicle | X | X | ||||
| Posted Speed Limit | Posted Speed Limit | X | X | ||||
| Advisory Speed Limit | Advisory Speed Limit | X | |||||
| Design Speed | Design Speed for roadway segment | X | X | ||||
| Traffic Volume | Vehicles per day on roadway segment | X | X | X | X | ||
| Traffic Volume by Vehicle Type | Vehicle volume by vehicle type (i.e., vehicle mix) | X | |||||
| Number of Lanes | Number of lanes at point of departure | X | |||||
| Lane Width | Width of lane from which encroachment occurred | X | |||||
| Median Width | Width of median in divided highways | X | |||||
| Median Depth | Depth of median in divided highways | X | |||||
| Horizontal Alignment | Horizontal Alignment at point of departure | X | X | X | |||
| Vertical Alignment | Vertical Alignment at point of departure | X | X | X | |||
| Roadway Configuration | Divided vs. undivided | X | X | X | |||
| Work Zone | Presence of work zone (yes, no) | X | |||||
| Access Control | Level of access control (full, partial, none) | X |
| Group | Data Element | Description/Notes | H&K | Cooper | RDG | MASH | Additional Research Needs |
|---|---|---|---|---|---|---|---|
| Roadway Description | Access Density | Access points per unit length of roadway | X | ||||
| Land Use | Rural, suburban, urban | X | |||||
| LOS | Quality of service for motor vehicle traffic using the TRB Highway Capacity Manual conventions (i.e., letters A through F, with A being the highest and F being the lowest). | X | |||||
| Weather | Weather at time of encroachment (sun, rain, snow) | X | |||||
| Lighting | Light at time of encroachment (day, night with illumination, night without illumination, dawn, dusk) | X | |||||
| Roadside Encroachment Conditions | Roadside Surface Type | Examples – pavement, gravel, earth (soil or grass), combined (two or more surfaces) | X | ||||
| Departure Side | Right or left encroachment | X | X | X | |||
| Departure Speed | Resultant velocity of the center of gravity of the vehicle at departure | X |
| Group | Data Element | Description/Notes | H&K | Cooper | RDG | MASH | Additional Research Needs |
|---|---|---|---|---|---|---|---|
| Roadside Encroachment Conditions | Departure Angle | Travel direction of the center of gravity of the vehicle with respect to a tangent to the road edge | X | X | X | ||
| Vehicle Orientation at Departure | Angle between the longitudinal axis of the vehicle and the direction of travel at departure from the roadway | X | X | ||||
| Vehicle Stability at Road Departure | Tracking/Non-tracking | X | |||||
| Re-entry Angle | Angle at which vehicle re-enters the roadway (degrees) | X | |||||
| Roadside Slope | Slope of roadside/median at encroachment location | X | X | X | |||
| Roadside Cross Section | Side slope and back slope. H&K and 17-22 provide categories of cross-section shapes | X | X | X | |||
| Shoulder Type/Width | Width and type of shoulder (paved, unpaved) | X | X | ||||
| Presence of Curbs | Binary (yes or no). Include type (perpendicular or sloped) if available | X | |||||
| Encroachment Trajectory | Trajectory | Encroachment trajectory – array of points or trajectory category (e.g., H&K) | X | X |
| Group | Data Element | Description/Notes | H&K | Cooper | RDG | MASH | Additional Research Needs |
|---|---|---|---|---|---|---|---|
| Encroachment Trajectory | Longitudinal Extent | Maximum longitudinal distance of encroachment in this trajectory segment | X | X | X | ||
| Lateral Extent | Maximum lateral distance of encroachment in this trajectory segment | X | X | ||||
| Departure Speed | Resultant velocity of the center of gravity of the vehicle at departure | X | |||||
| Departure Angle | Travel direction of the center of gravity of the vehicle with respect to a tangent to the road edge | X | X | X | |||
| Vehicle Orientation at Departure | Angle between the longitudinal axis of the vehicle and the direction of travel at departure from the roadway | X | X | ||||
| Vehicle Stability at Road Departure | Tracking/Non-tracking | X | |||||
| Re-entry Angle | Angle at which vehicle re-enters the roadway (degrees) | X | |||||
| Impact Speed | Speed at which the vehicle struck the fixed object | X |
| Group | Data Element | Description/Notes | H&K | Cooper | RDG | MASH | Additional Research Needs |
|---|---|---|---|---|---|---|---|
| Encroachment Trajectory | Impact Angle | Angle between the vehicle longitudinal axis and the fixed object orientation | X | ||||
| Vehicle Orientation at Impact | Angle between the longitudinal axis of the vehicle and the direction of travel at impact | X | |||||
| Vehicle General Area of Damage (GAD) | General area of damage on the vehicle [i.e., front, left side, right side, or rear (using SAE J224 definition)] | X | |||||
| Specific Horizontal Location (SHL) of Impact on Vehicle | Specific horizontal location (SHL) using SAE J224 definition. On front plane, for example, L=left corner, R=right corner, C=centerline, D=distributed damage | X | |||||
| Object Struck | Roadside object struck | X | X | X | X | ||
| Offset to Object Struck | Lateral distance from road edge to object struck | X | |||||
| Braking Extent | Estimated extent of braking, distance during trajectory segment | X | X | ||||
| Vehicle Orientation at Impact | Angle between the longitudinal axis of the vehicle and the direction of travel at impact | X |
| Group | Data Element | Description/Notes | H&K | Cooper | RDG | MASH | Additional Research Needs |
|---|---|---|---|---|---|---|---|
| Encroachment Trajectory | Object Influence | Object that influenced the encroachment (e.g., driver swerves to avoid a median obstacle) | X | ||||
| Rollover | Binary (yes or no) | X | |||||
| Vehicle | Vehicle Type | Car, light truck, motorcycle, heavy truck, bus | X | X | X | X | |
| Driver Condition | Nominal, alcohol-involved, drowsy, asleep, distracted (if available) | X | |||||
| Driver Actions | Driver recovery/crash avoidance actions | X | X | ||||
| Involvement of Another Vehicle | Binary (yes or no) | X | |||||
| Intentional Encroachment | Binary (yes or no) | X | |||||
| Crash Severity/Injury Severity | Maximum injury level in the vehicle (use Abbreviated Injury Scale if possible) | X |
Note. H&K = Hutchinson and Kennedy.
3.2.3 Data Sources
Data to populate the NCHRP 17-88 encroachment database were obtained from U.S. national and state crash databases coupled with data from NDS and specialized databases of roadway characteristics. Data sources for the study include:
- NCHRP 17-43 Road Departure Database. The NCHRP 17-43 database is comprised of 1,581 police-reported roadside departures extracted from the NASS/CDS case years 2011 to 2015. NCHRP 17-43 has developed full reconstructions and trajectories for these cases through analysis of crash scene diagrams and scene photos recorded by the NASS/CDS crash investigator.
- NASS/CDS Database. NASS/CDS is a national stratified sample of 4,000 to 5,000 crashes that were investigated each year until 2015 by NHTSA at up to 27 locations throughout the United States. For a crash to be included in NASS/CDS, at least one of the vehicles in the
- crash had to be towed from the scene. NASS/CDS only investigates crashes involving passenger vehicles and light trucks. NASS/CDS provides extensive investigation of vehicle crashworthiness, occupant injury, and occupant restraint performance, but it contains only limited data on the unique characteristics of ROR crashes (i.e., barrier design, slope, and roadway geometrics). NCHRP Project 17-43 collected these specialized roadside characteristics through a supplemental data collection program.
- State Data. Washington, Iowa, and Tennessee have agreed to share state crash data files, roadside inventory files, and roadside hardware maintenance files in support of the current research efforts to develop a next-generation encroachment database. Our objective was to link the crash, inventory, and maintenance data through keys such as route number-milepost location or GPS location identifiers. The crash data alone can provide the frequency and severity of encroachments that resulted in a collision or rollover. When linked with the inventory and crash data, the maintenance data can provide the frequency of crashes that required repairs but were not reported to police.
- Motorcycle Crash Causation Study (MCCS). The FHWA MCCS database was used as the basis for motorcycle encroachments and motorcycle road departure trajectories (Nazemetz et al. 2016). This database is comprised of 351 injury crashes, of which 47 cases are single-vehicle crashes.
- LTCCS. The LTCCS was used as the basis for large truck encroachments and large truck road departure trajectories (FMCSA et al. 2006). The LTCCS provides detailed information for approximately 1,000 large truck crashes that occurred in the U.S. between 2001 and 2003. An initial scan of the available data indicates 124 total roadway-departure crash events.
- NCHRP 22-26 Motorcycle Departure Database. The NCHRP 22-26 database is comprised of 22 motorcycle-barrier crashes in North Carolina. To be eligible for NCHRP 22-26 data collection by Virginia Tech researchers, the case needed to involve a motorcycle impact with a roadside barrier where the motorcyclist was transported to a Level 1 trauma center. NCHRP 17-88 has developed full reconstructions and trajectories for these cases through analysis of crash scene diagrams and scene photos recorded by the NCHRP 22-26 crash investigators.
- SHRP 2 NDS. The SHRP 2 was an NDS led by TRB of the National Academies of Science. From 2010 to 2013, SHRP 2 equipped over 3,300 private vehicles with cameras, radars, and other sensors to collect over 3 years of data that included a total of 6,650,519 trips and nearly 50 million miles of driving. The SHRP 2 NDS captured a substantial number of roadside encroachments, both with and without collisions. The current study analyzed a subset of these data as a source of non-collision encroachments and collisions across the range of severities from minor unreported collisions (e.g., sideswipes of guardrails) to serious crashes into roadside hazards.
- SHRP 2 Roadway Information Database (SHRP 2 RID). The SHRP 2 data provided a second supplemental database of the roadway characteristics that can be linked by event location to each SHRP 2 road departure discussed above. This linkage allowed the project team to determine the effects of roadway characteristics on the nature and frequency of roadside encroachments. Data elements in the RID include horizontal curvature [radius,
- length, and direction of curve (i.e., left or right)], vertical grade, cross-slope/super-elevation, lane configuration (number, width, and type, such as turn or acceleration lanes), shoulder type, presence of curb, presence of longitudinal barriers (e.g., guardrails), and presence of rumble strips.
Table 16 presents the time frames of the databases used to populate the NCHRP Project 17-88 encroachment database:
Table 16. Data Sources for the NCHRP 17-88 Encroachment Database
| Database | Data Collection Time Frame |
|---|---|
| SHRP 2 NDS | 2010-2013 |
| SHRP 2 RID | 2010-2013 |
| NCHRP 17-43 Road Departure Database | 2011-2015 |
| NCHRP 22-26 Motorcycle Departure Database | 2010-2016 |
| Iowa State Datasets | 2012-2017 |
| Washington State Datasets | 2012-2018 |
| Tennessee Datasets | 2015-2019 |
| MCCS Database | 2011-2016 |
| LTCCS Database | 2001-2003 |
3.2.4 Summary of Data Availability
State Data
A total of three state agency partners had been identified and agreed to participate in NCHRP Project 17-88: (1) Washington State Department of Transportation (DOT; Maintenance Operations Office), (2) Iowa DOT (Office of Highway Support, Office of Traffic and Safety, and Office of Analytics), and (3) Tennessee DOT (Safety Data Section and Asset Management Office).
The primary purpose of the state data was to identify police-reported ROR crashes and unreported ROR crashes for a variety of roadway geometric and traffic conditions. Table 17 provides a high-level summary of the data needed for the study along with the potential data sources. In addition to data to determine reported and unreported ROR crashes, data were needed to characterize the associated roadway and traffic conditions, distinguish between vehicle types, and determine occupant injury severity. The state data available for the project can be generally classified as crash, inventory, or maintenance data. The following sections provide more details on the required police-reported crash data, roadway/roadside inventory data, and maintenance data.
Table 17. High-level Summary of Data Needed and Potential Data Sources
| Data Need Category | Potential Data Sources |
|---|---|
| ROR crash frequency | Police crash data, Maintenance data |
| Roadway characteristics | Police crash data, Roadway/roadside inventory data |
| Traffic characteristics | Roadway inventory data |
| Occupant injuries | Police crash data |
| Vehicle characteristics | Police crash data |
Crash Data
Table 18 lists the required police-reported crash data, which can be classified into general crash, vehicle, or occupant information. Brief notes accompany each data element required. Crash time
and location data elements were critical because they allow a link to any available roadway and roadside inventory data as well as available maintenance data. Crash sequence of events information was required to separate ROR crashes from other crash modes present in the data. Vehicle type information was required to distinguish passenger vehicles (cars, pickups, and SUVs) from other specific vehicle types of interest (motorcycles, heavy vehicles, and buses). Occupant injury data were required to support analysis of the encroachment characteristics in tandem with the occupant injury outcomes.
Table 18. Summary of Police-reported Crash Data Needed
| Data Category | Data Element | Purpose/Notes |
|---|---|---|
| General Crash | Location | Provide link with inventory and maintenance data. Can be Route/Milepost or GPS location format |
| Date/Time | Provide link with inventory and maintenance data | |
| Travel direction | Orient vehicle on roadway, help link to specific inventory item for ROR crashes | |
| Location with respect to roadway | Needed to distinguish ROR crashes from other crash types | |
| Sequence of events | ||
| Manner of collision | Distinguish ROR crashes from other crash types and distinguish impact configuration (e.g., front, side) | |
| Vehicle | Vehicle type | Distinguish passenger vehicles, heavy vehicles, and motorcycles |
| Point of impact | Distinguish impact configuration (e.g., front, side) | |
| Most damaged area | ||
| Occupant | Injury severity | Allow analysis of encroachment characteristics as a function of injury outcome |
In general, the available crash data for all three states were adequate for use in the current study. Iowa and Tennessee had all the required information, and Washington State was missing only information to indicate crash configuration (e.g., front, side). While crash configuration cannot easily be collected via alternate means, the missing data did not affect the determination of unreported crashes, only the ability to analyze the collected data by crash configuration type. Since Iowa and Tennessee had these data available, we considered this deficiency minor.
Inventory Data
Table 19 lists the required roadway and roadside feature inventory data. The roadway data were primarily intended to support an analysis of the nature and frequency of encroachments as a function of relevant roadway (e.g., horizontal alignment, vertical alignment, speed limit) and roadside characteristics (e.g., shoulder type/width, curb presence). Some of the required roadway data were also present in the available crash data (e.g., posted speed limit and qualitative roadway alignment descriptors), which helped verify appropriate linkage between available crash and roadway data. Roadside inventory data should ideally provide device location that includes lateral offset from the travel lane and the device type. At a minimum, the roadside inventory data should have included traffic barriers, end terminals, crash cushions, and sign/light supports. Data on exact device type and crash test level (if applicable) were sought and obtained when available; however, these data were not necessarily a requirement for estimating unreported crashes, provided the
maintenance records linked in some form to the available inventory data. The goal was to estimate the number of unreported crashes and focus on roadside devices that had associated maintenance data available. Combining these two data sources provided a means of estimating unreported crashes. There were other objects present on the roadside (e.g., trees, mailboxes), but without associated maintenance data for that object, it was not possible to estimate the associated number of unreported crashes with that object.
Table 19. Summary of Roadway and Roadside Inventory Data Needed
| Data Category | Data Element | Purpose/Notes |
|---|---|---|
| Roadway | Location | Link roadway data with other available data. Can be Route/Milepost or GPS reference post locations |
| Lane width | Support roadway classification | |
| Number of lanes | Support roadway classification | |
| Lane configuration/type | Distinguish special lanes [e.g., acceleration/deceleration lanes, two-way left turn lanes (TWLTL)] from through lanes | |
| Shoulder type/width | Should ideally distinguish paved from unpaved and provide width information, including lateral offset to curb face | |
| Curb presence/type | Support roadway classification. Curb type ideally based on AASHTO Green Book Classifications (A – G) but at a minimum distinguishes between vertical and sloping curbs | |
| Land use (rural/urban) | Support roadway classification | |
| Posted speed limit (PSL) | PSL typically available in the crash data; serves as a check for crash/roadway data linkage. Supports HSM computations. Design speed will be sought if available | |
| Vertical alignment | At a minimum, this should be qualitative (e.g., flat, uphill, downhill), but quantitative vertical grade is preferred. Qualitative information likely available in the crash data | |
| Horizontal alignment | At a minimum, this should be qualitative (e.g., curve, straight), but quantitative horizontal curve radius is preferred. Qualitative information likely available in the crash data | |
| Median presence/width | Support roadway classification | |
| Access density | Support roadway classification | |
| Rumble strip presence/location | Support roadway classification | |
| Lighting presence/absence | Support roadway classification | |
| Traffic | Traffic volume |
| Data Category | Data Element | Purpose/Notes |
|---|---|---|
| Truck percentage | Support roadway classification. At a minimum, distinction between passenger vehicles and heavy vehicles is needed, but complete vehicle mix information will be obtained when available | |
| LOS | Support roadway classification | |
| Roadside | Device type/location |
May vary by roadway section but should ideally include the following device types:
Details on exact device type and crash test level (if applicable) will be sought and used when available |
| Device length | For non-point hardware such as barriers only. Length may be inferred from start and end location data | |
| Device offset | Lateral distance from the edge of traveled way | |
| Roadside configuration/slope | Side slope and back slope at roadside/median at encroachment locations |
In general, the available roadway and roadside inventory data from the three partner agency states were adequate to support identification of unreported crashes with roadside devices across various roadway characteristics, especially when considering the data available from all states in combination. As an example, Iowa lacks detailed horizontal and vertical alignment data, but Washington State and Tennessee had detailed horizontal and vertical alignment data present. Table 20 summarizes the missing inventory data from the three partner agency states and an associated priority level for obtaining each remaining element.
Table 20. Summary of Missing Inventory Data Elements from Washington and Iowa
| Gap Data Element (missing from) | Priority/Notes | Primary Methods to Obtain Data (high priority elements only) |
|---|---|---|
| Vertical Alignment (Iowa) | Low/Washington State and Tennessee have these data available | N/A |
| Horizontal Alignment (Iowa) | Low/Washington State and Tennessee have these data available | N/A |
| Gap Data Element (missing from) | Priority/Notes | Primary Methods to Obtain Data (high priority elements only) |
|---|---|---|
| Access Density (All) | Low/Washington state had indicated availability but required mining of non-tabular data (and excluded driveways). Given project resources and other missing data, this was deemed lower priority | N/A |
| Lighting (Iowa) | Low/Washington State and Tennessee have these data available | N/A |
| LOS (All) | High/Although Washington State had indicated availability, the data were for planning and not based on actual traffic volumes | Estimate using available traffic volume data and roadway segment characteristics |
| Device Offset (All) | High/Missing from all three state datasets, most important for longitudinal barriers | Google Earth similar to NCHRP Project 17-45 (Bonneson et al. 2012) or Google Street View similar to Roque and Cardosa (2016) study |
| Roadside Configuration/Slope (All) | High/Missing from all three state datasets | Street View/Photologs to provide general categories (e.g., foreslope, backslope, shallow/steep) |
Roadway segment LOS was estimated using simplified procedures developed by Margiotta and Washburn (2017). The procedures are based on the Highway Capacity Manual (HCM; TRB 2016) procedures but employ a number of assumptions, primarily the K-factor value, to simplify the LOS computation for various roadway segment types.
To collect device offset, the research team developed a method to extract roadside hardware lateral offset distance using Google Street View images. Using available roadside hardware inventory data with known GPS location information, a developed MATLAB program fetches the associated Google Street View image. The program allows the user to change the orientation of the view to ensure the lane width and roadside hardware device are both visible. Using the image, the user indicates the endpoints of a known distance, typically lane width available from the roadway inventory data, directly on the image. The user then indicates the endpoints of a distance to be measured, such as the lateral offset of the roadside hardware device. The developed program uses the known distance to compute the lateral offset to the roadside hardware device shown. The method has been used to estimate longitudinal barrier lateral offset along selected routes in Washington State, specifically the lateral offset measurements for the available w-beam guardrail, cable barrier, and impact attenuator inventory information. Based on approximately 15 local sites, the lateral offset measured using this method was within 12% of the actual lateral offset distance.
The team attempted a similar approach to visually categorize roadside slope based on the original RDG slope cutoffs for traversable (1V:4H or flatter), non-recoverable (between 1V:4H and 1V:3H), and critical (steeper than 1V:3H). Using the same local sites mentioned above, the results
derived from this method were checked against the actual slope measured in the field. While the method was reasonable for very flat slopes and very steep slopes, the intermediate classification was inconsistent. Given the limited resources of the project and the extensive simulation for roadside slopes and roadside ditches conducted as part of NCHRP Project 17-55 (Sheikh et al. 2019) and NCHRP Project 16-05 (Sheikh et al. 2020), the team made no further efforts to collect roadside slope as part of this project.
Maintenance Data
Table 21 lists the required state maintenance data. For each roadside hardware type, the location, date, and activity description (e.g., to distinguish damaged hardware repair from other maintenance activities) was needed to link the maintenance data with associated crash and inventory records. Depending on the state agency procedures, maintenance and inventory data could have been combined. If available in a given state, existing links between documented roadside hardware repairs and police-reported crashes were used.
Table 21. Summary of Maintenance Data Needed
| Data Category | Data Element | Purpose/Notes |
|---|---|---|
| General | Location of maintenance | Provide information to link to crash and roadway data. Can be Route/Milepost or GPS location format. |
| Maintenance activity type | Distinguish between crash damage repairs from other maintenance activities. | |
| Damage/Repair date | Provide information to link to crash and roadway data. Can be damage observation date, repair date, or both. | |
| Police report link (optional) | Provide direct link to crash data. Can be a binary field (yes/no) or the provision of the police report reference. | |
| Device | Device type | Identification of device type repaired. |
In general, the available maintenance data for Washington State were the most complete for use in the current study, including identified matches to available police-reported crashes. Ultimately, the maintenance data from Iowa did not provide sufficient detail to identify unreported crashes with reasonable confidence. While the Iowa maintenance records provided some indication of equipment and materials needed for the repair, there was no direct linkage to a specific roadside device, and often repairs to multiple devices in a roadway segment were grouped into a single maintenance record. For Tennessee, the data were sufficient only with regard to sign repairs.
In-Depth Crash Data
Four different in-depth crash datasets were included in the NCHRP 17-88 database: NCHRP 17-43, LTCCS, MCCS, and NCRHP 22-26. The NCHRP 17-43 database cases were extracted from NASS/CDS, a dataset collected by NHTSA. LTCCS was also collected by NHTSA, while MCCS was collected by FHWA. The NCHRP 22-26 database was collected by Virginia Tech.
Crash Data
The in-depth crash data sources included the most comprehensive crash information of all data sources included in the NCHRP 17-88 database. These included detailed crash scene diagrams, scene photographs, vehicle photographs, and occupant injury information. This information allowed the research team to extract the trajectory of the vehicle after departing the roadway and estimate impact speeds for passenger vehicles.
Inventory Data
Because the in-depth crash data was collected by NHTSA and therefore focused on the vehicle, only basic information was available on the road and roadside hardware. Unfortunately, NHTSA does not provide the latitude or longitude of the crashes sampled in NASS/CDS, LTCCS, or MCCS. This prevented the research team from making any linkage to dedicated road and inventory datasets. Instead, the road and roadside geometry were extracted from the scaled scene diagrams or estimated from the scene photographs.
Naturalistic Data
Crash Data
The naturalistic driving data was extracted from SHRP 2. The primary advantage to this dataset was its ability to capture encroachments that did not result in a crash. From SHRP 2, the detailed encroachment trajectory data were recorded. However, because these encroachments typically do not result in a crash, there was no information to collect regarding an impacted object or an impact speed.
Inventory Data
Each encroachment event was joined by the road segment identifier to the RID. The SHRP 2 RID contains basic information about the roads traversed by a SHRP 2 study vehicle. The SHRP 2 RID does contain information on whether there are roadside barriers present, but it does not specify their location.
3.2.5 Data Element Catalog
This section presents a proposed data element catalog that combines the elements identified in the Data Element Needs section with the potential sources of data for each element from the databases described in the Data Sources section. We have divided the data element catalog into five tables: (1) case table, (2) roadway description table, (3) roadside description table, (4) event table, and (5) vehicle trajectory table. Case ID fields were presented in each of the five tables so that the tables can be appropriately linked, as described below.
- Case Table. The case table presented in Table 22 will provide a case identifier, which allows linkage to the underlying dataset (e.g., NASS/CDS, LTCCS, MCCS, or SHRP 2). Driver pre-crash actions and occupant injury outcomes have also been included in this table for compactness.
- Roadway Description Table. The roadway table presented in Table 23 will describe the characteristics of the roadway at the point of encroachment with data elements such as number of lanes, horizontal alignment, and posted speed limit.
- Roadside Encroachment Conditions Table. The roadside encroachment conditions table presented in Table 24 will describe the characteristics of the roadside at the point of encroachment. In cases in which a vehicle undergoes multiple departures, a separate roadside record will be included for each departure. For example, if a vehicle dropped a wheel off the
- right side of the road, over-corrected, and then departed on the left side of the road, the roadside encroachment conditions table would include two entries for this incident, that is, one record for the right-side departure and one record for the left-side departure.
- Event Table. The event table presented in Table 25 will provide an array of coordinates and angles of recorded event(s) from the point of departure to the object or objects struck. Cases will describe the object(s) struck and the coordinates of impact events, along with general and specific horizontal damage that occurred during the collision. For example, if a vehicle departed the road, impacted with two trees, and then struck a building coming to final rest, the vehicle’s path off-road would be recorded as four events: (1) impacted the first tree, (2) impacted the second tree, (3) struck a building, and (4) the vehicle coming to a final rest. For this study, a vehicle only departing, partially departing, or re-entering does not count as an event, as we are only analyzing crash event(s) that occur during the encroachment.
- Encroachment Trajectory Table. The encroachment trajectory table presented Table 26 in will provide an array of coordinates from the point of departure either to the object struck or to the point of roadway re-entry. In cases in which multiple objects are struck after departure, a separate trajectory record will be included between each object struck. For example, if a vehicle departed the road, sideswiped a tree, and then struck a utility pole before coming to final rest, the vehicle’s path off-road would be recorded as a sequence of three trajectories: (1) from the point of departure to the tree, (2) from the tree to the utility pole, and (3) from the utility pole to the point of final rest.
The key fields “Source,” “Case Identifier,” “Vehicle Number,” and “Component” are provided in each table to allow these five tables to be linked. In addition, the case table provides the “Data Source” element, which allows linkage to the source of the underlying data (i.e., NASS/CDS, LTCCS for large trucks, MCCS for motorcycles, state data by state name, and SHRP 2). This mechanism allows the analysis to link in, for example, the detailed description of each occupant (age, gender, and belt use) and the resulting injury outcomes by body region in NASS/CDS, LTCCS, and MCCS.
NASS/CDS, LTCCS, and MCCS provided many of the data elements needed for this project. However, these databases were primarily focused on crashworthiness and injury outcomes. Specialized roadside-oriented data elements (e.g., roadside geometry and run-off road trajectories) were not collected. These data were extracted, however, by examining and analyzing the crash scene diagrams and crash site photos. This process was fairly time consuming, but the research team has used this approach successfully to construct the NCHRP 17-43 database. Our plan was to use this same methodology to mine roadside elements for large trucks from the LTCCS and for motorcycles from the MCCS. In the discussion that follows, encroachment data extracted from LTCCS scene diagrams and photos will be denoted by “LTCCS-ED.” Encroachment data extracted from MCCS scene diagrams and photos will be denoted by “MCCS-ED.”
The state data shown in the tables that follow were obtained by merging the state accident data, state maintenance data, and state inventory data. The state data were primarily used to determine the frequency of unreported roadside departures. The state data did not include trajectories or reconstructions needed for updates to the RDG or MASH. The research team considered using police accident reports, which frequently have sketches of the crash. However, only in rare cases (typically fatal crashes) are these sketches to scale and suitable for use in an update to the RDG or MASH.
Table 22. Case Table: Data Element Summary and Data Source Mapping
| Data Element | Description/Notes | NCHRP 17-43 | LTCCS-ED | MCCS-ED | NCHRP 22-26 | IA State Data | WA State Data | TN State Data | SHRP 2 NDS | SHRP 2 RID | NASS/CDS | LTCCS | MCCS |
|---|---|---|---|---|---|---|---|---|---|---|---|---|---|
| Case Identifier | Case number or encroachment identifier | X | X | X | X | X | X | X | X | X | X | X | X |
| Data Source | Data Source for case (NCHRP 17-43, LTCCS, MCCS, SHRP 2, RID, EDR, or specific state) | X | X | X | X | X | X | X | X | X | X | X | X |
| Date | Date of event (day of the week for some databases) | X | X | X | X | X | X | X | |||||
| Police Reported | Binary (yes or no) | X | X | X | X | X | X | X | X | X | X | ||
| Time | Encroachment time of day | X | X | Police-reported only crashes | X | X | X | ||||||
| Vehicle Type | Car, light truck, motorcycle, heavy truck, bus | X | X | X | X | X | X | ||||||
| Driver Condition | Nominal, alcohol-involved, drowsy, asleep, distracted (if available) | X | X | X | X | X | X | X | X | ||||
| Driver Actions | Driver recovery/crash avoidance actions | X | X | X | X | X | X | ||||||
| Involvement of Another Vehicle | Binary (yes or no) | X | X | X | |||||||||
| Intentional Encroachment | Binary (yes or no) | X | X | ||||||||||
| Data Element | Description/Notes | NCHRP 17-43 | LTCCS-ED | MCCS-ED | NCHRP 22-26 | IA State Data | WA State Data | TN State Data | SHRP 2 NDS | SHRP 2 RID | NASS/CDS | LTCCS | MCCS |
|---|---|---|---|---|---|---|---|---|---|---|---|---|---|
| Crash Severity/Injury Severity | Maximum injury level in the vehicle - Abbreviated Injury Scale (preferred) or KABCO | X | X | X | X | X | X | X | |||||
| Weather | Weather at time of encroachment (sun, rain, snow) | X | X | X | X | X | X | X | |||||
| Roadway Lighting | Light at time of encroachment (day, night with illumination, night without illumination, dawn, dusk) | X | X | X | X | X | X | X | X | ||||
| Vehicle Type | Car, light truck, motorcycle, heavy truck, bus | X | X | X | X | X | X | ||||||
| Ramp Present | Binary (yes or no) | X | X | X | X | X | X | X | X | ||||
| Rolled over | Binary (yes or no) | X | X | X | X | X | X | X | X | X | X | ||
| Work Zone | Presence of work zone (yes, no) | X | X | X | X | X | X | X | X | X | |||
| Surface Condition | Condition of the roadway surface | X | X | X | X | X | X | X | X | X | X | ||
| Trailer Present | Indicates whether the vehicle was towing a trailer | X | X | X | X | X | X | X |
Table 23. Roadway Description Table: Data Element Summary and Data Source Mapping
| Data Element | Description/Notes | NCHRP 17-43 | LTCCS-ED | MCCS-ED | NCHRP 22-26 | IA State Data | WA State Data | TN State Data | SHRP 2 NDS | SHRP 2 RID | NASS/CDS | LTCCS | MCCS |
|---|---|---|---|---|---|---|---|---|---|---|---|---|---|
| Case Identifier | Case number or encroachment identifier | X | X | X | X | X | X | X | X | X | X | X | X |
| Roadway Identifier | Roadway name/designation where encroachment was observed | X | X | X | X | X | Omitted for privacy | Omitted for privacy | Omitted for privacy | ||||
| Lateral and Longitudinal Global Coordinate | Location of the event related to global coordinates | X | X | ||||||||||
| Encroachment Location | GPS, or Route/milepost | X | X | X | Omitted for privacy | Omitted for privacy | Omitted for privacy | ||||||
| Travel Direction | Compass direction of encroaching vehicle | X | X | X | X | X | X | X | X | X | |||
| Posted Speed Limit | Posted Speed Limit | X | X | X | X | X | X | X | Crashes/near-crashes | X | X | X | X |
| Advisory Speed Limit | Advisory Speed Limit | Crashes/near-crashes | X | ||||||||||
| Design Speed | Design Speed for roadway segment | ||||||||||||
| Traffic Volume | Vehicles per day on roadway segment | X | X | X |
| Data Element | Description/Notes | NCHRP 17-43 | LTCCS-ED | MCCS-ED | NCHRP 22-26 | IA State Data | WA State Data | TN State Data | SHRP 2 NDS | SHRP 2 RID | NASS/CDS | LTCCS | MCCS |
|---|---|---|---|---|---|---|---|---|---|---|---|---|---|
| Traffic Volume by Vehicle Type | Vehicle volume by vehicle type (i.e., vehicle mix) | X | |||||||||||
| Truck Percentage | Percentage of large trucks in traffic stream | X | X | X | |||||||||
| Number of Lanes | Number of lanes at point of departure | X | X | X | X | X | X | X | X | X | X | ||
| Lane Width | Width of lane where encroachment occurred | X | X | X | X | X | X | X | X | ||||
| Lane Markings | Lane marking type and color; right and left | X | X | X | X | X | |||||||
| Median Presence | Median presence: type (none, depressed, raised, flush, barrier) | X | X | X | X | X | X | X | X | X | |||
| Median Width | Distance between the two inner edges of the traveled way | X | X | X | X | X | X | X | |||||
| Horizontal Alignment | Horizontal Alignment at point of departure (curve/tangent or radius, length, direction/tangent) | X | X | X | X | X | X | X | X | X | X |
| Data Element | Description/Notes | NCHRP 17-43 | LTCCS-ED | MCCS-ED | NCHRP 22-26 | IA State Data | WA State Data | TN State Data | SHRP 2 NDS | SHRP 2 RID | NASS/CDS | LTCCS | MCCS |
|---|---|---|---|---|---|---|---|---|---|---|---|---|---|
| Vertical Alignment | Vertical Alignment at point of departure (qualitative or grade percent, direction; VC length for WA only) | X | X | X | X | X | X | X | X | ||||
| Road Access Control | Level of access control (full, partial, none) | X | X | X | X | X | X | X | X | X | |||
| Road Access Density | Access points per unit length of roadway | X | X | ||||||||||
| Horizontal Curve Radius | Horizontally curved roadway sections | X | X | X | X | X | X | X | |||||
| Land Use | Rural, suburban, urban | X | X | X | X | X | X | X | X | X | X | ||
| LOS | Quality of service for motor vehicle traffic | X | X | X | |||||||||
| Road Grade | Grade of roadway at the point of departure | X | X | X | X | X | X | X | X | X | X |
Table 24. Roadside Encroachment Conditions Table: Data Element Summary and Data Source Mapping
| Data Element | Description/Notes | NCHRP 17-43 | LTCCS-ED | MCCS-ED | NCHRP 22-26 | IA State Data | WA State Data | TN State Data | SHRP 2 NDS | SHRP 2 RID | NASS/CDS | LTCCS | MCCS |
|---|---|---|---|---|---|---|---|---|---|---|---|---|---|
| Case Identifier | Case number or encroachmen t identifier | X | X | X | X | X | X | X | X | X | X | X | X |
| Departure Number | Identifier of specific departure in cases with multiple departures | X | X | X | X | X | X | X | X | X | X | X | X |
| Departure Type | Indicates the type of crossing by encroaching vehicle | X | X | X | X | X | X | ||||||
| Vehicle Component Number | Differentiates between the cab and trailer(s) for large trucks and motorcycle and rider | X | X | X | X | X | |||||||
| CrossMedian Departure | Binary (yes or no) | X | X | X | X | X | X | X | |||||
| Roadside Cross Section | Foreslope and backslope of roadside/median at encroachmen t locations. Ditch width if available | X | X | X | X |
| Data Element | Description/Notes | NCHRP 17-43 | LTCCS-ED | MCCS-ED | NCHRP 22-26 | IA State Data | WA State Data | TN State Data | SHRP 2 NDS | SHRP 2 RID | NASS/CDS | LTCCS | MCCS |
|---|---|---|---|---|---|---|---|---|---|---|---|---|---|
| Additional Lane Type | Specifics if another lane was present in the scene | X | X | X | X | X | X | X | X | ||||
| Shoulder Type | Type of shoulder - pavement, gravel, earth (soil or grass), combined (2 or more surfaces) | X | X | X | X | X | X | X | X | ||||
| Shoulder Width | Width of shoulder | X | X | X | X | X | X | X | X | ||||
| Presence of Curbs | Binary (yes or no). Include type (perpendicula r or sloped) if available | X | X | X | X | X | X | X | X | ||||
| Road Grade | Grade of roadway at the point of departure | X | X | X | X | X | X | X | X | X | X | ||
| Clear Width | Lateral distance from the edge of the traveled way to the nearest roadside object | X | X | X | X |
| Data Element | Description/Notes | NCHRP 17-43 | LTCCS-ED | MCCS-ED | NCHRP 22-26 | IA State Data | WA State Data | TN State Data | SHRP 2 NDS | SHRP 2 RID | NASS/CDS | LTCCS | MCCS |
|---|---|---|---|---|---|---|---|---|---|---|---|---|---|
| Point of Departure Markings | Lane marking style at the point of departure | X | X | X | X | Crashes/Near-crashes | |||||||
| Soil Condition | Soil condition at POI (normal, muddy/waterlogged, frozen) | X | X | X | X | ||||||||
| Rumble Strip | Presence of rumble strip at POI (yes, no) | X | X | X | X | X | X | X | X | ||||
| Vehicle Departure Speed | Vehicle speed at the point of departure | X | X | X | |||||||||
| Departure Angle | Tangential angle of the roadway and departure trajectory | X | X | X | X | X | |||||||
| Departure Heading | Tangential angle of the roadway and vehicle orientation | X | X | X | X | X |
Table 25. Vehicle Event Table: Data Element Summary and Data Source Mapping
| Data Element | Description/Notes | NCHRP 17-43 | LTCCS-ED | MCCS-ED | NCHRP 22-26 | IA State Data | WA State Data | TN State Data | SHRP 2 NDS | SHRP 2 RID | NASS/CDS | LTCCS | MCCS |
|---|---|---|---|---|---|---|---|---|---|---|---|---|---|
| Case Identifier | Case number or encroachment identifier | X | X | X | X | X | X | X | X | X | X | X | X |
| Event Number | Number of crash event(s) occurred during encroachment | X | X | X | X | X | X | X | X | ||||
| Longitudinal Extent | Maximum longitudinal distance of encroachment in this trajectory segment | X | X | X | X | X | X | ||||||
| Lateral Extent | Maximum lateral distance of encroachment in this trajectory segment | X | X | X | X | X | X | ||||||
| Impact Point Position | Lateral and longitudinal distance between the departure point and impact point | X | X | X | X | ||||||||
| Impact Speed | Speed at which the vehicle struck the fixed object | X | X | Crashes |
| Data Element | Description/Notes | NCHRP 17-43 | LTCCS-ED | MCCS-ED | NCHRP 22-26 | IA State Data | WA State Data | TN State Data | SHRP 2 NDS | SHRP 2 RID | NASS/CDS | LTCCS | MCCS |
|---|---|---|---|---|---|---|---|---|---|---|---|---|---|
| Impact Angle | Angle between the vehicle longitudinal axis and the fixed object orientation | X | X | X | X | Crashes | |||||||
| Impact Heading | Tangential angle between vehicle orientation and roadway at the point of impact | X | X | X | X | X | |||||||
| General Area of Damage (GAD) | General area of damage due to the event | X | X | X | X | X | Crashes | X | X | ||||
| Specific Horizontal Location of Impact | Specific horizontal location (SHL) using SAE J224 definition. On front plane, for example, L=left corner, R=right corner, C=centerline, D=distributed damage | X | X | X | X | X | |||||||
| Type of Object Struck | Detail of object struck | X | X | X | X | X | X | X | X | X |
| Data Element | Description/Notes | NCHRP 17-43 | LTCCS-ED | MCCS-ED | NCHRP 22-26 | IA State Data | WA State Data | TN State Data | SHRP 2 NDS | SHRP 2 RID | NASS/CDS | LTCCS | MCCS |
|---|---|---|---|---|---|---|---|---|---|---|---|---|---|
| Breakaway | Indicates whether device was designed to breakaway | X | X | X | X | X | |||||||
| Object Clarification | Additional detail about object struck | X | X | X | X | X | X | X | |||||
| Object Offset | Lateral distance from road edge to object struck | X | X | X | X | Crashes | |||||||
| Object Influence | Object that influenced the encroachment (e.g., driver swerves to avoid a median obstacle) | X | X | X | X | X | X |
Table 26. Encroachment Trajectory Table: Data Element Summary and Data Source Mapping
| Data Element | Description/No tes | NCHRP 17-43 | LTCCS-ED | MCCS-ED | NCHRP 22-26 | IA State Data | WA State Data | TN State Data | SHRP 2 NDS | SHRP 2 RID | NASS/CDS | LTCCS | MCCS |
|---|---|---|---|---|---|---|---|---|---|---|---|---|---|
| Case Identifier | Case number or encroachment identifier | X | X | X | X | X | X | X | X | X | X | X | X |
| Departure Number | Identifier of specific departure in cases with multiple departures | X | X | X | X | X | X | X | X | X | X | X | X |
| Component Number | Differentiates between the cab and trailer(s) for large trucks and motorcycle and rider | X | X | X | X | X | |||||||
| Component Separation | Specifies if a cab and trailer or motorcycle and rider are separated | X | X | X | X | X | |||||||
| Event Number | Number of crash event(s) occurred during encroachment | X | X | X | X | X | X | X | X | ||||
| Trajectory Point Number | Number of trajectory point(s) occurred during an event | X | X | X | X | X | X |
| Data Element | Description/No tes | NCHRP 17-43 | LTCCS-ED | MCCS-ED | NCHRP 22-26 | IA State Data | WA State Data | TN State Data | SHRP 2 NDS | SHRP 2 RID | NASS/CDS | LTCCS | MCCS |
|---|---|---|---|---|---|---|---|---|---|---|---|---|---|
| Trajectory Point Position | Lateral and longitudinal distance between the point of departure and trajectory point | X | X | X | X | X | X | ||||||
| Trajectory Point Heading | Tangential angle between vehicle orientation and roadway at the point of impact | X | X | X | X | X | |||||||
| Tracking Condition | Describes the vehicle’s stability at the point of departure | X | X | X | X | X | X | X | |||||
| Brake Extent | Estimated extent of braking, distance during trajectory segment | X | X | X | X | X | |||||||
| Rollover | Binary (yes or no) | X | X | X | X | X | X | X | Crashes | X | X | X |
3.2.6 Database Format
Existing encroachment datasets have been stored in several formats varying from text to Oracle to data analytics packages such as Statistical Analysis Software (SAS). This array of formats complicates the use of these encroachment data and their linkage with other databases, such as the Fatality Analysis Reporting System, NASS/CDS, and NASS/General Estimates System (GES). All national and many state files are stored in the widely used SAS format. The NCHRP17-88 dataset is available in SAS format for data specialists and in Excel format for more casual users.
3.2.7 Database Size
Table 27 presents the number of encroachments by encroachment type (police-reported, unreported collisions, and encroachments without collision) in the NCHRP 17-88 encroachment database. The distribution is further broken down by data source. In total, there are data for more than 100,000 encroachment events spanning all three encroachment categories.
Table 27. Estimated Encroachment Database Size
| Data Source | 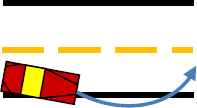 | 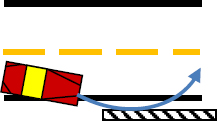 |  |
|---|---|---|---|
| A) Encroachments without collision | B) Encroachments with unreported collision | C) Encroachments with police-reported collision | |
| NCHRP 17-43 | - | - | 1,581 |
| LTCCS | - | - | 124 |
| MCCS | - | - | 47 |
| NCHRP 22-26 | - | - | 21 |
State Data | - | 3,536 3,536 - - | 84,713 43,964 26,026 14,723 |
| Data Source | | | |
|---|---|---|---|
| A) Encroachments without collision | B) Encroachments with unreported collision | C) Encroachments with police-reported collision | |
| SHRP 2 | 14,480 | - | - |
3.3 Selection of Representative Segments from Available State Agency Partner Data
The NCHRP 17-88 encroachment database includes data on individual encroachments, including reported and unreported encroachments/crashes determined from available state agency partner crash and maintenance data. As project funding did not allow inclusion of all encroachments/crashes from all roadway segments within the three participating states, representative roadway sections from each of the three states were selected. The following sections provide additional details on how the research team intends to select representative roadway segments for inclusion of associated encroachments in the NCHRP 17-88 encroachment database.
3.3.1 Objective and Approach
The overall goal was to select roadway segments that represent a wide range of roadway, roadside, and traffic characteristics. The overall approach was as follows:
- Determine range of roadway, roadside, and traffic characteristics.
- Identify range of roadway, roadside, and traffic characteristics based on the intended uses of the NCHRP 17-88 data, including potential updates to the HSM, RDG, MASH, and RSAP.
- Identify primary roadway classifiers used by the HSM and recent/ongoing HSM-related research projects, such as NCHRP Projects 17-45 and 17-54.
- Compare characteristics from Part (a) and (b) to proposed data elements to be collected for the NCHRP 17-88 database to identify any additional characteristics for potential consideration.
- Evaluate potential route selection schemes and select appropriate scheme.
- Use selection scheme to select roadway segments.
- Evaluate coverage of roadway, roadside, and traffic characteristics.
- Select additional sections as necessary.
3.3.2 Determination of Range of Roadway, Roadside, and Traffic Characteristics
As the encroachment data from NCHRP Project 17-88 are intended to be used to update portions of the AASHTO RDG (AASHTO 2011), the selected roadway segments should, at a minimum, cover the range of characteristics set forth in the relevant RDG table. The relevant RDG table is Table 5-10, Suggested Runout Lengths. Table 28 lists the roadway characteristics from this RDG table. Note that each combination of the available categories was present in the RDG table; for example, the 30 mph design speed has each of the four ADT categories, the 40 mph design speed has each of the four ADT categories, and so forth. The primary characteristics present are design speed and traffic volume.
Table 28. Roadway Characteristic Categories Based on Relevant RDG Table
| Table 5-10, Suggested Runout Lengths for Barrier Design | ||||
|---|---|---|---|---|
| Design Speed (mph) | Under 1,000 veh/day | 1,000 to 5,000 veh/day | 5,000 to 10,000 veh/day | Over 10,000 veh/day |
| 30 | 70 | 80 | 90 | 110 |
| 40 | 100 | 110 | 130 | 160 |
| 50 | 150 | 160 | 190 | 230 |
| 60 | 200 | 210 | 250 | 300 |
| 70 | 250 | 290 | 330 | 360 |
| 80 | 330 | 380 | 430 | 470 |
Encroachment data collected under NCHRP 17-88 were also intended to support updates to the AASHTO MASH (AASHTO 2016), specifically the MASH crash test conditions. The data available from the three participating states, however, will not include vehicle departure/impact speed or vehicle departure/impact angle. Thus, the state data contained in the NCHRP 17-88 database cannot be used to update MASH crash test conditions, and MASH data needs will not be explicitly considered in the selection of representative roadway sections.
Encroachment data collected under NCHRP 17-88 could also be used to support updates to RSAP. SAP was a benefit-cost analysis program used to evaluate different roadside designs (Ray et al. 2012). A critical component of this analysis was the estimate of the frequency and severity of oadside crashes, which was based on an estimate of encroachments. To estimate encroachments, SAP uses a “base” encroachment rate that varies by roadway type and traffic volume. This “base” ncroachment rate was then adjusted according to roadway characteristics (e.g., lane width, access ensity) and roadside characteristics (e.g., roadside slope). Table 29 summarizes the categories or alue ranges currently present in RSAP for the “base” encroachment rates and adjustment factors.
| Roadway Characteristic | Categories / Value Range |
|---|---|
| Roadway Type | 2-lane undivided 4-lane divided One-way/ramp |
| ADT (vpd) | 1,000 to 145,000 (increments of 1,000) |
| Access Density (points/mi) | 0 to 48 (increments vary, but adjustment only varies for access density values from 0 to 6) |
| Rumble Strip Presence | Yes/No |
| Number of Lanes (one direction) | 0 to 6 |
| Posted Speed Limit (mph) | 15 to 75 (5 mph increments) |
| Lane Width (ft) | 9 to 12 (1 ft increments) |
| Shoulder Width (ft) | 0 to 12 (1 ft increments) |
| Terrain Type | Flat Rolling Mountainous |
| Vertical Grade (%) | -6 to +6 (increments of 3%) |
| Horizontal Curve Radius (ft) | ≤ 950 951 - 1910 > 1910 |
| Roadside Slope (negative and positive) | 1V:2H 1V:3H 1V:4H 1V:6H 1V:10H Flat |
The HSM (AASHTO 2010) provided a framework to predict crashes for roadway sections and intersections based primarily on roadway and traffic characteristics. Crash prediction was accomplished through the use of safety performance functions (SPFs) developed for various roadway types. Roadway classifications used by the HSM are shown in Table 30 and primarily include land use (e.g., rural or urban) and roadway configuration (e.g., undivided or divided). Note that the HSM does not distinguish between urban and suburban land use types and includes suburban land use within the urban classification. The first edition of the HSM did not include controlled access freeways, but procedures have been developed under NCHRP Project 17-45
(Bonneson et al. 2012); the associated freeway types have been included in Table 30. Although not explicitly present in Table 30, there was some degree of access control considered in this classification scheme, as the freeways and associated ramps typically have full access control while the other roadway classes generally have either partial or no access control.
Table 30. Roadway Types Considered in the HSM Predictive Methodology
| Land Use | Roadway Segment Configuration | |
|---|---|---|
| Undivided | Divided | |
| Rural | 2-lane, two-way Multilane highway (4 lane) Ramp segments (1-2 lane) | Multilane highway (4 lane) 4-lane freeway 6-lane freeway 8-lane freeway |
| Urban (suburban) | Arterial (2 – 5 lanes) Ramp segments (1-2 lane) | Arterial (2 – 5 lanes) 4-lane freeway 6-lane freeway 8-lane freeway 10-lane freeway |
The current HSM also does not include specific procedures for predicting ROR crashes. Procedures specific to ROR crashes were developed under NCHRP Project 17-54 (Carrigan and Ray 2018). Similar to the original HSM procedures, the proposed draft procedures involve ROR SPFs specific to different roadway types. The currently proposed NCHRP Project 17-54 ROR SPFs follow the same overall scheme depicted in Table 30 with four different ROR SPFs (i.e., rural undivided, rural divided, urban undivided, and urban divided).
The roadway characteristics relevant to the RDG, RSAP, and HSM (i.e., Table 28, Table 29, and Table 30) were then compared to the roadway, traffic, and roadside related data elements present in the proposed NCHRP 17-88 data element catalog. This comparison allowed the identification of any data elements present in the proposed NCHRP 17-88 data element catalog but not listed (or implied) in Table 28, Table 29, or Table 30. The identified data elements could also be considered in the roadway selection process and are listed in Table 31.
| Roadway Characteristic | Description / Notes |
|---|---|
| Shoulder Type | Asphalt, Concrete, Gravel, Soil, Turf |
| Median Presence | None, Depressed, Raised, Flush, Barrier |
| Median Width | Distance between the two inner edges of the traveled way in meters |
| Curb Presence | Yes/No |
| Curb Type | Vertical, Sloped |
| LOS | A thru F |
| Roadside Cross Section | Foreslope and backslope of roadside/median |
| Roadside Hardware Presence | Count (point objects) or total length (line objects) |
| Vehicle Volume by Type | Differentiate passenger cars from heavy trucks at a minimum |
Table 32 presents the composite list of roadway, traffic, and roadside characteristics and associated ranges based on the intended uses of the NCHRP 17-88 data, the HSM roadway classifiers, and a comparison to the proposed NCHRP 17-88 collected data elements. The associated data need source for each element is noted along with availability. Note that a “Y” in the available column denotes that the data element was widely available for all three states and could be used as a filter for selection of roadway segments. A “P” in the availability column indicates that the data element was widely available in one or two of the states but not all three. An “N” indicates that the data element was not widely available in any of the three states. Note that availability was different from whether the data element would have been collected; for example, roadside slope was not widely available but could have been collected for all or a subset of the selected roadway segments.
Table 32. Composite List of Roadway, Traffic, and Roadside Characteristics and Availability
| Characteristic | Potential Range/Categories | Data Needs | Available? |
|---|---|---|---|
| Roadway Type (Access Control) | Freeway (Full) 2-lane / 2-way roadways (Partial/no) Multi-lane highways (Partial/no) Arterials (Partial/no) Ramp segments (N/A) | HSM, RSAP | Y |
| Number of Lanes (Roadway Type) | 4, 6, 8, 10 (Freeway) 2, 3, 4 (2-lane/2-way; 3 or 4 lanes for short sections with one or two passing lanes present) 4 (Multi-lane highways) 2, 3, 4, 5 (Arterials) 1, 2 (Ramps) | HSM, RSAP | Y |
| Area Type (Applicable Roadway Types) | Rural (2-lane/2-way, Multilane, Freeway, Ramps) Urban (Arterial, Freeway, Ramp) | HSM | Y |
| Median | Divided Undivided | HSM | Y |
| Median Type | None, Depressed, Raised, Flush, Barrier | 17-88 | Y |
| Median Width | < 30 ft 30 – 50 ft 50 – 80 ft > 80 ft | 17-88 | Y |
| Traffic Volume | 1,000 – 145,000 vehicles/day | RDG, RSAP | Y |
| Traffic Volume by Type | Percent heavy trucks at a minimum | 17-88 | P |
| Design Speed | 30 – 80 mph | RDG | N |
| Posted Speed | 15 – 75 mph | RSAP | Y |
| Access Density | 0 – 48 driveways/mile | RSAP | P |
| Lane Width | 9 to 12 ft | RSAP | Y |
| Shoulder Width | 0 to 12 ft | RSAP | Y |
| Shoulder Type | Paved or unpaved | 17-88 | Y |
| Characteristic | Potential Range/Categories | Data Needs | Available? |
|---|---|---|---|
| Rumble Strip Presence | Yes/No | RSAP | Y |
| Roadside Slope | 1V:6H (or flatter) 1V:5H to 1V:4H 1V:3H (or steeper) | RSAP | N |
| Horizontal Alignment | Tangent section Horizontal curve (radius ≤ 950 ft) Horizontal curve (radius 951 to 1910 ft) Horizontal curve (radius > 1910 ft) | RSAP | P |
| Vertical Grade/Terrain Type | Level (≤ 3%) Moderate (3% < grade ≤ 6%) Steep (> 6%) | RSAP | P |
| Curb Presence (Type) | Yes/No (Vertical / Sloped) | 17-88 | P |
| LOS | A thru F | 17-88 | P |
| Roadside Hardware Presence | Count (point objects) or total length (line objects) | 17-88 | P |
3.3.3 Evaluation of Potential Route Selection Schemes
The research team considered several route selection schemes for potential use in the current project. These schemes are listed below along with a brief description of each, followed by a discussion of possible associated advantages and disadvantages.
- Random selection of segments – Randomly selected segments from all available segments within a particular state.
- Random selection based on ROR crash characteristics – Randomly selected segments from a subset of all available segments. Determine the subset of segments for each state based on ROR crash frequency (e.g., a high number of ROR crashes).
- Random selection within primary roadway categories – Categorize all the available roadway segments within a state using the HSM roadway classifiers shown in Table 30. Randomly selected some number of roadway segments from each of the 12 (excluding ramps) distinct roadway types listed.
- Selection within primary roadway categories – Categorize all the available roadway segments within a state using the HSM roadway classifiers shown in Table 30. Selected some number of routes from each of the 12 distinct roadway types (excluding ramps) listed. Use all roadway segments for each selected route.
While random selection of roadway segments (Option 1) would produce a representative sample of roadway sections within each state, the method would not necessarily produce the requisite range of roadway, traffic, and roadside characteristics sought in the current project. Selection based on ROR crash characteristics (Option 2) would likely generate the highest number of encroachment data points to add to the NCHRP 17-88 encroachment database but would bias the included roadway segments to those that have a higher ROR crash experience. Random selection within the primary roadway categories (Option 3) would ensure representation across a variety of
roadway types but still may not necessarily produce the requisite range of roadway, traffic, and roadside characteristics sought.
A practical issue with any of the random selection of segment options (Options 1 – 3) relates to the acquisition of associated maintenance data. Each state maintains a database, or multiple databases, that must be queried, generally by route number, to generate the needed maintenance data. Any type of random selection would likely generate many different route numbers, and potentially some number of sections from all available routes, to be queried by the state DOT personnel (i.e., the research team does not have access to the entire dataset). In addition, roadway segments are generally very short; for instance, the approximately 300 miles of Washington State Route 2 is comprised of more than 1,800 roadway segments, each with homogeneous characteristics. Based on the initial matching of crash and maintenance data, longer segments are preferable, as the crash and maintenance location may differ slightly for matches; that is, the match could be missed if it is technically on a different segment and that different section was not selected for inclusion.
Selection of roadway segments within the primary roadway categories (Option 4) ensured representation across a variety of roadway types, minimized the number of routes to be queried for associated maintenance data, and allowed the selection of a combination of roadways that provide an adequate range of roadway, traffic, and roadside characteristics. As each of the three states will have a different spectrum of roadway, roadside, and traffic characteristics, this method would allow routes to be selected from each of the states to maximize the range of characteristics included in the NCHRP 17-88 database.
3.3.4 Use Selection Scheme to Select Roadway Segments
Using the Option 4 selection method described above, the research team selected the roadway segments as follows:
- For each state, categorize all available roadway segments based on the HSM classification scheme presented in Table 30 (i.e., using land use and roadway configuration). Determine count of different route numbers and associated mileage of roadways that fall into each possible category (excluding ramps). A single route designation may span multiple classifications, so the mileage associated with each classification will provide additional context for the selection process.
- Assess the ranges of secondary variables (i.e., all other widely available variables not used to determine HSM classification) for roadway sections in each category. Select route numbers for inclusion.
Table 33 illustrates how the composite list of variables (originally shown in Table 32) was incorporated into the route selection process. The primary variables were used in Step 1 to determine route classification. For each state, one route representing each of the possible 12 categories was selected. Ramps selected for inclusion were a census of the ramps for the associated controlled access freeways selected in each state. The secondary variables were used in Step 2 to ensure an adequate range of characteristics were captured by the routes ultimately selected for inclusion in the project. The first priority in the selection of routes in Step 2 was to span the needed posted speed and traffic volumes needed to update the relevant RDG table, shown in Table 28. Secondary priorities were to maximize the range of the other available secondary variables (i.e., other than posted speed and traffic volume), provide adequate coverage of encroachment modifier
ranges in RSAP (Table 29), and provide additional data in gap areas identified by the critical literature review, such as traffic volumes greater than 40,000 vehicles per day. Tertiary variables are those not widely available at the time of route selection and thus were not used directly to select routes from all three states.
Table 33. Roadway, Traffic, and Roadside Characteristics Used in the Roadway Selection Process
| Characteristic | Variable Type |
|---|---|
| Roadway Type (Access Control) | Primary |
| Number of Lanes (Roadway Type) | |
| Area Type (Applicable Roadway | |
| Types) | |
| Median | |
| Median Type | Secondary |
| Median Width | |
| Traffic Volume | |
| Posted Speed | |
| Lane Width | |
| Shoulder Width | |
| Shoulder Type | |
| Rumble Strip Presence | |
| Traffic Volume by Type | Tertiary |
| Design Speed | |
| Access Density | |
| Roadside Slope | |
| Horizontal Alignment | |
| Vertical Grade / Terrain Type | |
| Curb Presence (Type) | |
| LOS | |
| Roadside Hardware Presence |
3.3.5 Selection Results
The described methodology resulted in the selection of the representative routes listed in Table 34. For each roadway subtype, the selected route is listed along with total length (classified as that specific roadway subtype) and MVMT for a 1-year period. Note that many available routes have portions classified as more than one roadway subtype. Routes marked with an asterisk (*) indicated the route had a non-zero length classified as the listed roadway subtype but was selected as a representative route for a different roadway subtype. As an example, Washington SR 2 was selected as the representative RU2L2W route but has portions classified as 2U/3T, 4U/5T, R4D, R4F, U4D, and U4F. As a result, SR 2 appears with an asterisk in all cases except the RU2L2W subtype. Also note that certain states had very limited or no routes available for certain roadway subtypes; for example, Washington State had no available U10F routes, so only routes from Tennessee and Iowa were selected for this subtype.
Table 34. Summary Results of State Agency Representative Route Selection
| Route Type | Subtype | State | Route | Length (mi) | MVMT (1 year) |
|---|---|---|---|---|---|
| Rural Undivided | RU2L2W | WA | SR 2 | 234.2 | 389.38 |
| SR 101* | 309.8 | 404.21 | |||
| SR 12* | 255.0 | 363.59 | |||
| SR 202* | 5.7 | 20.71 | |||
| TN | SR 69 | 125.4 | 147.03 | ||
| SR 1* | 207.9 | 394.89 | |||
| SR 33* | 74.9 | 132.32 | |||
| SR 34* | 36.3 | 44.01 | |||
| SR 15* | 28.5 | 62.56 | |||
| IA | SR 30 | 181.9 | 309.59 | ||
| SR 18* | 236.3 | 309.65 | |||
| SR 6* | 152.3 | 169.27 | |||
| SR 4* | 116.5 | 87.42 | |||
| SR 218* | 82.3 | 70.5 | |||
| SR 28* | 7.2 | 9.55 | |||
| RUMLH | TN | SR 33 | 30.0 | 138.23 | |
| SR 15 | 17.0 | 71.43 | |||
| SR 1* | 6.0 | 15.25 | |||
| SR 34* | 4.4 | 13.77 | |||
| IA | SR 4 | 20.8 | 8.95 | ||
| Urban Undivided | 2U/3T | WA | SR 202 | 20.3 | 95.19 |
| SR 2* | 19.2 | 103.88 | |||
| SR 12* | 11.8 | 34.80 | |||
| SR 101* | 17.2 | 65.64 | |||
| TN | SR 1 | 55.7 | 134.69 | ||
| SR 33* | 19.3 | 80.26 | |||
| SR 69* | 17.7 | 22.74 | |||
| SR 34* | 12.3 | 39.98 | |||
| SR 15* | 8.4 | 20.2 | |||
| IA | SR 6 | 16.6 | 40.01 | ||
| SR 30* | 8.4 | 28.05 | |||
| SR 18* | 10.8 | 23.09 | |||
| SR 218* | 5.7 | 9.32 | |||
| SR 4* | 3.7 | 3.72 | |||
| SR 28* | 1.8 | 6.26 | |||
| 4U/5T | WA | SR 99 | 9.7 | 101.35 | |
| SR 522 | 7.9 | 115.82 | |||
| SR 2* | 11.2 | 99.83 | |||
| SR 101* | 5.2 | 42.60 | |||
| SR 167* | 5.5 | 56.34 | |||
| SR 12* | 1.0 | 7.91 | |||
| TN | SR 1* | 79.1 | 589.29 |
| Route Type | Subtype | State | Route | Length (mi) | MVMT (1 year) |
|---|---|---|---|---|---|
| Urban Undivided | 4U/5T | SR 15* | 21.3 | 126.34 | |
| TN | SR 33* | 12.8 | 123.85 | ||
| SR 34* | 13.3 | 123.31 | |||
| SR 155* | 4.5 | 56.32 | |||
| SR 69* | 1.5 | 8.73 | |||
| IA | SR 18 | 10.4 | 32.98 | ||
| SR 6* | 13.6 | 83.81 | |||
| SR 30* | 5.2 | 22.48 | |||
| SR 218* | 3.3 | 14.94 | |||
| SR 28* | 1.8 | 11.69 | |||
| Rural Divided | R4D | WA | SR 8 | 19.5 | 120.50 |
| SR 101 | 15.7 | 125.31 | |||
| SR 2* | 32.1 | 131.70 | |||
| SR 12* | 6.5 | 19.18 | |||
| TN | SR 34 | 32.2 | 184.40 | ||
| SR 15* | 150.3 | 311.43 | |||
| SR 1* | 75.9 | 255.57 | |||
| SR 33* | 18.4 | 63.97 | |||
| IA | SR 218 | 77.2 | 315.47 | ||
| SR 30* | 71.2 | 257.39 | |||
| SR 18* | 15.8 | 60.2 | |||
| SR 6* | 6.6 | 21.16 | |||
| R4F | WA | I-90 | 203.6 | 1370.37 | |
| I-5* | 39.6 | 607.08 | |||
| SR 12* | 7.4 | 36.41 | |||
| SR 2* | 1.6 | 40.06 | |||
| TN | I-40 | 228.7 | 2949.65 | ||
| I-24* | 74.9 | 1257.85 | |||
| I-65* | 55.7 | 620.22 | |||
| IA | I-80 | 198.8 | 2074.07 | ||
| I-35* | 151.3 | 1154.92 | |||
| I-29* | 111.3 | 668.06 | |||
| I-380* | 35.9 | 329.21 | |||
| SR 18* | 21.2 | 67.18 | |||
| SR 218* | 12.1 | 70.57 | |||
| SR 30* | 4.9 | 20.13 | |||
| R6F | WA | I-5 | 57.6 | 1409.21 | |
| I-90* | 14.4 | 206.77 | |||
| TN | I-24 | 4.4 | 67.46 | ||
| I-40* | 16.0 | 390.56 | |||
| I-65* | 0.5 | 4.7 | |||
| IA | I-35 | 12.7 | 95.56 | ||
| I-80* | 13.7 | 147.17 | |||
| I-29* | 7.2 | 43.03 |
| Route Type | Subtype | State | Route | Length (mi) | MVMT (1 year) |
|---|---|---|---|---|---|
| Rural Divided | R6F | IA | SR 18* | 2.3 | 6.48 |
| I-380* | 1.6 | 12.48 | |||
| SR 30* | 1.1 | 4.32 | |||
| SR 218* | 0.9 | 4.10 | |||
| Urban Divided | U4D | WA | SR 12 | 28.5 | 154.11 |
| SR 99* | 16.1 | 208.08 | |||
| SR 2* | 7.0 | 57.58 | |||
| SR 101* | 6.0 | 56.01 | |||
| SR 522* | 1.9 | 25.35 | |||
| SR 8* | 1.1 | 6.93 | |||
| SR 167* | 0.9 | 11.92 | |||
| TN | SR 1* | 84.0 | 537.19 | ||
| SR 34* | 54.0 | 413.05 | |||
| SR 15* | 28.3 | 132.57 | |||
| SR 33* | 6.1 | 59.24 | |||
| SR 155* | 1.1 | 11.84 | |||
| SR 69* | 0.8 | 3.76 | |||
| IA | SR 28 | 5.1 | 34.24 | ||
| SR 6* | 18.6 | 144.07 | |||
| SR 30* | 18.5 | 88.40 | |||
| SR 18* | 2.3 | 9.13 | |||
| SR 218* | 2.0 | 9.57 | |||
| U4F | WA | SR 167 | 16.4 | 609.48 | |
| I-5* | 38.9 | 769.75 | |||
| I-90* | 20.8 | 274.83 | |||
| SR 12* | 13.6 | 102.75 | |||
| SR 522* | 10.4 | 138.18 | |||
| I-182* | 8.0 | 99.77 | |||
| SR 2* | 5.3 | 61.81 | |||
| SR 101* | 4.4 | 70.56 | |||
| SR 99* | 3.2 | 38.44 | |||
| TN | SR 386 | 11.6 | 247.56 | ||
| I-40* | 85.9 | 1431.65 | |||
| I-24* | 41.4 | 814.26 | |||
| I-65* | 19.3 | 455.84 | |||
| SR 155* | 11.2 | 190.57 | |||
| IA | I-29 | 8.3 | 82.11 | ||
| I-80* | 25.2 | 342.90 | |||
| I-380* | 13.5 | 219.33 | |||
| SR 218* | 8.2 | 74.88 | |||
| SR 30* | 10.1 | 72.21 | |||
| I-35* | 7.2 | 93.77 | |||
| SR 18* | 0.9 | 2.98 | |||
| U6F | WA | I-182 | 5.9 | 106.37 |
| Route Type | Subtype | State | Route | Length (mi) | MVMT (1 year) |
|---|---|---|---|---|---|
| Urban Divided | U6F | WA | I-5* | 75.8 | 3073.89 |
| I-90* | 31.5 | 1124.27 | |||
| I-405* | 11.3 | 672.02 | |||
| SR 167* | 1.1 | 46.04 | |||
| SR 101* | 1.0 | 29.99 | |||
| TN | I-240 | 7.5 | 296.89 | ||
| I-40* | 40.1 | 1311.22 | |||
| I-24* | 6.9 | 290.11 | |||
| I-65* | 5.4 | 204.57 | |||
| SR 155* | 2.1 | 43.77 | |||
| SR 386* | 0.9 | 23.64 | |||
| IA | I-380 | 5.0 | 92.30 | ||
| I-80* | 19.9 | 485.52 | |||
| I-35* | 5.4 | 109.36 | |||
| SR 30* | 3.1 | 24.36 | |||
| I-29* | 2.9 | 31.42 | |||
| SR 218* | 2.1 | 17.19 | |||
| U8F | WA | I-405 | 1.0 | 65.06 | |
| I-5* | 43.6 | 2858.95 | |||
| I-90* | 0.7 | 29.48 | |||
| TN | SR 155 | 3.7 | 134.14 | ||
| I-40* | 26.6 | 1101.21 | |||
| I-24* | 20.5 | 1041.28 | |||
| I-240* | 5.2 | 277.42 | |||
| I-65* | 15.0 | 767.03 | |||
| IA | I-235 | 3.3 | 131.61 | ||
| I-80* | 3.2 | 96.11 | |||
| I-35* | 2.6 | 67.81 | |||
| I-380* | 2.2 | 53.52 | |||
| SR 218* | 1.3 | 11.80 | |||
| I-29* | 0.3 | 3.00 | |||
| U10F | TN | I-65 | 7.3 | 396.77 | |
| I-40* | 9.7 | 572.97 | |||
| I-24* | 3.9 | 219.28 | |||
| I-240* | 3.0 | 167.81 | |||
| SR 155* | 2.8 | 100.88 | |||
| IA | I-235* | 0.9 | 39.89 | ||
| I-80* | 0.8 | 25.54 | |||
| I-380* | 0.6 | 17.13 | |||
| I-29* | 0.4 | 4.63 | |||
| SR 218* | 0.2 | 2.06 |
Additional details on the selection of representative routes for each roadway subtype can be found in Appendix B. For each roadway subtype, the Appendix contains a full report of the available
routes and associated characteristics from each of the three states and a rationale for the selection of the representative routes.
For each roadway subtype, Table 35 summarizes the ranges of operational and geometric roadway characteristics for the selected routes across all three states. Overall, there was a wide range of traffic volumes from less than 10,000 vehicles per day to over 200,000 vehicles per day. Similarly, there was a wide variation in posted speed limit, shoulder width, and median width.
Table 35. Summary Characteristics of Selected Routes by Route Type and Subtype
| Route Type | Subtype | Min / Max AADT (vpd) | Min / Max Posted Speed (mph) | Min / Max Shoulder Width (ft) | Min / Max Median Width (ft) |
|---|---|---|---|---|---|
| Rural | RU2L2W | 5 / 26,543 | 20 / 70 | 0 / 40 | -- |
| Undivided | RUMLH | 480 / 20,850 | 30 / 70 | 0 / 20 | -- |
| Urban | 2U/3T | 60 / 39,042 | 25 / 60 | 0 / 28 | -- |
| Undivided | 4U/5T | 2,530 / 63,660 | 20 / 60 | 0 / 24 | -- |
| Rural | R4D | 410 / 23,900 | 20 / 70 | 0 / 41 | 2 / 400 |
| Divided | R4F | 1,060 / 78,176 | 20 / 70 | 0 / 20 | 2 / 800 |
| R6F | 3,270 / 128,331 | 55 / 70 | 0 / 22 | 2 / 551 | |
| Urban Divided | U4D | 410 / 82,564 | 20 / 70 | 0 / 24 | 2 / 160 |
| U4F | 7,600 / 183,350 | 20 / 70 | 0 / 40 | 2 / 700 | |
| U6F | 5,700 / 242,028 | 45 / 70 | 0 / 46 | 2 / 700 | |
| U8F | 11,300 / 239,490 | 35 / 70 | 0 / 36 | 2 / 450 | |
| U10F | 20,900 / 212,690 | 55 / 70 | 0 / 24 | 2 / 540 |
3.3.6 Iowa State Representative Routes and Data
A total of 11 routes were selected from Iowa for inclusion, as summarized in Table 36. The table includes the total length of each route and a single year representation of traffic flow in units of MVMT. For each route, Table 36 shows the proportion of the total roadway length in each general HSM roadway type category.
Table 36. Summary Characteristics of Selected Iowa State Routes
| Route Designation | Total Length (mi) | Single Year MVMT | Roadway Type (% of total length) | |||
|---|---|---|---|---|---|---|
| Rural Undivided | Urban Undivided | Rural Divided | Urban Divided | |||
| I-29 | 130.4 | 832.25 | 0 | 0 | 91 | 9 |
| I-35 | 179.2 | 1521.42 | 0 | 0 | 92 | 8 |
| I-80 | 261.6 | 3171.31 | 0 | 0 | 81 | 19 |
| I-235 | 4.2 | 171.50 | 0 | 0 | 0 | 100 |
| I-380 | 58.8 | 723.97 | 0 | 0 | 64 | 36 |
| SR 4 | 141 | 100.09 | 97 | 3 | 0 | 0 |
| SR 6 | 207.9 | 460.14 | 73 | 15 | 3 | 9 |
| SR 18 | 300 | 511.69 | 79 | 7 | 13 | 1 |
| SR 28 | 15.9 | 61.74 | 45 | 23 | 0 | 32 |
| SR 30 | 304.6 | 570.59 | 60 | 5 | 25 | 10 |
| SR 218 | 195.3 | 600.40 | 42 | 5 | 46 | 7 |
Table 37 provides a comparison of the crash characteristics for the NCHRP 17-88 selected Iowa routes to all similarly classified routes in the entire state. For the selected Iowa routes of a given route type/subtype, the average crash rate was determined by summing the crash rate multiplied by the corresponding MVMT for each selected route and then dividing by the total MVMT for the same routes. A similar procedure was followed to determine the weighted ratio of fixed object crashes to total crashes. For each route type, the rightmost columns in Table 37 show the crash rate and fixed object to total crash ratio for all the similarly classified Iowa routes available. Note that by design, our approach for selected roadways prioritized a range of roadway and traffic characteristics over selecting a sample of roadways that was simply representative of the roadways statewide. The rationale for this was to be sure that we were capturing encroachment crashes across the widest variety of roadway and traffic conditions, as previous encroachment data were somewhat limited in this regard, especially relative to traffic volumes. Based on the available data, however, the selected Iowa routes have relatively similar crash characteristics to the correspondingly classified routes across the entire state. This was especially true for the rural undivided roadways. In general, the selected urban undivided, rural divided, and urban divided roadways have higher overall crash rates compared to all similarly classified roadways across the state.
| Route Type | Subtype | Sample Length [mi] | Total MVMT (1 year) | All Crashes (3 yrs) | Fixed Object Crashes (3 yrs) | Selected Routes | Entire State | ||
|---|---|---|---|---|---|---|---|---|---|
| VMT-Weighted Fixed Object to All Crash Ratio | VMT-Weighted Crash Rate | Fixed Object to All Crash Ratio | Crash Rate | ||||||
| Rural Undivided | RU2L2W | 776.5 | 955.98 | 2408 | 303 | 0.12 | 0.84 | 0.14 | 0.83 |
| RUMLH | 20.8 | 8.95 | 13 | 2 | 0.15 | 0.48 | |||
| All | 797.3 | 964.93 | 2421 | 305 | 0.12 | 0.84 | |||
| 2U/3T | 47 | 110.45 | 723 | 54 | 0.07 | 2.18 | 0.06 | 2.87 | |
| Urban Undivided | 4U/5T | 34.3 | 165.9 | 1921 | 91 | 0.05 | 3.86 | ||
| 6U | 0.4 | 2.87 | 31 | 0 | 0.00 | 3.60 | |||
| All | 81.7 | 279.22 | 2675 | 145 | 0.06 | 3.19 | |||
| Rural Divided | R4D | 170.8 | 654.22 | 2063 | 250 | 0.12 | 1.05 | 0.20 | 0.49 |
| R4F | 535.5 | 4384.14 | 11478 | 2981 | 0.27 | 0.87 | |||
| R6F | 39.5 | 313.14 | 1100 | 290 | 0.27 | 1.17 | |||
| All | 745.8 | 5351.5 | 14641 | 3521 | 0.25 | 0.91 | |||
| Urban Divided | U4D | 46.5 | 285.41 | 2718 | 144 | 0.07 | 3.17 | 0.12 | 0.86 |
| U4F | 73.4 | 888.18 | 2700 | 639 | 0.25 | 1.01 | |||
| U6F | 38.4 | 760.15 | 1898 | 467 | 0.26 | 0.83 | |||
| U8F | 12.9 | 363.85 | 1289 | 259 | 0.21 | 1.18 | |||
| U10F | 2.9 | 89.25 | 360 | 55 | 0.21 | 1.34 | |||
| All | 174.1 | 2386.84 | 8965 | 1564 | 0.22 | 1.25 | |||
3.3.7 Washington State Representative Routes and Data
A total of 12 routes were selected from Washington State for inclusion, as summarized in Table 38. This included the total length of each route and a single year representation of traffic flow in units of MVMT. For each route, Table 38 shows the proportion of the total roadway length in each general HSM roadway type category.
Table 38. Summary Characteristics of Selected Washington State Routes
| Route Designation | Total Length (mi) | Single Year MVMT | Roadway Type (% of total length) | |||
|---|---|---|---|---|---|---|
| Rural Undivided | Urban Undivided | Rural Divided | Urban Divided | |||
| I-5 | 255.5 | 8718.88 | 0 | 0 | 38 | 62 |
| I-90 | 271.0 | 3005.72 | 0 | 0 | 80 | 20 |
| I-182 | 13.9 | 206.14 | 0 | 0 | 0 | 100 |
| I-405 | 12.3 | 737.08 | 0 | 0 | 0 | 100 |
| SR 2 | 310.6 | 884.24 | 75 | 10 | 11 | 4 |
| SR 8 | 20.6 | 127.43 | 0 | 0 | 95 | 5 |
| SR 12 | 323.8 | 718.75 | 79 | 4 | 4 | 13 |
| SR 99 | 29.0 | 347.87 | 0 | 33 | 0 | 67 |
| SR 101 | 359.3 | 794.32 | 86 | 6 | 4 | 4 |
| SR 167 | 23.9 | 723.78 | 0 | 23 | 0 | 77 |
| SR 202 | 26.0 | 115.90 | 22 | 78 | 0 | 0 |
| SR 522 | 20.2 | 279.35 | 0 | 39 | 0 | 61 |
Table 39 provides a comparison of the crash characteristics for the NCHRP 17-88 selected Washington routes to all similarly classified routes in the entire state. For the selected Washington routes of a given route type/subtype, the average crash rate was determined by summing the crash rate multiplied by the corresponding MVMT for each selected route and then dividing by the total MVMT for the same routes. A similar procedure was followed to determine the weighted ratio of fixed object crashes to total crashes. For each route type, the rightmost columns in Table 39 show the crash rate and fixed object to total crash ratio for all of the similarly classified Washington routes available.
| Route Type | Subtype | Sample Length [mi] | Total MVMT (1 year) | All Crashes (3 yrs) | Fixed Object Crashes (3 yrs) | Selected Routes | Entire State | ||
|---|---|---|---|---|---|---|---|---|---|
| VMT-Weighted Fixed Object to All Crash Ratio | VMT-Weighted Crash Rate | Fixed Object to All Crash Ratio | Crash Rate | ||||||
| Rural Undivided | RU2L2W | 804.7 | 1177.89 | 2910 | 754 | 0.26 | 0.82 | 0.25 | 1.04 |
| RUMLH | Not Applicable (no suitable RUMLH routes available) | ||||||||
| All | 804.7 | 1177.89 | 2910 | 754 | 0.26 | 0.82 | |||
| Urban Undivided | 2U/3T | 68.5 | 299.51 | 1700 | 143 | 0.09 | 1.89 | 0.07 | 3.10 |
| 4U/5T | 40.5 | 423.85 | 3753 | 213 | 0.06 | 2.95 | |||
| 6U | 14.7 | 197.78 | 3041 | 117 | 0.04 | 5.13 | |||
| All | 123.7 | 921.14 | 8494 | 473 | 0.07 | 3.07 | |||
| Route Type | Subtype | Sample Length [mi] | Total MVMT (1 year) | All Crashes (3 yrs) | Fixed Object Crashes (3 yrs) | Selected Routes | Entire State | ||
|---|---|---|---|---|---|---|---|---|---|
| VMT-Weighted Fixed Object to All Crash Ratio | VMT-Weighted Crash Rate | Fixed Object to All Crash Ratio | Crash Rate | ||||||
| Rural Divided | R4D | 73.8 | 396.69 | 824 | 264 | 0.33 | 0.69 | 0.33 | 0.48 |
| R4F | 252.2 | 2053.92 | 3156 | 1020 | 0.33 | 0.51 | |||
| R6F | 72 | 1615.98 | 1667 | 619 | 0.37 | 0.34 | |||
| All | 398 | 4066.59 | 5647 | 1903 | 0.35 | 0.46 | |||
| Urban Divided | U4D | 61.5 | 519.98 | 3449 | 430 | 0.18 | 2.21 | 0.14 | 1.01 |
| U4F | 121 | 2165.57 | 4579 | 1060 | 0.25 | 0.70 | |||
| U6F | 126.6 | 5052.58 | 12324 | 1644 | 0.14 | 0.81 | |||
| U8F | 45.3 | 2953.49 | 9593 | 1014 | 0.10 | 1.08 | |||
| U10F | Not Applicable (no suitable U10F routes available) | ||||||||
| All | 354.4 | 10691.62 | 29945 | 4148 | 0.15 | 0.93 | |||
Based on the available data, the selected Washington routes had similar crash characteristics to the correspondingly classified routes across the entire state. This was especially true for the rural divided roadways, urban undivided roadways, and the ratios of fixed object to total crashes. In general, the selected rural undivided and urban divided roadways have lower overall crash rates compared to all similarly classified roadways across the state.
3.3.8 Tennessee State Representative Routes and Data
A total of 11 routes were selected from Tennessee for inclusion, as summarized in Table 40. This included the total length of each route and a single year representation of traffic flow in units of MVMT. For each route, Table 40 shows the percentage of the total roadway length in each general HSM roadway type category.
Table 40. Summary Characteristics of Selected Tennessee State Routes
| Route Designation | Total Length (mi) | Single Year MVMT | Roadway Type (% of total length) | |||
|---|---|---|---|---|---|---|
| Rural Undivided | Urban Undivided | Rural Divided | Urban Divided | |||
| I-24 | 152.0 | 3690.24 | 0 | 0 | 52 | 48 |
| I-40 | 407.0 | 7757.26 | 0 | 0 | 60 | 40 |
| I-65 | 103.2 | 2449.13 | 0 | 0 | 54 | 46 |
| I-240 | 15.7 | 742.12 | 0 | 0 | 0 | 100 |
| SR 1 | 523.9 | 2085.82 | 41 | 29 | 14 | 16 |
| SR 15 | 256.0 | 756.02 | 18 | 12 | 59 | 11 |
| SR 155 | 25.5 | 540.06 | 0 | 18 | 0 | 82 |
| SR 33 | 161.6 | 598.54 | 65 | 20 | 11 | 4 |
| SR 34 | 153.2 | 825.05 | 27 | 17 | 21 | 35 |
| SR 69 | 145.4 | 182.26 | 86 | 13 | 0 | 1 |
| SR 386 | 12.5 | 271.20 | 0 | 0 | 0 | 100 |
Table 41 provides a comparison of the crash characteristics for the NCHRP 17-88 selected Tennessee routes to all similarly classified routes in the entire state. For the selected Tennessee routes of a given route type/subtype, the average crash rate was determined by summing the crash rate multiplied by the corresponding MVMT for each selected route and then dividing by the total MVMT for the same routes. A similar procedure was followed to determine the weighted ratio of fixed object crashes to total crashes. For each route type, the rightmost columns in Table 41 show the crash rate and fixed object to total crash ratio for all of the similarly classified Tennessee routes available.
| Route Type | Subtype | Sample Length [mi] | Total MVMT (1 year) | All Crashes (3 yrs) | Fixed Object Crashes (3 yrs) | Selected Routes | Entire State | ||
|---|---|---|---|---|---|---|---|---|---|
| VMT-Weighted Fixed Object to All Crash Ratio | VMT-Weighted Crash Rate | Fixed Object to All Crash Ratio | Crash Rate | ||||||
| Rural Undivided | RU2L2W | 473 | 780.81 | 917 | 174 | 0.23 | 1.62 | 0.29 | 1.76 |
| RUMLH | 57.4 | 238.68 | 136 | 11 | 0.10 | 1.32 | |||
| All | 530.4 | 1019.49 | 1053 | 185 | 0.20 | 1.55 | |||
| Urban Undivided | 2U/3T | 113.4 | 297.87 | 347 | 38 | 0.12 | 3.00 | 0.07 | 4.34 |
| 4U/5T | 132.5 | 1027.84 | 1958 | 115 | 0.05 | 4.95 | |||
| 6U | 18.4 | 200.17 | 687 | 23 | 0.03 | 8.77 | |||
| All | 264.3 | 1525.88 | 2992 | 176 | 0.06 | 5.07 | |||
| Rural Divided | R4D | 276.8 | 815.37 | 564 | 108 | 0.19 | 0.74 | 0.32 | 0.57 |
| R4F | 359.3 | 4827.72 | 1691 | 538 | 0.36 | 0.52 | |||
| R6F | 20.9 | 462.72 | 110 | 30 | 0.32 | 0.46 | |||
| All | 657 | 6105.81 | 2365 | 676 | 0.34 | 0.54 | |||
| Urban Divided | U4D | 174.3 | 1157.65 | 1037 | 76 | 0.07 | 2.63 | 0.15 | 1.50 |
| U4F | 169.4 | 3139.88 | 1443 | 338 | 0.30 | 0.77 | |||
| U6F | 62.9 | 2170.2 | 1355 | 219 | 0.20 | 1.11 | |||
| U8F | 71 | 3321.08 | 757 | 182 | 0.17 | 1.00 | |||
| U10F | 26.7 | 1457.71 | 346 | 48 | 0.17 | 1.09 | |||
| All | 504.3 | 11246.52 | 4938 | 863 | 0.20 | 1.14 | |||
Based on the available data, the selected Tennessee routes have crash characteristics similar to the correspondingly classified routes across the entire state. This was especially true for the rural divided roadways. In general, the selected rural undivided and urban divided roadways have lower overall crash rates compared to all similarly classified roadways across the state. Also, the selected urban undivided roadways have higher overall crash rates compared to all similarly classified roadways across the state.


