Applying the Safe System Approach to Transportation Planning, Design, and Operations (2025)
Chapter: Survey Results
Survey Results
Professional Role
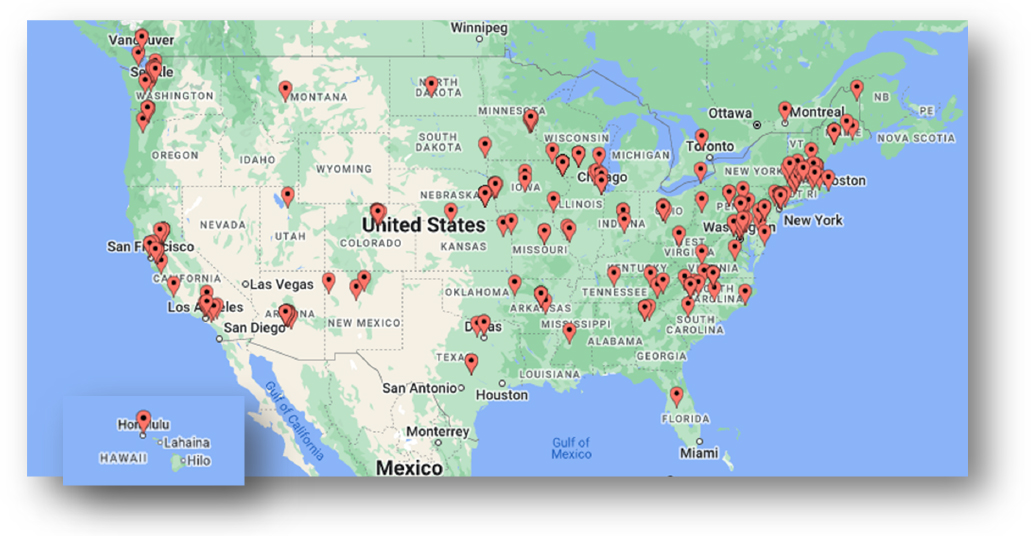
As seen in Figure 1, survey respondents were located across the United States, with concentrations in the Northeastern, Mid-Atlantic, and Western regions of the country, and fewer respondents from the Midwest and South regions. Professionally, as displayed in Table 2, respondents were roughly evenly distributed among those in public health, planning, engineering, and law enforcement. Slightly fewer respondents engaged in safety research, transportation policymaking, roadway maintenance, and emergency management. Nearly 8 percent of respondents reported having roles distinct from those available among the response options. Participants with different roles tended to be involved in advocacy and the management or administration of safety programming. Several respondents also engaged in safety education, whereas one respondent each was involved in transit safety, liability, or serving as an airport engineer (Table 2).
Table 2. Respondents’ primary professional roles.
| Professional Role | # | % |
|---|---|---|
| Public health, such as epidemiology or injury prevention | 83 | 20.9 |
| Law enforcement | 67 | 16.8 |
| Planning | 62 | 15. |
| Design of roads and streets | 55 | 13.8 |
| Road and street operations | 30 | 7.5 |
| Policy, including transportation policy | 23 | 5.8 |
| Research | 23 | 5.8 |
| Maintenance of roads and related facilities | 11 | 2.8 |
| Emergency management, such as emergency medical services (EMS) | 3 | 0.8 |
| Other roles | ||
| Managing safety programs | 25 | 6.3 |
| Advocacy | 7 | 1.8 |
| Safety education | 6 | 1.5 |
| Professional Role | # | % |
|---|---|---|
| Transit safety | 1 | 0.3 |
| Liability | 1 | 0.3 |
| Airport engineer | 1 | 0.3 |
| Total | 398 |
Professional Tenure
Table 3 displays the distribution of the number of years survey respondents have spent in their professional fields. About 62 percent of respondents have been in their fields for 15 years or fewer. Another 20 percent of respondents have been in their fields for between 16 and 25 years, and roughly 17 percent of respondents have been in their fields for 26 years or longer.
Table 3. Respondents’ professional tenure in their professional field.
| Tenure | # | % |
|---|---|---|
| 1 to 5 years | 104 | 26.1 |
| 6 to 10 years | 85 | 21.4 |
| 11 to 15 years | 59 | 14.8 |
| 16 to 20 years | 44 | 11.1 |
| 21 to 25 years | 40 | 10.1 |
| 26 to 30 years | 42 | 10.6 |
| More than 30 years | 24 | 6.0 |
| Total | 398 |
Organizational Climate
The research team factor analyzed 10 survey items designed to measure participants’ organizational climates and performed varimax rotation on the data to acquire the rotated factor loadings presented in Table 4. The cutoff for including an item within a factor was a rotated factor loading of at least |0.5| (–0.5 or +0.5). As displayed in the table, all item assigned to factors (or constructs) with factor loading > 0.5, indicating at least a moderate correlation with other items assigned to the same factor.
Table 4. Factor loadings of each of the organizational climate constructs.
| Factor 1 (Innovativeness) | Factor 2 (Fatalism) | Factor 3 (Individualism) | |
|---|---|---|---|
| Inn1* | 0.656 | ||
| Inn2 | 0.692 | ||
| Inn3* | 0.695 | ||
| Inn4 | 0.823 | ||
| Fatal1 | 0.565 | ||
| Fatal2 | 0.553 | ||
| Fatal3 | 0.856 | ||
| Ind1 | 0.520 | ||
| Ind2 | 0.557 | ||
| Ind3* | 0.612 |
Note:*Indicates reverse-coded items. Inn# = Innovativeness; Fatal# = Fatalism; and Ind# = Individualism.
Innovativeness (Inn)
The innovativeness construct was indicated by four items:
- Senior management like to keep to established, traditional ways of doing traffic safety (Inn1)
- People in this organization are always searching for new ways of looking at traffic safety problems (Inn2)
- Management is not interested in trying out new ideas to improve road user safety (Inn3)
- Management here is quick to spot the need to do traffic safety work differently (Inn4)
Mean = 2.972; SD = 0.603; Median = 3; Min = 1; and Max = 4
Fatalism (Fatal)
The fatalism construct was indicated by three items:
- There is talk here about how zero fatalities is impossible to achieve (Fatal1)
- People here believe we can build a system where no one dies (Fatal2)
- Management here often say we can reduce, but never eliminate road deaths (Fatal3)
Mean = 2.512; SD = 0.655; Median = 2.667; Min = 1; and Max = 4
Individualism (Ind)
The individualism construct was indicated by three items:
- People here know that traffic safety mostly depends on road users being sober and alert (Ind1)
- People here believe that road users are mostly responsible for their own safety (Ind2)
- People here are convinced that safe travel is beyond the control of individual road users (Ind3)
Mean = 2.945; SD = 0.587; Median = 3; Min = 1; and Max = 4
Table 5 presents Pearson product-moment correlations among the innovativeness, individualism, and fatalism constructs. It appears that innovativeness and fatalism maintained a moderate and negative correlation of –0.474, whereas all other inter-construct correlations were statistically insignificant.
Table 5. Correlations among Innovativeness, Individualism, and Fatalism constructs.
| Innovativeness | Individualism | Fatalism | |
|---|---|---|---|
| Innovativeness | 1 | ||
| Individualism | –0.076 | 1 | |
| Fatalism | –0.474* | 0.017 | 1 |
Note:* = p > 0.05.
As displayed in Table 6, models regressing the organizational climate constructs (i.e., innovativeness, individualism, and fatalism) onto indicator variables of professional role, tenure, and other organizational climate constructs reveal a few key findings. As reported by the models’ R2 values, the
fitted linear regressions explained between 24.8 and 31.7 percent of the variance in the organizational climate constructs.
First, organizational innovativeness was more commonly reported by policymakers and researchers than professionals affiliated with law enforcement, emergency management, engineering, planning, and operating roadways. Further, organizational fatalism was negatively related to organizations’ innovativeness. That is, every standard deviation increase in organizational fatalism is associated with a 0.403 standard deviation decrease in organizational innovativeness.
Second, organizational individualism was negatively associated with engineering, planning, and roadway operating professions, as well as with organizational innovativeness. More specifically, relative to professionals in other sectors, engineers, planners, roadway operators reported 0.198 standard deviations lower organizational individualism scores. Additionally, a standard deviation increase in organizational innovativeness was associated with a modest, though statistically significant decrease of 0.121 standard deviations in organizational individualism.
Last, organizational fatalism was strongly and negatively associated with organizational innovativeness. That is, one standard deviation increase in organizational innovativeness was related to a 0.565 decrease in organizational fatalism (Table 6).
Table 6. Linear regression results.
| Innovativeness | Individualism | Fatalism | ||||
|---|---|---|---|---|---|---|
| Coef | Robust SE | Coef | Robust SE | Coef | Robust SE | |
| Professional Role | ||||||
| Law Enforcement/Emergency Management | reference | reference | reference | |||
| Engineer/Planner/Operator | 0.056 | 0.074 | -0.198* | 0.076 | -0.075 | 0.084 |
| Policy/Research | 0.435* | 0.091 | 0.060 | 0.124 | 0.096 | 0.143 |
| Tenure | ||||||
| 1–5 years | reference | reference | reference | |||
| 6–10 years | -0.061 | 0.106 | -0.007 | 0.115 | -0.085 | 0.122 |
| 11–20 years | -0.108 | 0.105 | 0.189 | 0.106 | -0.142 | 0.124 |
| 21–31 years | 0.153 | 0.112 | 0.331 | 0.106 | 0.027 | 0.133 |
| 32 or more years | 0.169 | 0.147 | 0.350 | 0.214 | -0.110 | 0.189 |
| Innovativeness | --- | --- | -0.121* | 0.072 | -0.565* | 0.075 |
| Individualism | -0.102 | 0.061 | --- | --- | -0.025 | 0.070 |
| Fatalism | -0.403* | 0.045 | -0.021 | 0.059 | --- | --- |
| constant | 4.146 | 0.245 | 3.328 | 0.306 | 4.277 | 0.345 |
| R2 | 0.317 | 0.252 | 0.248 | |||
Note:*p < 0.05.
Opinion Leaders
The team identified four opinion leaders based on the number of mentions they received from survey respondents. The names of the professionals listed in Table 7 received at least 3 standard deviations above the mean number of mentions across all referenced professionals.
Table 9 provides information on those safety practices survey respondents appraised as both most impactful and feasible to implement.
Table 7. Opinion leading professionals according to survey respondents.
| Professional | Title | Location |
|---|---|---|
| Peter Furth | Professor, Northeastern University | Boston, MA |
| Peter Koonce | Transportation Engineer, PBOT | Portland, OR |
| John Milton | State Safety Engineer, WA DOT | Seattle, WA |
| Leah Shahum | Founder & Director, Vision Zero Network | San Francisco, CA |
Safety Practices Summary
Table 8. Interpretive categorization of Z-scores, with a mean of 0 and standard deviation of 1.
| Categories | Z-scores |
|---|---|
| High | > 1 SD above mean |
| Moderate | < 1 & > 0 |
| Low | > -1 & < 0 |
| Very Low | < -1 SD below mean |
Note: SD = standard deviation around the mean score.
Table 9. Top two most feasible and impactful safety practices.
| Policy | Planning | Design | Operations & Maintenance | Law Enforcement | Post-Crash Response |
|---|---|---|---|---|---|
| Installing leading pedestrian intervals with right-turn-on-red restrictions in areas with high pedestrian activity. | Incorporating road safety audits in project scoping/planning phases. | Improving sight distance at intersections by restricting parking at the corners (daylighting). | Installing leading pedestrian intervals with right-turn-on-red restrictions in areas with high pedestrian activity. | Instituting immediate administrative license revocation or suspension (ALR/ALS) for alcohol- and drug-impaired-driving offenses. | Forming a task force or community coalition of law enforcement, transportation, public health, members of the community, and other partners to investigate serious crashes and report findings and proposed changes to the public. |
| Updating NHTSA’s new car assessment program (NCAP) to include pedestrian detection and collision avoidance safety tests. | Prioritizing injury risk-based (systemic) safety assessments over crash “hot spot” or "black spot" approaches. | Installing centerline rumble strips on undivided highways. | Removing roadside objects that pose a danger when impacted upon a lane departure. | Instituting or enforcing a statewide primary enforcement seat belt use law, which would require occupants to wear seatbelts in the both the front and back seats and allow law enforcement officers to ticket occupants for not wearing a seatbelt, without other citable traffic infractions taking place. | Training law enforcement and transportation staff to coordinate on post-crash reporting at crash sites. |
Table 10 illustrates those safety practices survey respondents appraised as quite impactful from a safety perspective yet presently infeasible to implement.
Table 10. Top two practices perceived as the most impactful regardless of their feasibility.
| Policy | Planning | Design | Operations & Maintenance | Law Enforcement | Post-Crash Response |
|---|---|---|---|---|---|
| Implementing speed safety cameras (automated speed enforcement) that use revenues to improve safety. | Prioritizing injury risk-based (systemic) safety assessments over crash “hot spot” or “black spot” approaches. | Installing travel lane reconfiguratio ns (road diets) at multi-lane roads with fewer than 20,000 AADT. | Removing roadside objects that pose a danger when impacted on a lane departure. | Requiring alcohol ignition interlocks installed for all drivers convicted of driving under the influence (DUI). | Instituting automatic crash notification (ACN) for vehicle collisions with people walking, cycling, or rolling. |
| Updating NHTSA’s NCAP to include pedestrian detection and collision avoidance safety tests. | Implementing or expanding car-free zones in areas with high pedestrian activity. | Improving sight distance at intersections by restricting parking at the corners (daylighting). | Installing leading pedestrian intervals with right-turn-on-red restrictions in areas with high pedestrian activity. | Instituting or enforcing a statewide primary enforcement seat belt use law, which would require occupants to wear seatbelts in the both the front and back seats and allow law enforcement officers to ticket occupants for not wearing a seatbelt, without other citable traffic infractions taking place. | Forming a task force or community coalition of law enforcement, transportation, public health, members of the community, and other partners to investigate serious crashes and report findings and proposed changes to the public. |
As shown in Table 11, survey respondents involved in designing safety policy and research perceived the installation of leading pedestrian intervals as more feasible than had professionals working in roadway operations and maintenance. Moreover, law enforcement professionals considered instituting or enforcing a statewide universal motorcycle helmet law as more feasible to implement than had policy and research-oriented respondents. This same pattern held for the practice of instituting immediate administrative license revocation or suspension (ALR/ALS) for alcohol- and drug-impaired-driving offenses; that is, law enforcement professionals considering ALR/ALS as more feasible to implement than had policymakers and researchers.
Table 11. Diverse professionals’ perspectives on cross-domain safety practices.
| Domain | |||||
|---|---|---|---|---|---|
| Practice | Policy | Planning | Operations & Maintenance | Enforcement | Post-Crash Response |
| Installing leading pedestrian intervals with right-turn-on-red restrictions in areas with high pedestrian activity. | High Feasibility/Moderate Impact | Moderate Feasibility/Moderate Impact | |||
| Requiring alcohol ignition interlocks installed for all drivers convicted of DUI. | Moderate Feasibility/Moderate Impact | Moderate Feasibility/Moderate Impact | |||
| Instituting or enforcing a statewide primary enforcement seat belt use law, which would require occupants to wear seatbelts in both the front and back seats and allow law enforcement officers to ticket occupants for not wearing a seatbelt, without other citable traffic infractions taking place. | Moderate Feasibility/Moderate Impact | Moderate Feasibility/Moderate Impact | |||
| Instituting or enforcing a statewide universal motorcycle helmet law, which would require all motorcyclists to wear US DOT compliant helmets, regardless of the rider’s age or experience. | Low Feasibility/Moderate Impact | Moderate Feasibility/Moderate Impact | |||
| Instituting immediate administrative license revocation or suspension (ALR/ALS) for alcohol- and drug- | Low Feasibility/Low Impact | Moderate Feasibility/Moderate Impact | |||
| Domain | |||||
|---|---|---|---|---|---|
| Practice | Policy | Planning | Operations & Maintenance | Enforcement | Post-Crash Response |
| impaired driving offenses. | |||||
| Encouraging and facilitating public use of self-reporting (via mobile app or survey) to capture collisions and other events falling outside the scope of traditional crash reporting (e.g., near misses, pedestrian and bicyclist falls). | Moderate Feasibility/Low Impact | Low Feasibility/Low Impact | Low Feasibility/Low Impact | ||
| Developing joint action plans with emergency services partners to integrate operational planning with emergency services planning. | Moderate Feasibility/Moderate Impact | Moderate Feasibility/Low Impact | |||
| Forming a task force or community coalition of law enforcement, transportation, public health, members of the community, and other partners to investigate serious crashes and report findings and proposed changes to the public. | Low Feasibility/Low Impact | Moderate Feasibility/Moderate Impact | |||


